
Market valuation. Pixabay Image.
Tesla’s stock is expensive from a price-to-sales ratio and also from several other valuation metrics perspectives.
Let’s first look at the price-to-sales or revenue ratio.
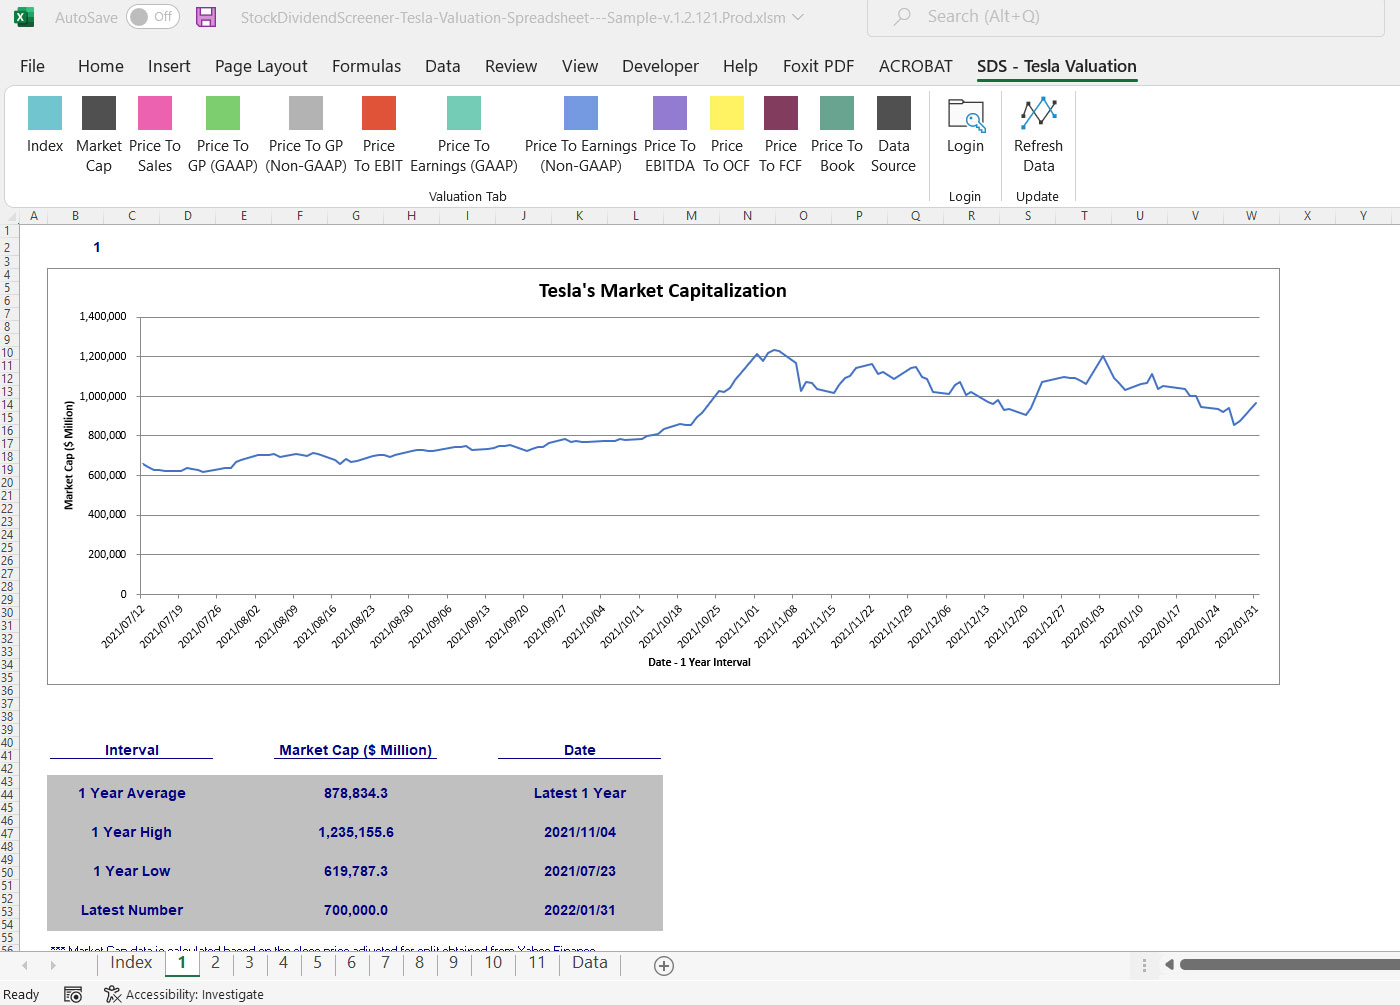
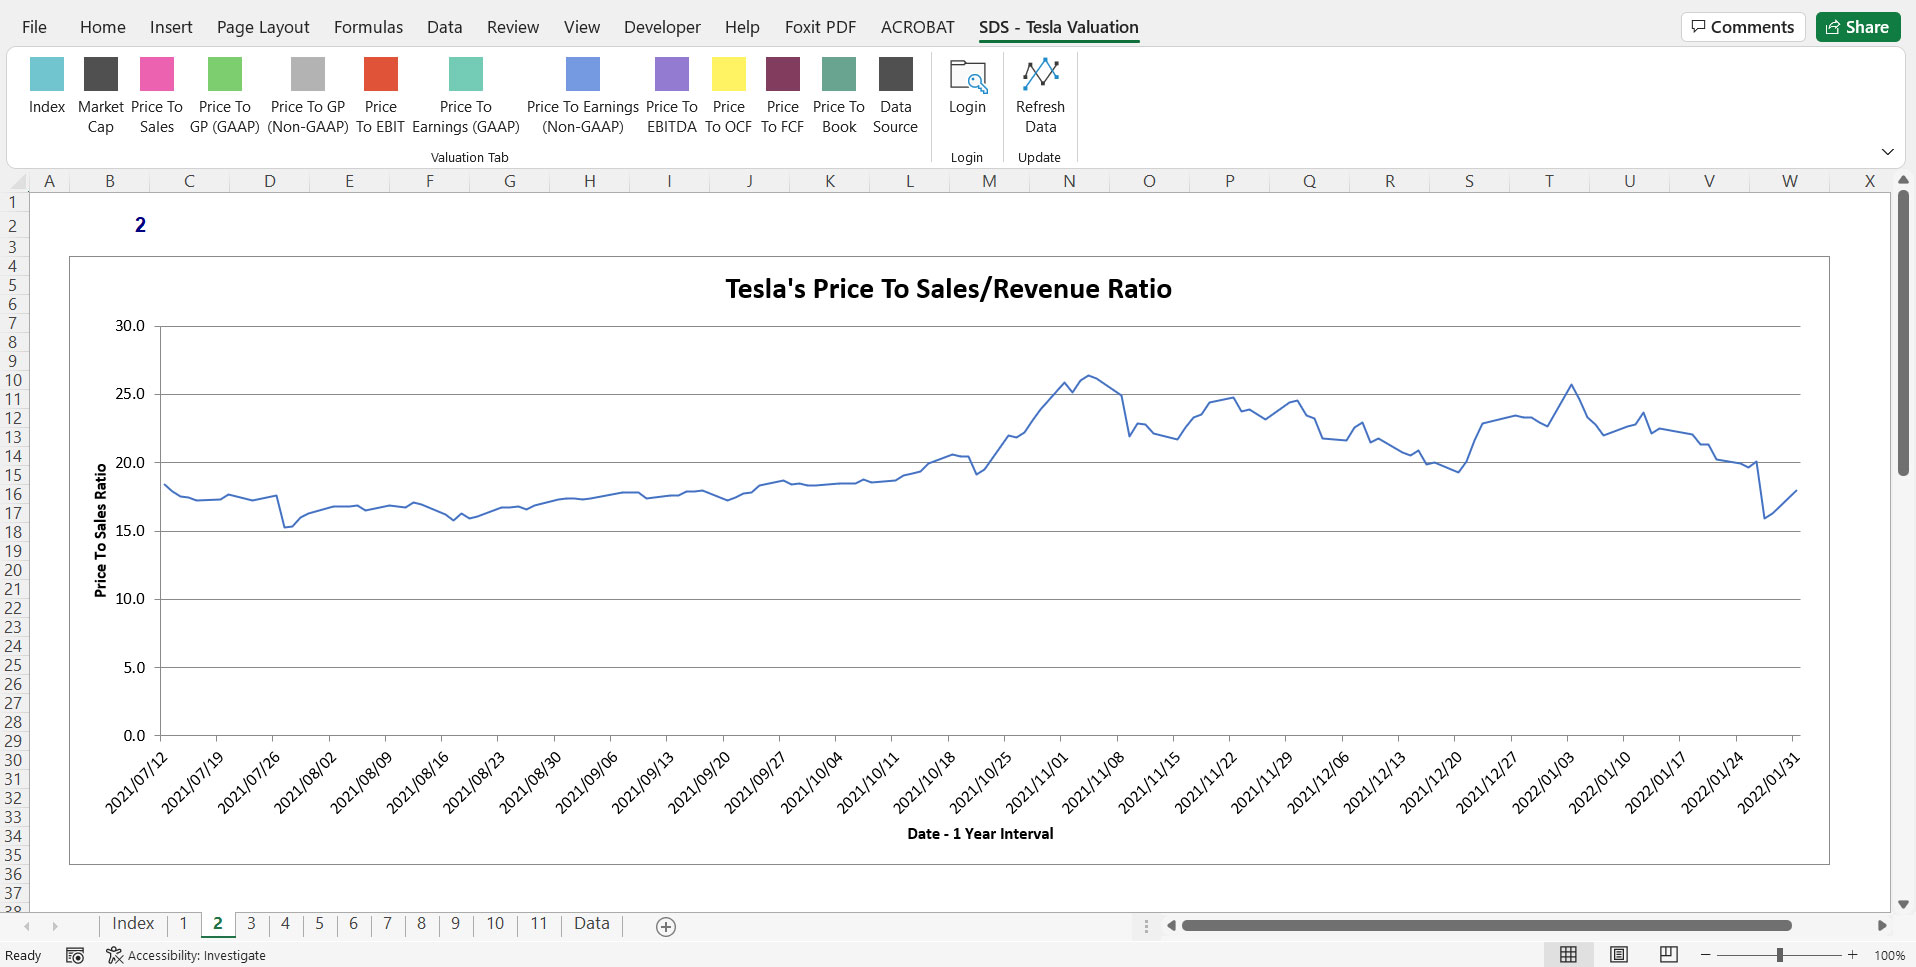
For your information, the stock of the electric carmaker has never been traded at a price-to-sales ratio below 10.0X in the last 2 years as shown in the plot below.

Tesla’s price to sales/revenue ratio
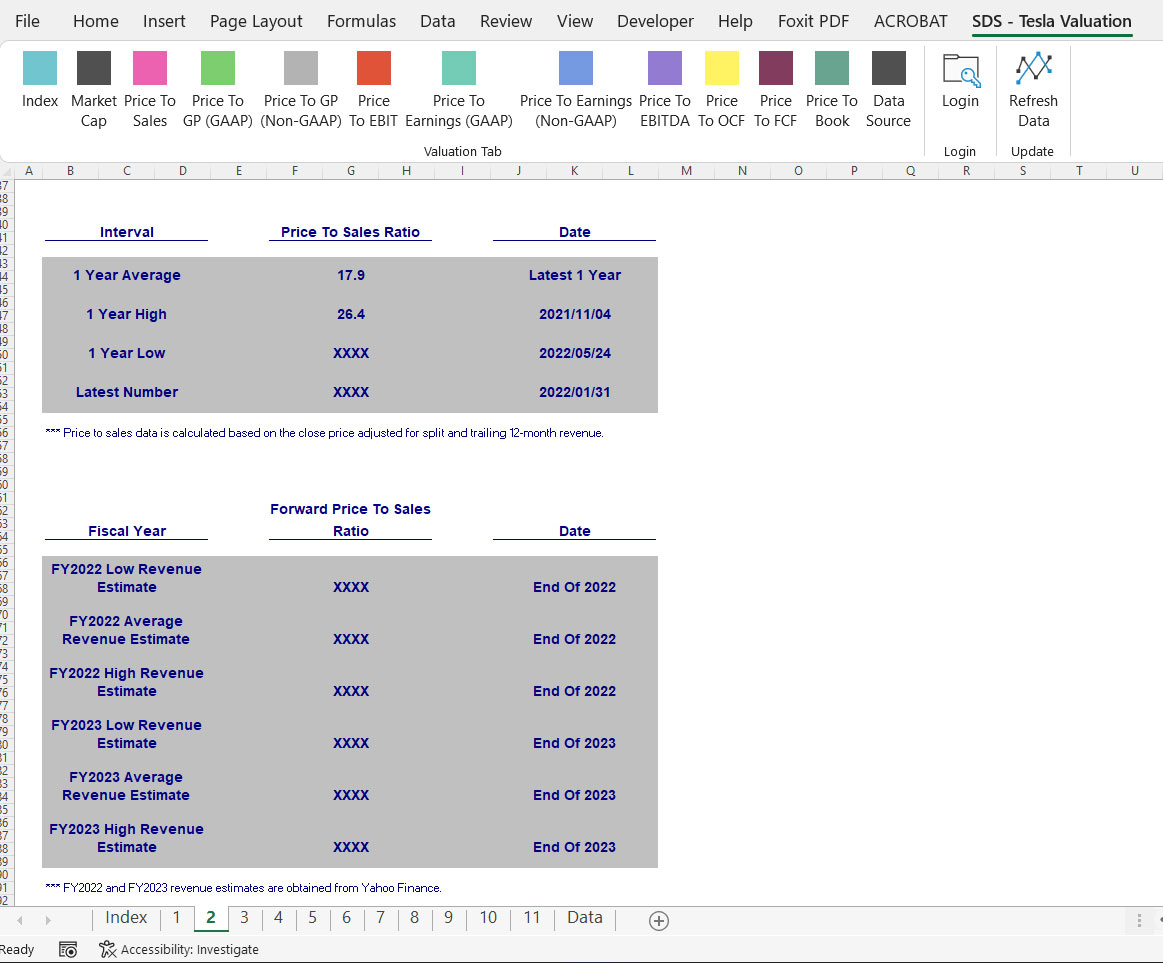
The lowest valuation that Tesla’s stock had gotten was about 10.5X as shown in the table below.

Tesla’s price to sales ratio table
In addition, Tesla’s stock also is expensive considering that the PE ratio (non-GAAP) averaged around 217X in the last 2 years.
The price-to-earnings (non-GAAP) ratio chart below shows that Tesla’s stock has a 2-year average PE ratio of more than 200.

Tesla’s price to earnings ratio
The lowest PE ratio that Tesla’s stock has had was 69.0X which occurred in May 2022.
As a result, Tesla’s stock has never been cheap and it will probably stay expensive in the foreseeable future considering that the outlook for EVs is strong.
Tesla’s Stock Valuation Topics
1. When Should You Buy Tesla’s Stock
2. Tesla’s Forward Valuation Ratios
3. Conclusion
When Should You Buy Tesla’s Stock

Tesla’s highlighted buy points
As Tesla’s stock has never been cheap, how do we find out what the best entry price is for the stock?
The fact is that there is really none.
As seen from prior discussion, Tesla’s stock has been traded at a sky-high valuation, with PE hovering above 200X and a price-to-sales ratio that has never been below 10X in the last 2 years.
Honestly, if you are planning to hold the stock for a long time, buying the dip may possibly be your best bet.
The thing is that it is difficult to look for the bottom of the stock, even for the most experienced chartists.
However, there is one thing we can do and that is to minimize as much risk as we can when buying Tesla’s stock.
In this aspect, we can buy Tesla’s stock when its current market valuation is reasonably low compared to historical figures and also the forward ratios (more on the forward ratios).
For example, the chart above shows that there are several entry points (highlighted in red circles).
These are low-risk entry points because right after you buy the stock at these points, it almost always bounces back thereafter.
For example, in February 2022, Tesla’s stock was traded at $800 USD when the valuation ratio was around 15X.
If you had bought the stock at $800, you would have a gain of nearly 40% when the valuation rose above 20X in April 2022 (the stock price was more than $1,100).
You can apply the same methodology to other valuation metrics which are available in the spreadsheet.
Tesla’s Forward Valuation Ratios

Tesla’s valuation ratio comparison
In addition to comparing the current market valuation with respect to historical data, you can also compare the current valuation with respect to the forward ratios.
As shown in the table above, when Tesla’s stock is traded at a current valuation that is close to its 6-month, 1-year or 2-year lows, it is almost always true that the forward ratios will also be close to the multi-year lows.
In other words, when such a trend occurs, it means that Tesla’s stock has most likely dipped low enough to be a buy point.
What follows will definitely be a bounce back for the stock as seen in the prior chart.
Keep in mind that we are looking at the most pessimistic revenue estimate for fiscal 2022 and 2023 in the table above.
Also, the forward valuation ratios shown in the table above were even lower back in May and June when Tesla’s stock price was below $700 USD.
Therefore, these are the buy points that should give us a risk-to-reward ratio of almost zero as the stock is bound to go higher in the future.
Conclusion
With the help of the Tesla Valuation Excel Spreadsheet, buying Tesla’s stock should not be a complicated process.
In fact, the tool has made the analysis of Tesla’s stock super easy.
In this aspect, as soon as the stock valuation (price to sales/revenue and many other valuation metrics) dips to multi-year lows and coupled with the forward valuation ratios analysis, you can be sure that you are buying the stock at a very reasonable low-risk entry point.
Therefore, go ahead and get a copy of the tool here:
It uses market prices, both current and historical figure, to see how the stock has been traded with respect to various fundamental data such as revenue, earnings, cash flow, etc.
Aside from the GAAP metrics, the tool also measures valuation with respect to Non-GAAP metrics, including the company-adjusted EBITDA.
$9.90 for 1 year of customer support.
Unlimited query and lifetime usage even after the 1-year membership expires.
Get the Ford Valuation spreadsheet for only $9.90 now!
Read Here About The T&Cs Before Making The Purchase
- You need to have Microsoft Excel (Version 2007 and onward) installed on your PC to use this spreadsheet.
- The Excel spreadsheet has ONLY been tested on Windows. NOT sure if the Mac version will work.
- The Tesla Valuation Excel Spreadsheet requires an internet connection to work.
- Also, you need to enable Macro (a set of automation) in the Excel spreadsheet as it relies on Macro to fetch stock prices and fundamental data over the internet.
- Do note that there is NO refund for the purchase as the product is a digital product in which it cannot be refunded.
- Please provide a valid email as the download link will be sent to your email.
- For any inquiries, you can send an email to support@stockdividendscreener.com.
References and Credits
1. All financial figures in this article were obtained and referenced from Tesla Valuation Excel Spreadsheet which are available in Tesla Valuation Spreadsheet.
2. Image by Gerd Altmann from Pixabay
Top Statistics For Investors
- How I found the bottom and gain 20% in Tesla’s stock?
- Philip Morris International’s top 5 cigarette brands by market share
- AB InBev’s cash metrics – cash on hand and free cash flow
- General Motors’ car sales and market share in China, South America and North America
- Tesla’s car sales vs that of Chinese EV companies
Disclosure
The content in this article is for informational purposes only and is neither a recommendation nor a piece of financial advice to purchase a stock.
If you find the information in this article helpful, please consider sharing it on social media and also provide a link back to this article from any website so that more articles like this one can be created in the future. Thank you!