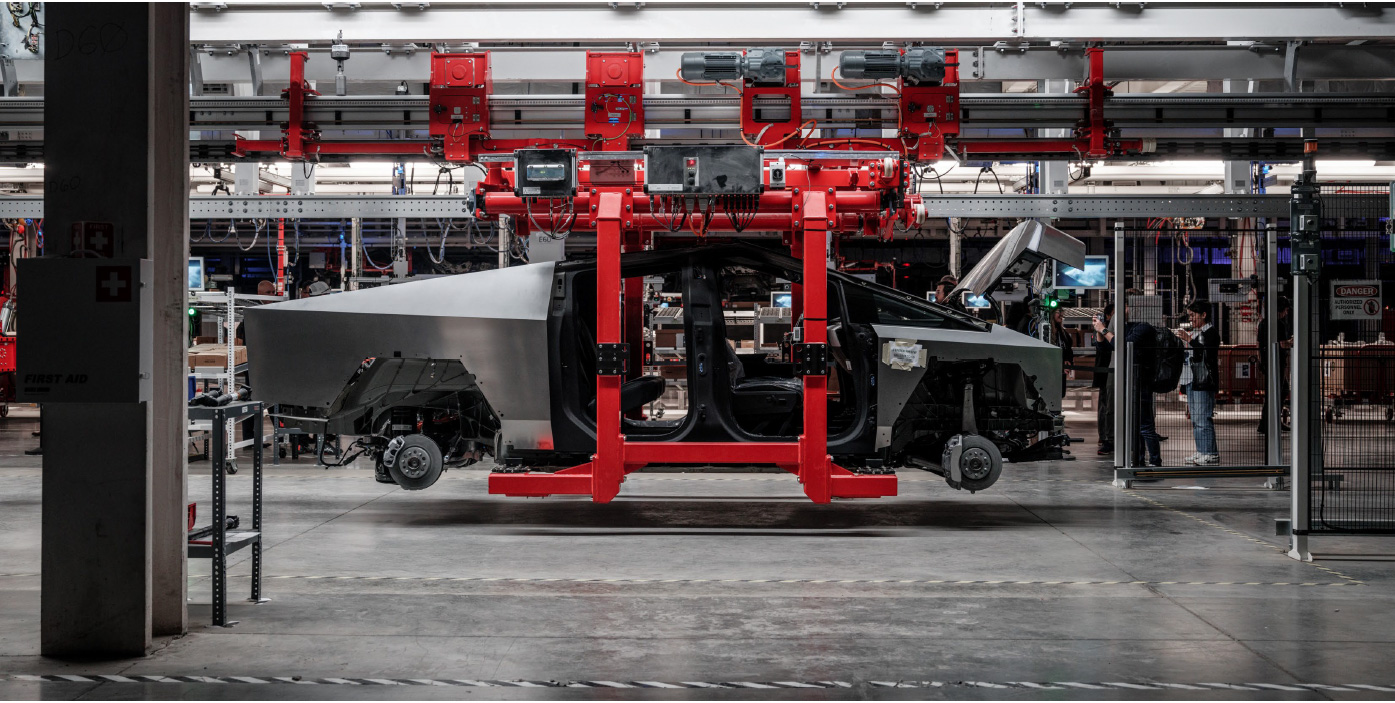
Cybertruck production line. Source: Tesla Update Letter.
This article tracks Tesla’s interest expense and interest coverage ratio.
We will keep track of Tesla’s interest expense and find out how its debt expense changes over time.
In addition, we also examine Tesla’s interest coverage ratio or times interest earned ratio. These ratios evaluate whether Tesla can service its debt.
Let’s dive in!
Please use the table of contents to navigate this page.
Table Of Contents
Definitions And Overview
Interest Expense
A1. Interest Expense By Quarter
A2. Interest Expense By TTM
Income
B1. Operating Income
B2. EBITDA
Interest Coverage
C1. Interest Coverage With Respect To Operating Income
C2. Interest Coverage With Respect To EBITDA
Conclusion And Reference
S1. Conclusion
S2. References and Credits
S3. Disclosure
Definitions
To help readers understand the content better, the following terms and glossaries have been provided.
Interest Coverage Ratio: The interest coverage ratio (also called times interest earned ratio) is a financial metric that measures a company’s ability to pay interest on its outstanding debt. It is calculated by dividing a company’s earnings before interest and taxes (EBIT) by interest expenses.
The resulting ratio indicates how many times a company’s profits can cover its interest payments. A higher interest coverage ratio means a company can better meet its interest obligations and is considered less risky to lenders and investors.
EBITDA: EBITDA stands for Earnings Before Interest, Taxes, Depreciation, and Amortization. It is a financial metric to evaluate a company’s operating performance and cash flow.
EBITDA helps to determine a company’s profitability by looking at its revenue minus all of the expenses that are directly related to its operations, such as cost of goods sold, salaries, and overhead costs, but excluding non-operating expenses such as interest, taxes, depreciation, and amortization.
Investors and analysts often use this metric to compare the financial performance of different companies in the same industry.
Interest Expense By Quarter
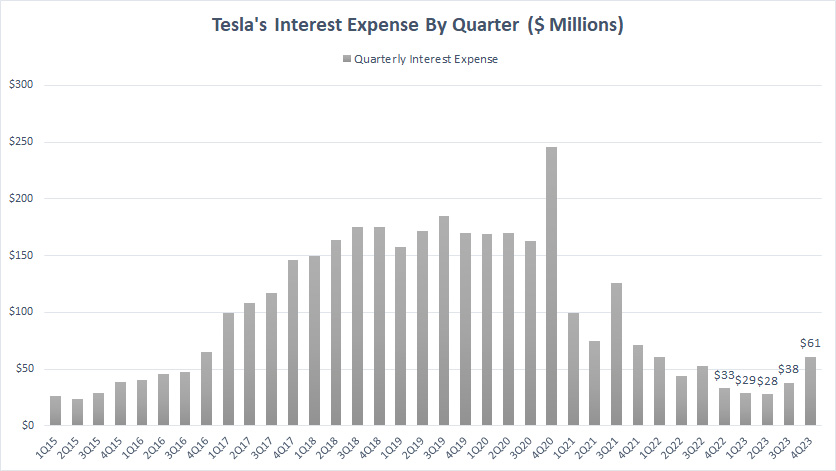
Tesla interest expense – quarterly
Tesla incurred interest expenses of US$61 million, US$38 million, US$28 million, and US$29 million for the quarters ended on Dec 31, Sept 30, June 30, and March 31, 2023, respectively.
Tesla’s quarterly interest expense has significantly declined compared to pre-pandemic periods.
The decrease in Tesla’s quarterly interest expenses in recent periods is due to the reduction of the company’s total indebtedness, as presented in this article: Tesla debt levels.
Interest Expense By TTM
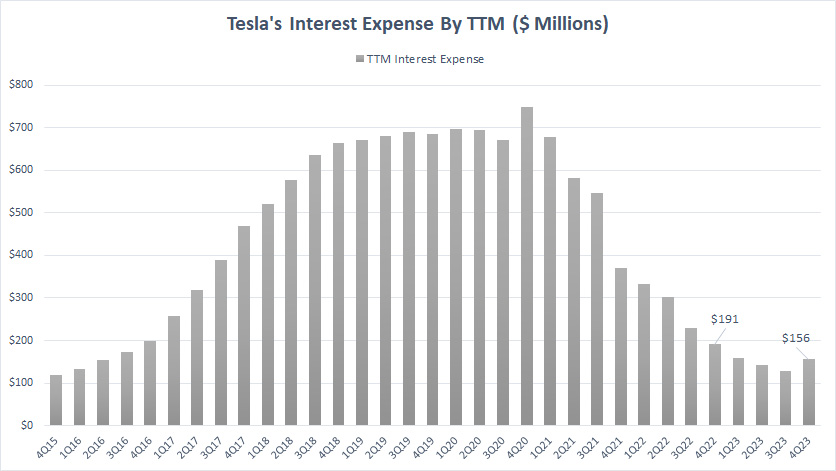
Tesla interest expense – ttm
The TTM plot above clearly depicts the reduction in Tesla’s interest expenses in post-pandemic time.
As of 4Q 2023, Tesla’s interest expense totaled only US$156 million, down 18% from a year ago and a record low over three years.
Operating Income
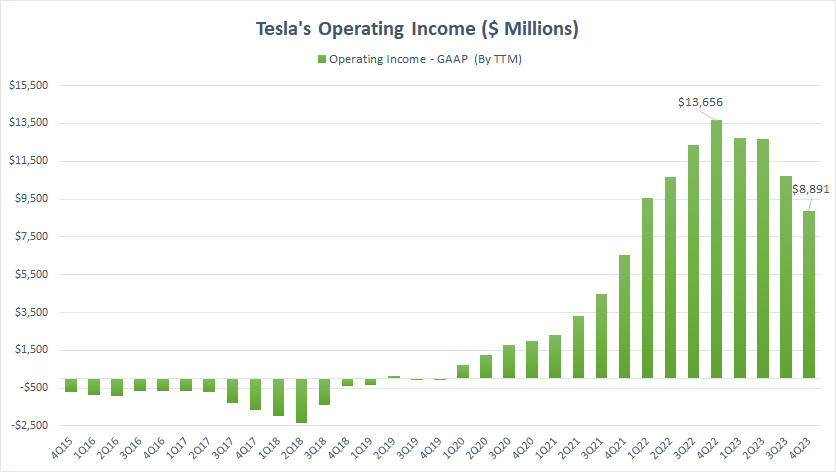
Tesla EBIT or operating income
The operating income reflects Tesla’s profit before interest expense and taxes.
Tesla’s operating income has significantly risen since fiscal 2021, demonstrating the company’s solid capability in turning a profit.
As of 2024 Q4, Tesla’s operating income reached US$8.9 billion on a TTM basis, down 35% from a year ago.
Despite the decline in operating income over the past several quarters, Tesla remains hugely profitable, with an operating profit of $9 billion.
EBITDA
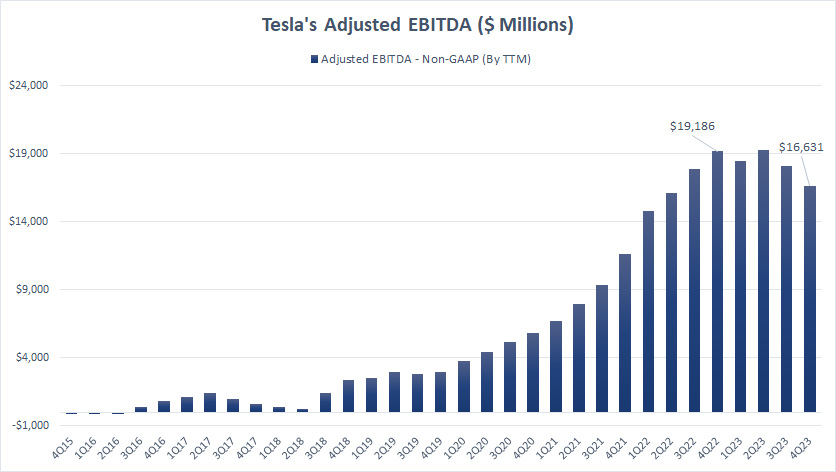
Tesla EBITDA
The definition of EBITDA is available here: EBITDA. The EBITDA further refines Tesla’s profit by excluding depreciation and amortization expenses.
Therefore, the EBITDA is considered as a form of cash flow before changes in working capital.
That said, Tesla earned US$16.6 billion in adjusted EBITDA as of 4Q 2023, down slightly from a year ago.
Again, Tesla remains hugely profitable, with an adjusted EBITDA exceeding US$16 billion.
Interest Coverage With Respect To Operating Income
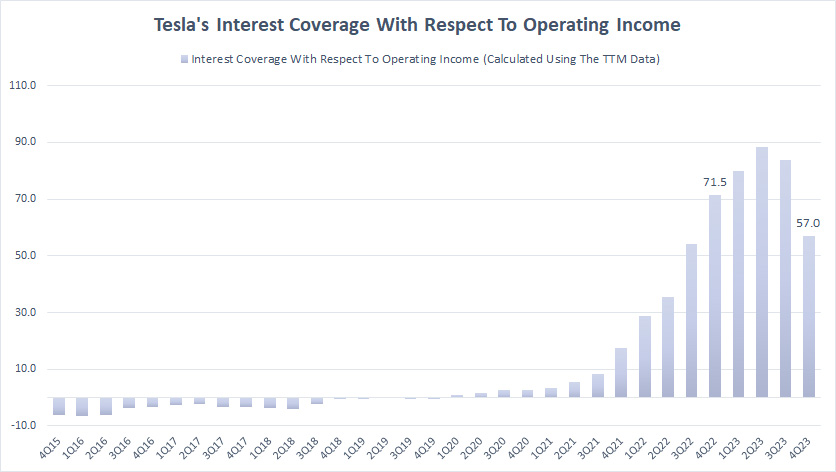
Tesla interest coverage ratio wrt EBIT
The definition of interest coverage ratio is available here: Interest Coverage Ratio.
As Tesla remains massively profitable with an operating income close to US$9 billion, the interest coverage ratio reached 57.0X in the latest quarter, demonstrating that Tesla has no problem covering its interest expenses with the operating income.
Interest Coverage With Respect To EBITDA
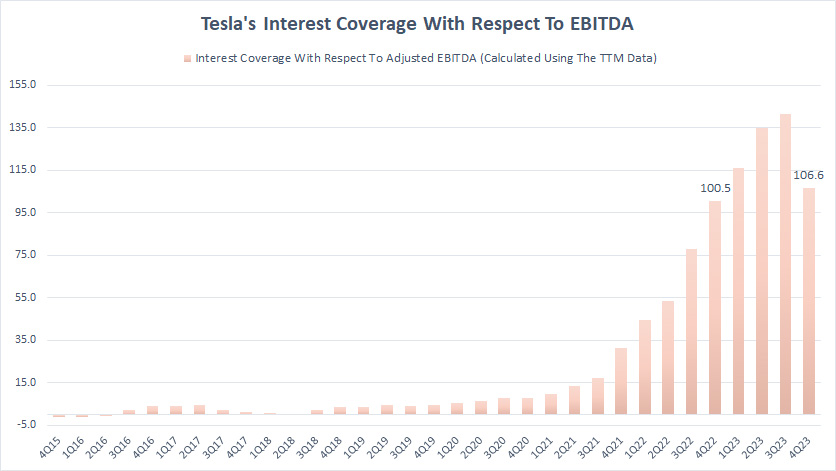
Tesla interest coverage ratio wrt EBITDA
The definition of interest coverage ratio is available here: Interest Coverage Ratio.
Tesla’s profit excluding depreciation and amortization (EBITDA) is more than 100X higher than the interest expense, indicating that the EV maker can easily service its debt expense.
Conclusion
Tesla remains hugely profitable, with an operating income close to US$9 billion, while the adjusted EBITDA exceeds US$16 billion.
Tesla’s massive profit can easily pay off the interest expense. In addition, Tesla’s interest expense has significantly decreased in recent quarters, primarily driven by the decreasing indebtedness.
References and Credits
1. All financial figures presented in this article were obtained and referenced from Tesla’s quarterly and annual statements, earnings releases, investor letters, SEC filings, etc., which are available in Tesla Investor Overview.
2. Featured images are used under Creative Commons Licenses and obtained from Jakob Härter.
Disclosure
References and examples such as tables, charts, and diagrams are constantly reviewed to avoid errors, but we cannot warrant the total correctness of all content.
The content in this article is for informational purposes only and is neither a recommendation nor a piece of financial advice to purchase a stock.
If you find the information in this article helpful, please consider sharing it on social media and provide a link to this article from any website so that more articles like this can be created.
Thank you!

