JUUL pods
This article briefly discusses about Altria’s (NYSE: MO) liquidity.
We will examine Altria’s liquidity from the perspective of the current ratio, working capital, and quick ratio (acid test ratio).
These liquidity ratios focus mainly on Altria’s short-term liquidity, which covers the company’s ability to meet its short-term obligations using its current assets.
That said, the current ratio, working capital, and quick ratio can quickly give investors a high-level view of a company’s short-term liquidity.
A higher liquidity ratio indicates that a company has enough current assets to cover its current liabilities, which is generally considered a positive sign of financial health.
Let’s explore Altria’s liquidity!
Please use the table of contents to navigate this page.
Table Of Contents
Overview And Definitions
- Current Ratio
- Working Capital
- Quick Ratio
- Cash Ratio
- Credits From Capital Market
- Cash Flow From Operating Activities
Liquidity Ratios
A1. Current Ratio
A2. Working Capital
Liquidity Under Stressed Test
B1. Quick Ratio (Acid Test Ratio)
B2. Cash Ratio
Other Liquidity
C1. Cash, Available Credits, And Cash Flow
Cash Flow
D1. Net Cash Provided By Operating Activities
Conclusion And Reference
S1. Conclusion
S2. References and Credits
S3. Disclosure
Definitions
To help readers understand the content better, the following terms and glossaries have been provided.
Current Ratio: The current ratio is a financial metric that measures a company’s ability to meet its short-term obligations using its current assets. It is calculated by dividing a company’s current assets by its current liabilities.
The current ratio is a liquidity ratio that indicates a company’s ability to pay off its short-term debts using its current assets. A higher current ratio generally means a better financial position for a company, as it has enough current assets to cover its current liabilities.
Current Ratio = Current Assets / Current Liabilities
Working Capital: Working capital is a financial metric representing the difference between a company’s current assets and current liabilities.
In other words, it is the amount of money a company has available for its day-to-day operations. A positive working capital means that a company has enough current assets to cover its current liabilities, which indicates its financial health and ability to meet its short-term obligations.
On the other hand, a negative working capital means that a company may have difficulty paying off its short-term debts using its current assets.
Working Capital = Current Assets – Current Liabilities
Quick Ratio: The quick ratio is a financial metric that measures a company’s ability to meet its short-term obligations using its most liquid assets, such as cash, marketable securities, and accounts receivable.
It is also known as the acid-test ratio. The quick ratio is calculated by dividing a company’s quick assets by its current liabilities. A higher quick ratio indicates that a company can pay off its short-term debts using its most liquid assets, which is generally considered a positive sign of financial health.
Quick Ratio = (Quick Assets Or Most Liquid Assets) / Current Liabilities
Cash Ratio: The cash ratio is a financial metric that measures a company’s ability to meet its short-term obligations using its most liquid assets, specifically cash and cash equivalents. It is calculated by dividing a company’s cash and cash equivalents by its current liabilities.
The cash ratio is a more conservative liquidity measure than the current or quick ratio, as it only considers the most liquid assets a company has to cover its obligations. A higher cash ratio indicates that a company can pay off its short-term debts using its cash reserves, generally considered a positive sign of financial health.
Cash Ratio = Cash & Cash Equivalents / Current Liabilities
Credits From The Capital Market: Credits from the capital market refer to the various forms of financing that companies can obtain from the financial markets.
This can include issuing bonds, taking out loans, or selling shares of stock to investors. These forms of financing can provide a company with the capital it needs to fund its operations, invest in growth initiatives, or pay off existing debt.
Companies may seek credit from the capital market when they are unable to obtain financing from traditional sources or when they need to raise more capital than they can obtain through traditional means.
Cash Flow From Operating Activities: Cash flow from operating activities is an accounting metric used to measure the cash generated or used by a company’s daily business operations.
This includes cash inflows and outflows related to revenue generation, such as sales, accounts receivable, inventory, and expenses like salaries, rent, and taxes.
Essentially, it represents the cash generated or used by a company’s core operations, excluding cash flows related to investing or financing activities. It is a key metric analysts and investors use to evaluate a company’s ability to generate cash flow from its primary operations.
Current Ratio
Altria current ratio
(click image to expand)
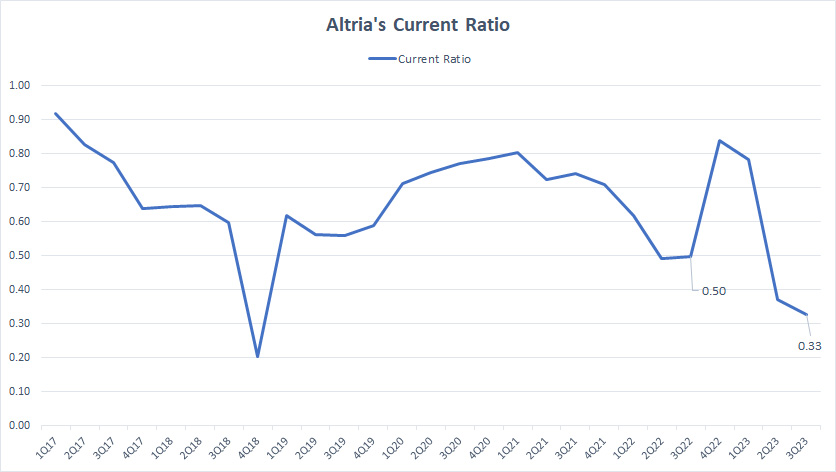
Altria’s current ratio is below 1.0X in all periods, indicating that the company’s current assets are insufficient to cover its current liabilities.
Altria’s current ratio averaged 0.70X between 2017 and 2023. As of 3Q 2023, the current ratio stood at 0.33X, which was way below the 1.0X safety threshold and the historical average.
Therefore, Altria appears to have insufficient current assets to meet its short-term obligations. Is there a liquidity problem for Altria?
Working Capital
Altria working capital
(click image to expand)
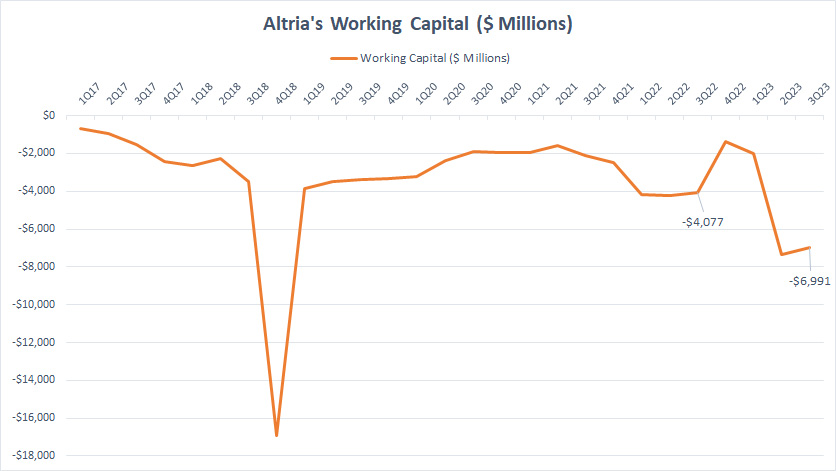
Altria experiences negative working capital in all periods shown, indicating insufficient current assets to meet the current liabilities.
As of 3Q 2023, Altria had a massive working capital deficit of US$7.0 billion.
Altria is experiencing negative working capital. How can the company resolve this shortfall?
Quick Ratio (Acid Test Ratio)
Altria quick ratio
(click image to expand)
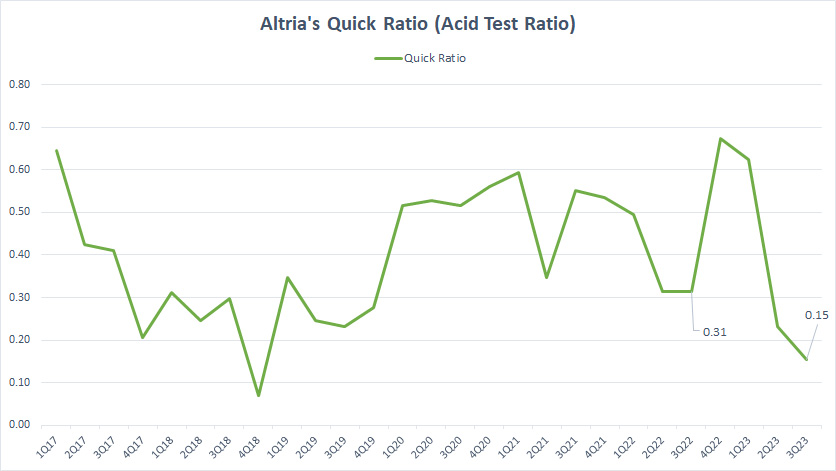
Altria’s quick ratio is much worse when considering only the company’s most liquid assets, such as cash, investments, short-term securities, receivables, etc.
As shown in the chart above, Altria’s quick ratio was only 0.15X as of 3Q 2023, indicating a massive shortage in the company’s most liquid assets compared to the current liabilities.
Is there a liquidity crisis for Altria?
Cash Ratio
Altria-cash-ratio
(click image to expand)
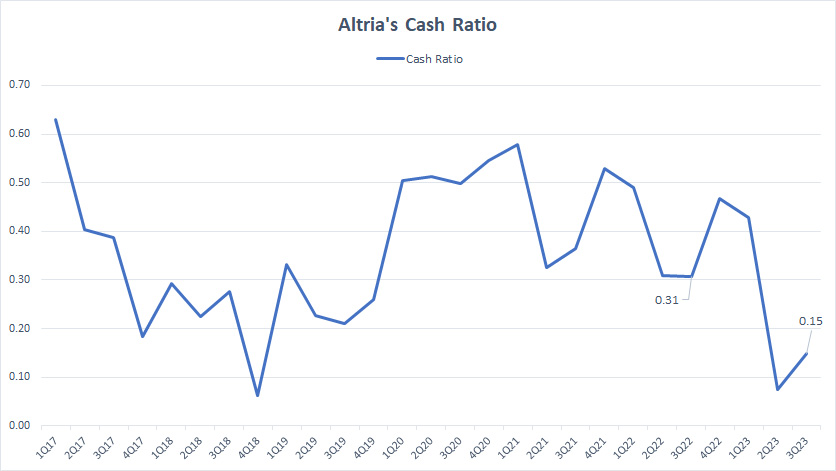
When considering only the cash and cash equivalents, Altria’s liquidity is at a massive shortfall compared to its current liabilities.
As shown in the chart above, Altria’s cash ratio was only 0.15X as of 3Q 2023, indicating that the company’s cash and cash equivalents alone were far from sufficient to cover all current liabilities.
Cash, Available Credits, And Cash Flow
Altria’s liquidity data are obtained from the 3Q 2023 quarterly report dated 30 Sept 2023.
| Sources Of Liquidity | US$ Billions | |
|---|---|---|
| Committed Capacity | Available Capacity | |
| Available Cash | ||
| Cash & Cash Equivalents | – | $1.5 |
| Restricted Cash | – | $0.1 |
| Credits From The Capital Market | ||
| Credit Agreement | – | $3.0 |
| Credit Lines | – | – |
| Cash Flow | ||
| Consolidated Operating Cash Flow | – | $8.4 (estimated) |
| Total Liquidity | ||
| Total | – | $13.0 |
While Altria may seem to have insufficient current assets to cover all current liabilities, the company does not just rely on its current assets; more specifically cash on hand, to meet its short-term obligations.
As shown in the table above, Altria has other sources of liquidity, including credits from the capital market and operating cash flow apart from cash reserves at the bank.
For example, Altria’s available credits totaled as much as US$3 billion as of fiscal Q3 2023 under a 5-year revolving credit agreement.
In addition to the available credits, Altria also relies on the cash flow provided by operating activities to meet its cash requirements.
Altria’s cash flow from operating activities alone is estimated at over US$8 billion per year, a massive figure by all measures.
In short, Altria’s capital access, coupled with the cash flow provided by operating activities, should meet all of the company’s short-term obligations.
Therefore, Altria does not need to keep many current assets, specifically cash, to satisfy its short-term liabilities.
On a side note, Altria’s combined liquidity of US$13 billion, shown in the table above, is sufficient to meet its US$10 billion in current liabilities dated as of Sept 30, 2023.
Net Cash Provided By Operating Activities
Altria net cash flow from operating activities
(click image to expand)
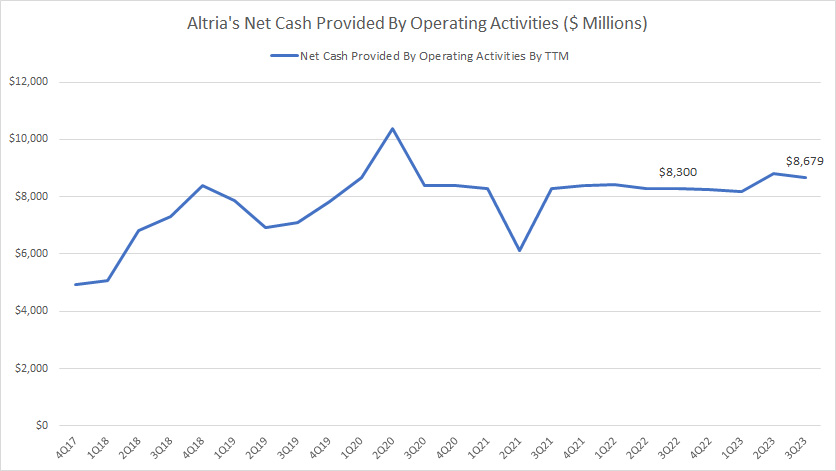
The plot above depicts Altria’s solid and stable cash flow from operating activities.
Altria’s net cash from operating activities averaged US$7.8 billion between 2017 and 2023.
In addition, Altria has never had any negative cash flow from operating activities for all periods presented.
In short, Altria is not short of cash, and the negative liquidity ratios should not be a problem for the company.
Conclusion
To recap, all of Altria’s liquidity ratios are below the ideal threshold of 1.0X, indicating insufficient current assets, liquid assets, or cash to meet all short-term obligations.
While Altria may seem to lack liquidity, the company has been doing just fine with little working capital.
The reason is that Altria has a US$3 billion access to the capital market for short-term financing while also generating massive amount of operating cash flow, which averages around US$7.8 billion.
In short, Altria should be just fine despite the negative liquidity ratios and the seemingly low working capital presented in the balance sheets.
Therefore, there is little concern for Altria’s poor liquidity ratios.
References and Credits
1. All financial figures presented in this article were referenced and obtained from Altria’s annual and quarterly reports, press releases, investor presentations, SEC filings, earnings letters, etc., which are available at Altria’s Earnings Release.
2. Featured images in this article are used under a Creative Commons License and sourced from the following websites: Aaron Yoo and Kelley Minars.
Disclosure
References and examples such as tables, charts, and diagrams are constantly reviewed to avoid errors, but we cannot warrant the total correctness of all content.
The content in this article is for informational purposes only and is neither a recommendation nor a piece of financial advice to purchase a stock.
If you find the information in this article helpful, please consider sharing it on social media and provide a link to this article from any website so that more articles like this can be created.
Thank you!

