Marlboro. Pixabay Image
This article presents the comparison of profit margin between Philip Morris International (NYSE: PM) and Altria Group (NYSE: MO).
For your information, Philip Morris International and Altria Group used to be in the same conglomerate but they split up more than 10 years ago.
Now, both companies operate independently, with each having its own stock symbols and also with headquarters located in different locations.
Let’s look at the details!
Investors interested in the statistics of both companies may find more resources on these pages: PMI market share, PMI revenue breakdown, Altria sales and market share, and Altria revenue breakdown.
Please use the table of contents to navigate this page.
Table Of Contents
Overview And Definitions
GAAP Margins
A1. Gross Margin – GAAP
A2. Operating Income Margin – GAAP
A3. Net Margin – GAAP
Non-GAAP Margins
B1. Adjusted Operating Income Margin – Non-GAAP
B2. Adjusted EBITDA Margin – Non-GAAP
Conclusion And Reference
S1. Conclusion
S2. References and Credits
S3. Disclosure
Definitions
To help readers understand the content better, the following terms and glossaries have been provided.
Adjusted Operating Income: Adjusted operating income is a measure of a company’s profitability that excludes certain items that may be considered non-recurring or not directly related to its core operations. This can include things like:
- Restructuring charges: Costs associated with reorganizing the company’s operations.
- Asset impairments: Write-downs of the value of assets.
- Non-operating income: Revenue that comes from activities outside the core business, like investment income.
- Litigation expenses: Legal costs that are unusual or non-recurring.
By excluding these items, adjusted operating income aims to provide a clearer picture of the company’s underlying performance and profitability.
Adjusted EBITDA: EBITDA stands for Earnings Before Interest, Taxes, Depreciation, and Amortization. It’s a financial metric that measures a company’s overall financial performance and is often used as an alternative to net income. Here’s a breakdown of what it excludes:
- Interest: The cost of debt financing.
- Taxes: Government-imposed charges.
- Depreciation: The reduction in the value of tangible assets over time.
- Amortization: The reduction in the value of intangible assets over time.
By excluding interest, taxes, depreciation, and amortization, EBITDA provides a clearer view of a company’s operational profitability and cash flow generation, making it easier to compare the performance of different companies regardless of their capital structure, tax rates, and investment decisions.
Adjusted EBITDA goes a step further by excluding additional items such as:
- Non-recurring expenses: One-time costs like restructuring charges.
- Unusual items: Any out-of-the-ordinary expenses or revenues.
- Non-operating income: Income from activities not related to the core business, like investment income.
By excluding these items, adjusted EBITDA aims to provide a more accurate measure of a company’s ongoing operational performance and profitability.
Gross Margin – GAAP
gross-margin
(click image to enlarge)
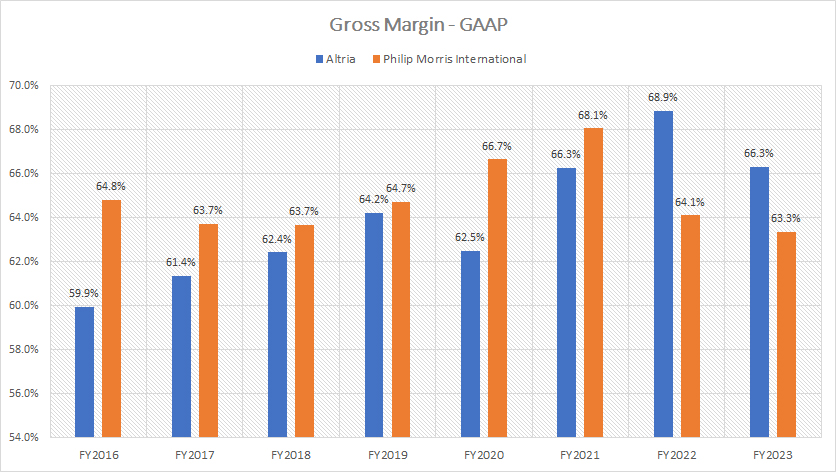
Altria generates slightly higher gross margin than Philip Morris International, as depicted in the chart above.
Over the last three years, Altria’s gross margin has averaged 67% versus Philip Morris International’s 65%. In fiscal year 2023, Altria’s gross margin surged to 66% while Philip Morris International’s gross margin remained at 63%.
Philip Morris International used to generate much better gross margin than Altria Group. However, Altria’s profitability has significantly surpassed Philip Morris International in recent years.
Operating Income Margin – GAAP
operating-margin
(click image to enlarge)
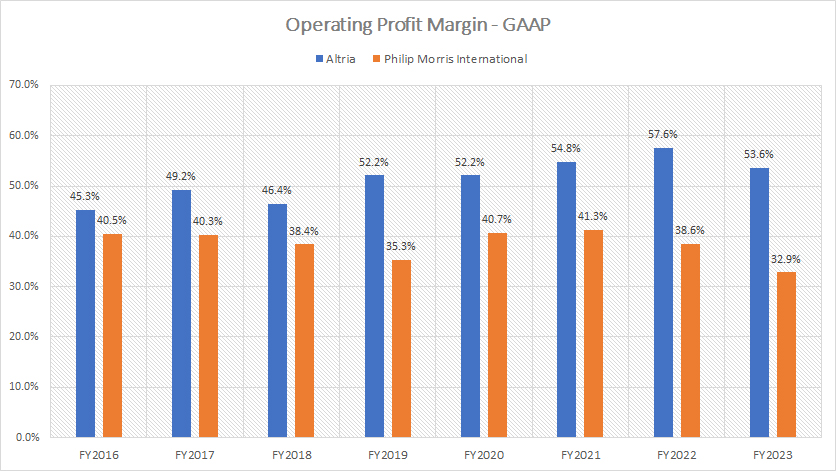
In addition, Altria is a far more efficient company compared to Philip Morris International from the perspective of operations.
Altria’s better operating efficiency compared to Philip Morris International is reflected in the higher operating margin of the company, as shown in the chart above.
Altria generated much higher operating margin than Philip Morris International, roughly 60% better in fiscal year 2023. From fiscal years 2021 to 2023, Altria maintained an average operating profit margin of 55%, while Philip Morris International averaged 38%.
Net Margin – GAAP
net-margin
(click image to enlarge)
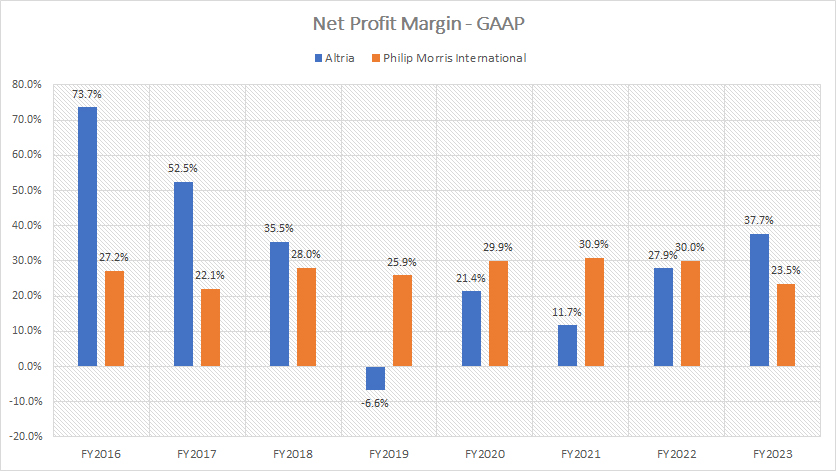
Philip Morris International fares better when it comes to net margin compared to Altria Group, as shown in the chart above. In this aspect, Philip Morris International produces far more consistent net margins.
However, Altria’s net margin significantly soared in fiscal year 2023 to nearly 38%, far outpacing the 23.5% of net profit margin of Philip Morris International.
Between fiscal years 2021 and 2023, Philip Morris International’s average net profit margin was 28%, while Altria’s net profit margin averaged 26% during the same period.
Adjusted Operating Income Margin – Non-GAAP
adjusted-operating-margin
(click image to expand)
The definition of the adjusted operating income is available here: adjusted operating income.
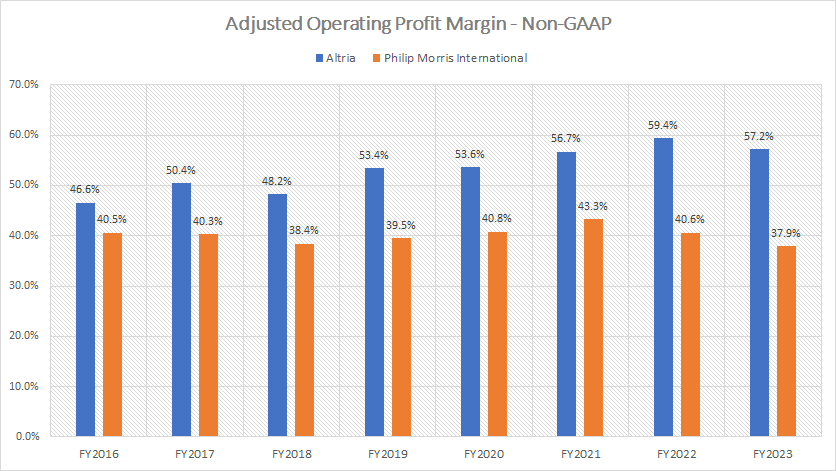
Based on the adjusted operating income margin shown in the chart above, Altria Group operates much more efficiently than Philip Morris International.
In fact, Altria’s operating efficiency is nearly twice as much as that of Philip Morris International, as reflected by the company’s higher adjusted operating income margin in the chart above. As seen, Altria produces much higher adjusted operating income margin than Philip Morris International in most fiscal years.
In fiscal year 2023, Altria generates an adjusted operating income margin of 57% compared to only 38% for Philip Morris International. Between fiscal years 2021 and 2023, Altria’s average adjusted operating income margin was 58%, while Philip Morris International’s adjusted operating income margin averaged at a much lower figure of 41% during the same period.
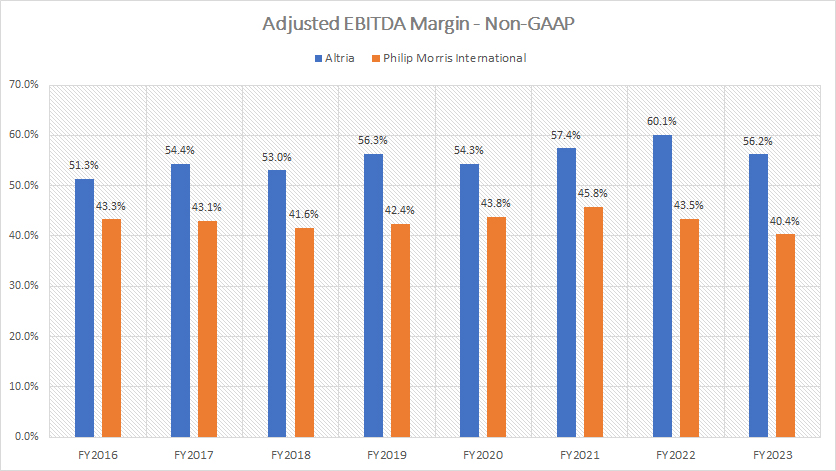
Adjusted EBITDA Margin – Non-GAAP
adjusted-ebitda-margin
(click image to expand)
The definition of the adjusted EBITDA is available here: adjusted EBITDA.
Similarly, Altria generates much better cash earnings than Philip Morris International, as reflected in the company’s higher adjusted EBITDA margin in the chart above.
Altria’s adjusted EBITDA margin is far better than Philip Morris International in most fiscal years, illustrating the higher efficiency of the company in cash flow generation compared to Philip Morris International.
On average, Altria’s average adjusted EBITDA margin was 58% over the last three years. Philip Morris International produced an average adjusted EBITDA margin of just 43% during the same period.
Conclusion
In conclusion, Altria Group generates better profitability than Philip Morris International. Its profit margins are much better than Philip Morris International.
In this aspect, Altria’s gross margin, operating margin, adjusted operating margin, and adjusted EBITDA margin have been significantly higher than Philip Morris International.
References and Credits
1. All financial figures presented in this article were obtained and referenced from the companies’ respective annual reports which are available in Altria Investor Relations and PMI Investor Relations.
2. Pixabay Images.
Disclosure
References and examples such as tables, charts, and diagrams are constantly reviewed to avoid errors, but we cannot warrant the full correctness of all content.
The content in this article is for informational purposes only and is neither a recommendation nor a piece of financial advice to purchase a stock.
If you find the information in this article helpful, please consider sharing it on social media and also provide a link back to this article from any website so that more articles like this one can be created in the future.
Thank you!

