A coal power plant. Flickr Image.
Arch Resources (NYSE:ARCH) is another mining company benefiting greatly from the recent commodity boom.
As of June 2023, Arch Resources’ stock price was traded at around $110 USD per share, one of the new highs in the last 52 weeks.
Between 2021 and 2023, ARCH’s stock price has more than doubled, going from $30 USD to as high as $160 USD.
The good news is that the commodity boom may have just begun, particularly for Arch Resources.
That said, in this article, we are taking a look at Arch Resources’ coal sales volume and the 2023 outlook provided by the company.
Let’s start out with the following topics.
Arch Resources’ Coal Sales Topics
Overview
Consolidated Results
B1. Total Coal Sales Volume By Year
B2. Total Coal Sales Volume By TTM
Results By Segment – Metallurgical Coal
C1. Metallurgical Coal Sales Volume By Year
C2. Metallurgical Coal Sales Volume By TTM
Results By Segment – Thermal Coal
C3. Thermal Coal Sales Volume By Year
C4. Thermal Coal Sales Volume By TTM
Results By Percentage
D1. Percentage Of Metallurgical And Thermal Coal Sales Volumes
Conclusion And Reference
S1. Conclusion
S2. References and Credits
S3. Disclosure
Arch Resources’ Coal Sales Overview
Arch Resources mines and sells 2 types of coals, namely:
1) Metallurgical Coal, and
2) Thermal Coal.
The company’s metallurgical coal comes primarily from the mining complexes located in West Virginia whereas its thermal coal comes primarily from Powder River Basis (PRB) located in Wyoming.
While Arch Resources produces 2 types of coal, its primary focus has been on metallurgical coal.
For thermal coal, the company is currently winding down its mining operations in several mine complexes that produce thermal coal, including the Black Thunder, Coal Creek, and West Elk.
The reason for the closure of several thermal mines is that Arch Resources is transitioning towards steel and metallurgical markets which are reportedly more profitable.
In addition, the steel and metallurgical markets command a much brighter outlook due to the world’s transition from fossil fuel to green energy.
For your information, the world needs a lot of steel to drive the green energy revolution, and metallurgical coal is required to make steel.
Arch Resources’ Coal Sales Volume By Year
Arch Resources total coal sales volume by year
(click image to enlarge)
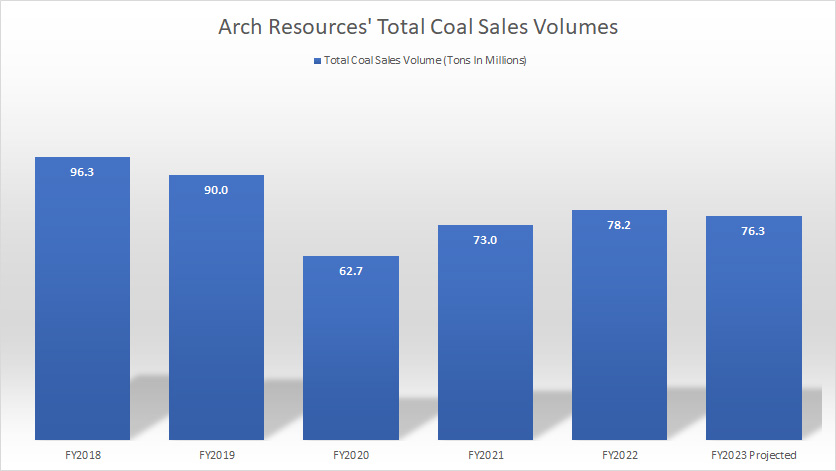
On a consolidated basis, Arch Resources sold 78.2 million tons of coal in 2022, representing a growth rate of 7% over 2021 or a massive 24% over 2020.
Going forward, Arch Resources expects to ship 76 million tons of coal in 2023, which will be down slightly from 2022.
While total coal shipment volumes have significantly improved since 2020, the figures are still far below the pre-pandemic levels.
Arch Resources’ coal sales in the future may never reach their prior highs anymore due to the world’s transition towards a greener future.
The green energy revolution will slowly wean the world off thermal coal as the major source of power generation and the transition will significantly cap Arch Resources’ thermal segment coal shipment volume.
Arch Resources’ Coal Sales Volume By TTM
Arch Resources total coal sales volume by TTM
(click image to enlarge)
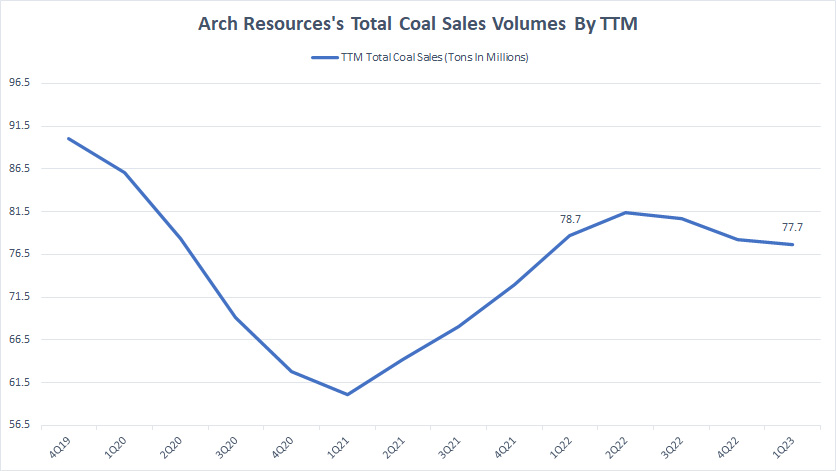
On a TTM basis, Arch Resources’ coal sales were down significantly during the COVID lockdown period which occurred between 2020 and 2021.
However, coal shipment volumes have significantly recovered since 2021 and reached 78 million tons as of 1Q 2023 on a TTM basis, which was roughly in line with the volume reported a year ago.
Again, despite the recovery in coal sales volume since 2021, the figures have never been able to reach their prior highs, due primarily to the world’s slowing demand for thermal coal as the major source of energy generation.
Arch Resources’ Metallurgical Coal Sales Volume By Year
Arch Resources’ met coal sales by year
(click image to enlarge)
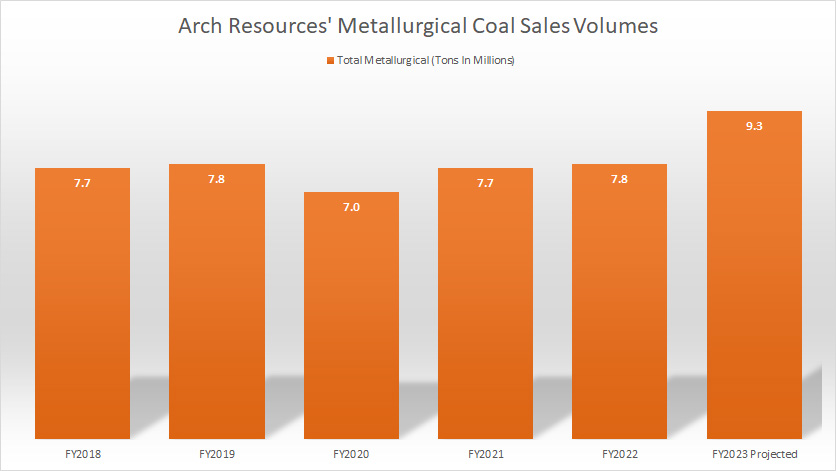
For metallurgical coal, Arch Resources shipped 7.8 million tons in 2022, up slightly from 2021 but a massive 11% over 2020.
Going into fiscal 2023, Arch Resources expects its metallurgical sales volume to significantly increase to 9.3 million tons, which represents a rise of 19% from 2022.
A trend worth pointing out here is Arch Resources’ growing metallurgical coal sales volume over the years.
As of 2022, Arch Resources has already managed to grow its metallurgical coal shipment volume to the same levels reported prior to the pre-pandemic periods.
If Arch Resouces managed to meet its 2023 target by the end of the year, the figure will significantly rise above the pre-pandemic levels.
Arch Resources’ Metallurgical Coal Sales Volume By TTM
Arch Resources’ met coal sales by TTM
(click image to enlarge)
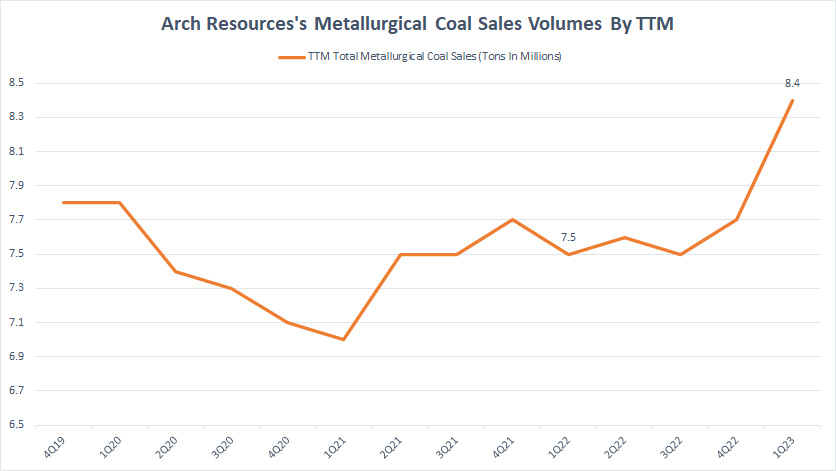
The TTM plot shown in the chart above shows that Arch Resources’ metallurgical coal sales have significantly improved over time and reached a record high of 8.4 million tons as of Q1 2023.
If the uptrend is able to persist in the next several quarters, Arch Resources may meet its targeted metallurgical coal shipment volume of 9 million tons by the end of fiscal 2023.
Arch Resources’ Thermal Coal Sales Volume By Year
Arch Resources’ thermal coal sales by year
(click image to enlarge)
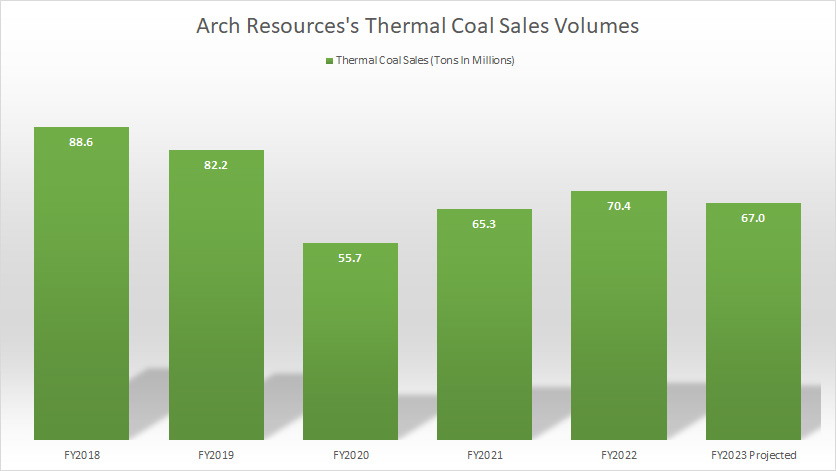
As mentioned, Arch Resources has been winding down its legacy thermal coal volumes as seen in the declining sales figures shown in the chart above.
Despite the declining sales figures, Arch Resources’ thermal coal volume is still considerably larger than its metallurgical segment, at roughly 9X the number sold in 2022.
As of 2022, Arch Resources shipped 70 million tons of thermal coal and expects the volume to come down to 67 million tons in fiscal 2023.
The recovery in thermal coal shipment volume since 2020 has not put the numbers beyond those reported prior to the pre-pandemic periods.
Instead, Arch Resources’ thermal coal sales have modestly increased and are expected to slightly come lower in fiscal 2023, indicating the world’s slowing demand for thermal coal during the green energy revolution.
Arch Resources’ Thermal Coal Sales Volume By TTM
Arch Resources’ thermal coal sales by TTM
(click image to enlarge)
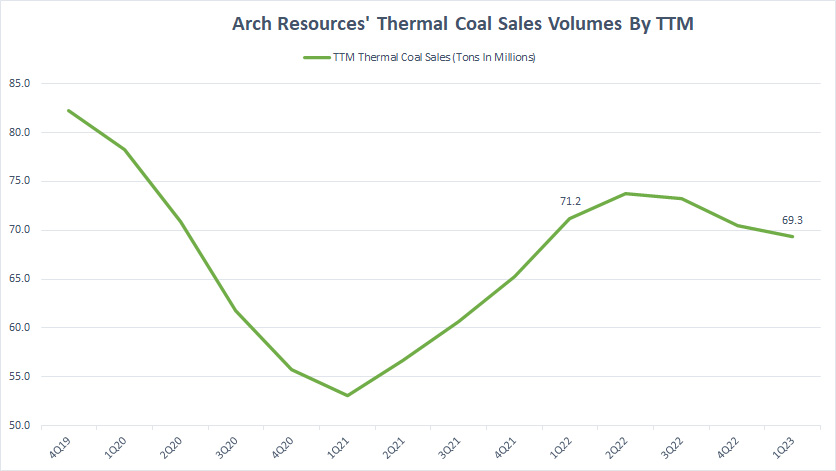
As of 1Q 2023, Arch Resources’ thermal coal volume reached only 69 million tons on a TTM basis, down slightly compared to the figure reported a year ago.
While Arch Resources’ thermal coal shipment has considerably recovered from the COVID-driven slump, it has not been able to exceed the numbers reported prior to the pandemic periods.
Percentage Of Metallurgical And Thermal Coal Sales Volumes
Arch Resources percentage of coal sales volume by segment
(click image to enlarge)
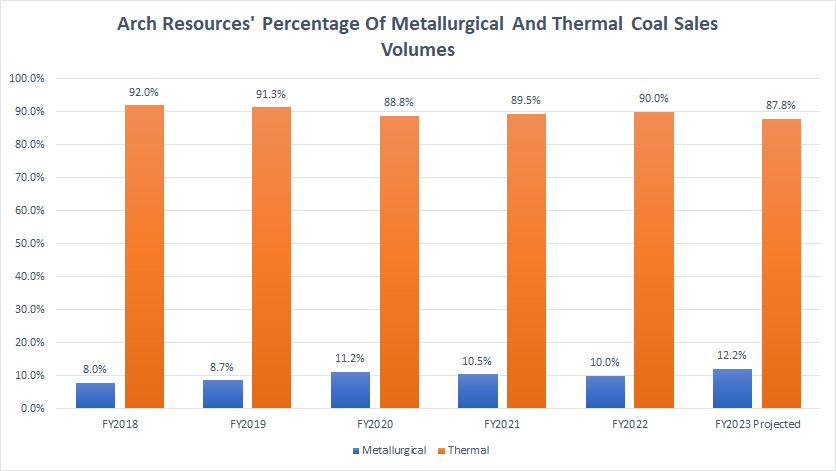
Arch Resources’ thermal coal accounts for a massive 90% of the company’s total volume in 2022 while metallurgical coal made up only 10% in the same period.
The percentage for thermal coal has only decreased slightly over the years while that of metallurgical coal has grown modestly since 2018.
Arch Resources’ ratio for thermal coal is expected to further decline to 88% in 2023 while that of metallurgical coal may increase to 12% in the same period.
In short, despite the winding down of its legacy thermal segment, Arch Resources’ thermal coal shipment volume still accounts for the lion’s share of its total coal sales volume, notably at 90% as of 2022.
Summary
Arch Resources’ coal sales volume still comes primarily from thermal coal in fiscal 2022 despite the commitment of the company to wind down its thermal segment operations.
The trend is expected to remain roughly the same in 2023, with the metallurgical segment accounting for roughly 12% while the thermal segment accounting for 88% of the company’s total coal shipment volume.
In terms of outlook, Arch Resources guide for a lower coal sales volume for fiscal 2023, with metallurgical coal accounting for most of the growth.
The company expects to ship 9 million tons of metallurgical coal in 2023, an 19% increase compared to the figure in 2022, while shipment for thermal coal is expected to be flat at 67 million tons.
References and Credits
1. All sales and financial figures presented in this article were obtained and referenced from Arch Resources’ reports, statements, SEC filings, earnings releases, etc., which are available in the following links:
2. Featured images in this article are used under Creative Common Licenses and obtained from Muddy Coal Mine Tipple and Road to the power.
Disclosure
References and examples such as tables, charts, and diagrams are constantly reviewed to avoid errors, but we cannot warrant the full correctness of all content.
The content in this article is for informational purposes only and is neither a recommendation nor a piece of financial advice to purchase a stock.
If you find the information in this article helpful, please consider sharing it on social media and also provide a link back to this article from any website so that more articles like this one can be created in the future.
Thank you!

