Ford River Rouge Complex, Dearborn, MI. Source: Flickr
Ford Motor Company is an American multinational automaker founded by Henry Ford in 1903. The company is based in Dearborn, Michigan, and is one of the largest automakers in the world. Ford is known for producing some of the most iconic cars in automotive history, such as the Model T and the Mustang.
Over the years, the company has expanded its operations to include a wide range of vehicles, including trucks, SUVs, and electric cars. Ford and Lincoln are the two prominent brand names under the company. Ford brands include Fiesta, Fusion, GT, Mustang, etc., while Lincoln brands include MKZ and Continental.
Although Ford Motor is well known for producing gas guzzlers such as the F-150 pickups, the company is now going all-electric, with electric vehicle sales reaching record milestones in fiscal 2023.
Today, Ford remains a major player in the automotive industry and is committed to creating innovative, sustainable, and safe vehicles for customers around the globe.
This article covers several statistics of Ford Motor Company, including revenue, revenue streams, profitability, and margins.
Let’s get started!
Please use the table of contents to navigate this page.
Table Of Contents
Definitions And Overview
A2. Ford Business Overview
A3. How Does Ford Generate Revenue
Consolidated Results
B1. Revenue And Profitability
B2. Profit Margins
Results By Quarter
B3. Revenue By Quarter
B4. Revenue By TTM
B5. Growth Rates Of Revenue By TTM
Revenue By Segment
C1. Automotive, Ford Credit, And Mobility Revenue
C2. Automotive, Ford Credit, And Mobility Revenue In Percentage
C3. Growth Rates Of Automotive, Ford Credit, And Mobility Revenue
Profitability And Margin By Segment
C4. Automotive, Ford Credit, And Mobility Adjusted EBIT
C5. Automotive, Ford Credit, And Mobility Adjusted EBIT Margin
Automotive Revenue By Region
D1. North And South America, Europe, And China Revenue
D2. North And South America, Europe, And China Revenue In Percentage
D3. Growth Rates Of North And South America, Europe, And China Revenue
Automotive Profitability And Margin By Region
D4. North And South America, Europe, And China Adjusted EBIT
D5. North And South America, Europe, And China Adjusted EBIT Margin
Automotive Revenue By Type
E1. New Vehicles, Used Vehicles, And Services Revenue
E2. New Vehicles, Used Vehicles, And Services Revenue In Percentage
Financial Services Revenue By Type
E3. Leasing, Financing, And Insurance Income
E4. Leasing, Financing, And Insurance Income In Percentage
Revenue By Country
F1. U.S., Canada, U.K., Germany, And Mexico Revenue
F2. U.S., Canada, U.K., Germany, And Mexico Revenue In Percentage
Revenue By New Segment
H1. Ford Blue, Ford Model e, Ford Pro, And Ford Next Revenue
H2. Ford Blue, Ford Model e, Ford Pro, And Ford Next Revenue In Percentage
Profitability And Margin By New Segment
H3. Ford Blue, Ford Model e, Ford Pro, And Ford Next Adjusted EBIT
H4. Ford Blue, Ford Model e, Ford Pro, And Ford Next Adjusted EBIT Margin
Conclusion And Reference
S1. Conclusion
S2. References and Credits
S3. Disclosure
Definitions
To help readers understand the content better, the following terms and glossaries have been provided.
Adjusted EBIT: Ford defines its adjusted EBIT as earnings before interest and taxes (EBIT) excluding interest on debt (excl. Ford Credit Debt), taxes, and pre-tax special items.
Pre-tax special items include the following:
1. Pension and OPEB remeasurement gains and losses,
2. Gains and losses on investments in equity securities,
3. Personnel expenses, supplier- and dealer-related costs, and facility-related charges,
4. Other items that are not necessarily considered to be indicative of earnings from ongoing operating activities
This non-GAAP measure is useful to management and investors because it focuses on underlying operating results and trends and improves the comparability of period-over-period results.
Ford Blue: Ford Blue is Ford’s legacy business responsible for developing and selling Ford and Lincoln internal combustion engines (“ICE”) and hybrid vehicles.
Besides developing and selling new vehicles, Ford Blue also produces and sells service parts, accessories, and digital services to retail customers. Iconic gas and hybrid vehicles developed under Ford Blue include the F-150, Bronco, and Mustang.
Ford Model e: Ford Model e is responsible for the development and sale of electric vehicles (EV).
Apart from EVs, Ford Model e also designs and creates digital vehicle technologies, including embedded software and all of Ford’s electric architecture.
Ford Model e operates in North America, Europe, and China.
Ford Pro: Ford Pro is responsible for the sale of Ford and Lincoln ICE, hybrid, and electric vehicles, service parts, accessories, and services to commercial, government, and rental customers.
Ford Pro focuses on fleet sales to customers with large orders, such as those from commercial sectors, government, and rental companies.
Ford Pro’s vehicles sold in North America include the Super Duty and the Transit range of vans. In Europe, Ford Pro’s flagship vehicles include the Ranger. Ford Pro operates primarily in North America and Europe.
Ford Next: Ford Next, formerly called the Mobility, primarily includes expenses and investments for emerging business initiatives aimed at creating value for Ford in vehicle-adjacent market segments.
Ford’s Mobility was formerly responsible for developing autonomous driving technology, according to Ford Motor.
Ford Business Overview
Ford Motor Company has three segments: automotive, financial services, and mobility. The automotive is the largest segment and produces the majority of revenue for the parent company.
Starting in 2023, Ford’s automotive sector comprises Ford Blue, Ford Model e, and Ford Pro. Mobility is renamed Ford Next, while the financial services segment remains the same as Ford Credit. Ford Credit offers various services, including retail financing, lease options, commercial financing, and insurance.
The definitions of Ford’s new segments are available here: Ford Blue, Ford Model e, and Ford Pro.
Before 2023, Ford’s automotive segment was divided into regions, which included North America, South America, Europe, China, and the International Market Group (IMG). However, starting in 2023, Ford will no longer provide results by region. These are considered legacy results.
How Does Ford Generate Revenue
Ford generates revenue from selling automobiles and related products and services. It designs, manufactures, markets, and services a broad range of cars, trucks, SUVs, electric vehicles, luxury vehicles, and commercial vehicles.
In addition to vehicle sales, Ford generates revenue from financing services, extended service plans, and other aftermarket products. It also has a significant presence in mobility, including autonomous vehicle development and ride-sharing services.
Overall, Ford Motor is a diversified company with multiple revenue streams within the automotive industry.
Revenue And Profitability
Ford-Motor-global-revenue-and-profitability
(click image to expand)
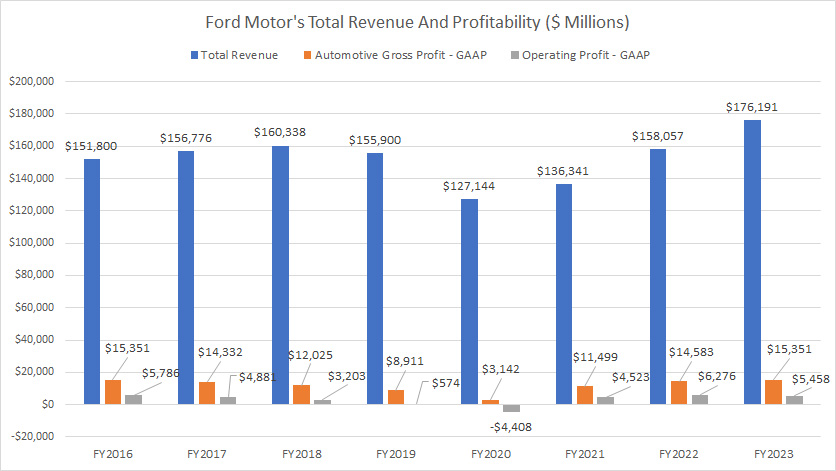
Ford earned US$176.2 billion, US$158.1 billion, and US$136.3 billion in total revenue in fiscal years 2023, 2022, and 2021, respectively. Ford’s global revenue has significantly increased by 38% since fiscal year 2020. The 2023 result surpassed pre-COVID levels, reaching an all-time high in the last eight years.
As Ford’s revenue surges, its total profit and profit per car also reaches record levels.
As of 2023, Ford’s automotive gross profit totaled a record figure of $15.3 billion, while operating profit came to $5.5 billion. Also, Ford has only experienced an operating loss once in the past eight years, making it a consistently profitable company.
Profit Margins
Ford-Motor-consolidated-margins
(click image to expand)
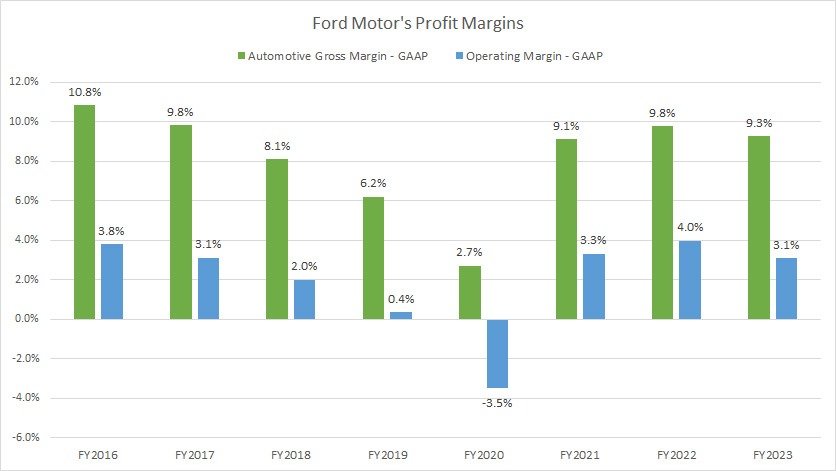
Ford has made significant improvements in its automotive gross margin in post-COVID periods. As of fiscal 2023, Ford’s gross margin for vehicle reached 9.3%. On average, Ford generated an automotive gross margin of 9.4% between 2021 and 2023, with the exception of 2.7% in 2020.
Ford generates a much lower operating margin, totaling only 3.1% in fiscal 2023. On average, Ford’s operating margin totaled 3.5% between 2021 and 2023, with the exception of -3.5% in 2020.
In short, Ford Motor is profitable and makes money in most fiscal years except in 2020.
Revenue By Quarter
Ford-Motor-revenue-by-quarter
(click image to expand)
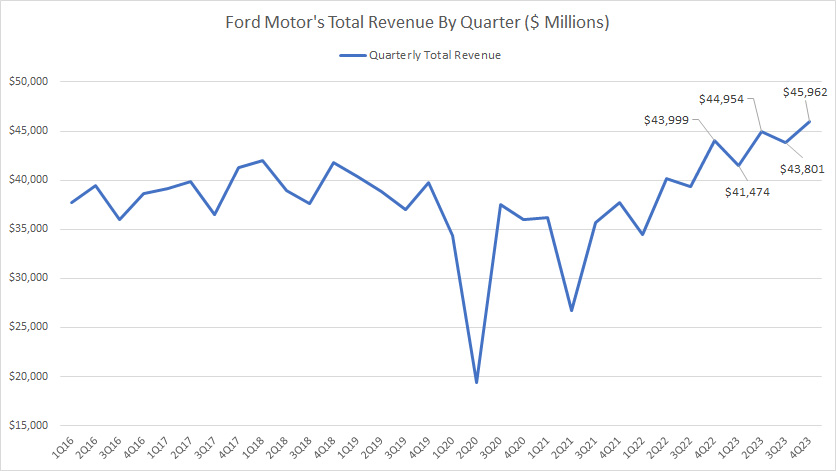
Ford earned US$46.0 billion, US$43.8 billion, and US$45.0 billion in quarterly revenue in 4Q, 3Q, and 2Q 2023, respectively. The 4Q 2023 result represents a rise of 4.5% from a year ago.
Revenue By TTM
Ford-Motor-revenue-by-ttm
(click image to expand)
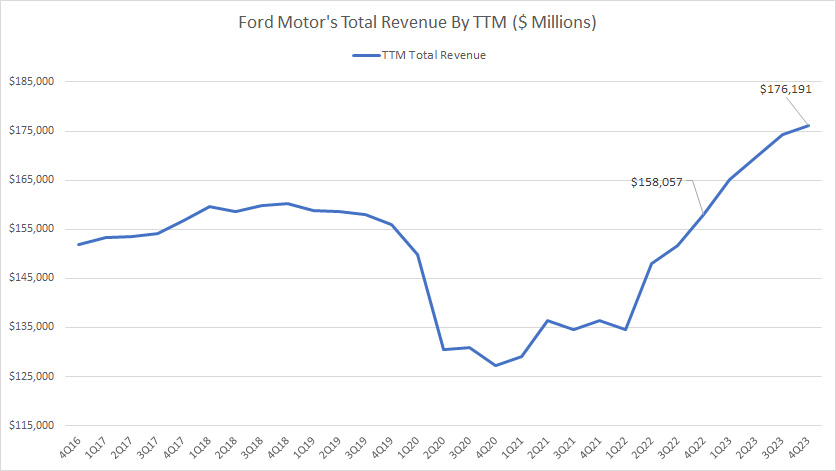
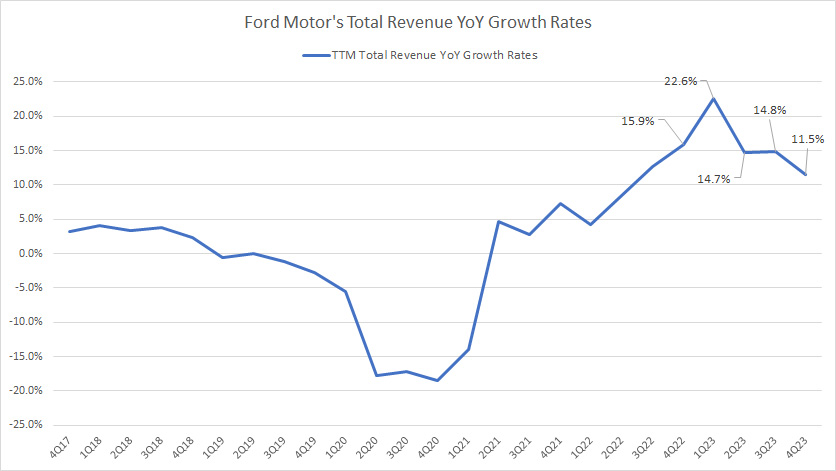
The TTM plot above depicts the significant rise in Ford’s revenue in post-COVID periods. As of 4Q 2023, Ford’s TTM revenue reached an all-time high of $176.2 billion, up 11.5% from the same quarter a year ago.
Growth Rates Of Revenue By TTM
Ford-Motor-growth-rates-of-revenue-by-ttm
(click image to expand)
Ford has shown significant improvement in revenue growth in post-COVID periods. On average, Ford’s revenue YoY growth came to 16% for the past four quarters. As of 4Q 2023, Ford’s revenue growth totaled 11.5% year-over-year.
Before COVID-19, Ford hardly had any revenue growth. On average, Ford’s revenue growth totaled less than 5% before the COVID period.
Automotive, Ford Credit, And Mobility Revenue
Ford-Motor-Automotive-Ford-Credit-and-Mobility-revenue
(click image to expand)
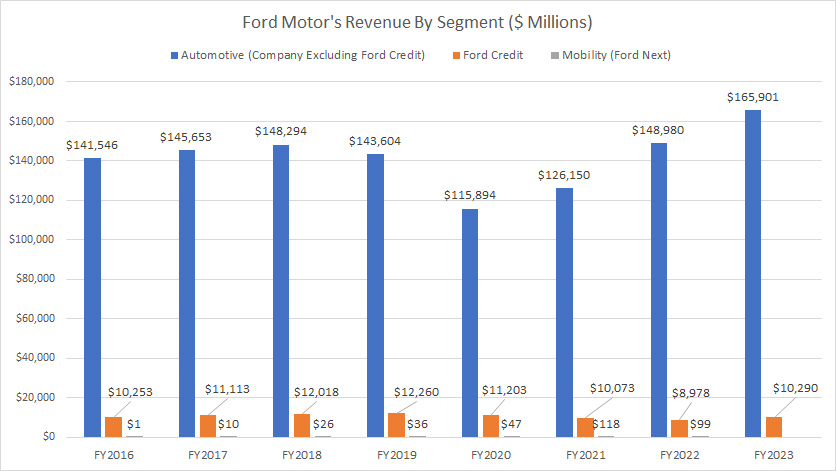
Ford’s businesses consist of automotive, Ford Credit, and Mobility. Starting in 2023, the automotive has been reorganized into a single entity called Company Excluding Ford Credit which encompasses Mobility. In the same year, Mobility was renamed Ford Next.
Ford’s automotive or Company, Excluding Ford Credit, earned US$165.9 billion, US$149.0 billion, and US$126.1 billion in revenue in fiscal years 2023, 2022, and 2021, respectively.
On the other hand, Ford Credit, a wholly-owned subsidiary that provides vehicle financing and leasing services, generates roughly $10 billion in revenue annually. In fiscal 2023, Ford Credit contributed $10.3 billion in sales to the company.
Ford’s Mobility does not generate much revenue. In fiscal 2022, Ford’s Mobility generated only $100 million in sales.
Automotive, Ford Credit, And Mobility Revenue In Percentage
Ford-Motor-Automotive-Ford-Credit-and-Mobility-revenue-in-percentage
(click image to expand)
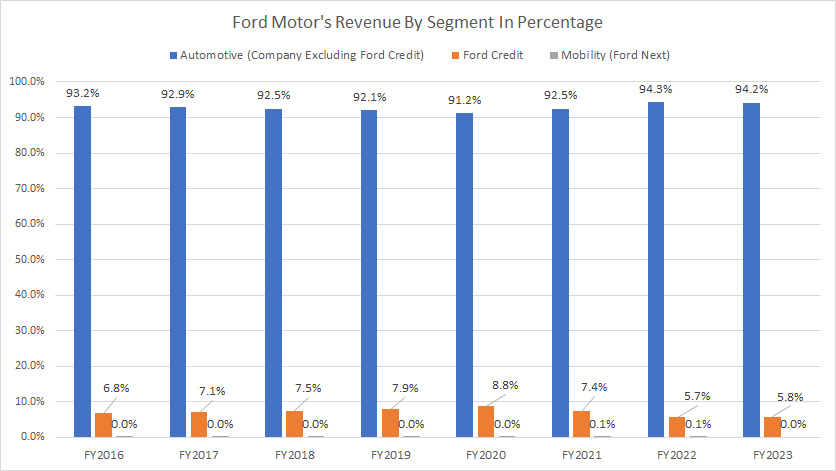
Ford Motor’s automotive contributes more than 90% of revenue to the company, making this segment the largest revenue source to the parent company. On the other hand, Ford Credit contributes less than 10% of sales to Ford Motor.
In fiscal 2023, the revenue contribution from Ford’s automotive was 94.2%, while Ford Credit made up 5.8%. For the last eight years, the revenue contribution from Ford’s automotive has slightly increased, while that of Ford Credit has decreased somewhat.
Growth Rates Of Automotive, Ford Credit, And Mobility Revenue
Ford-Motor-growth-rates-of-Automotive-Ford-Credit-and-Mobility-revenue
(click image to expand)
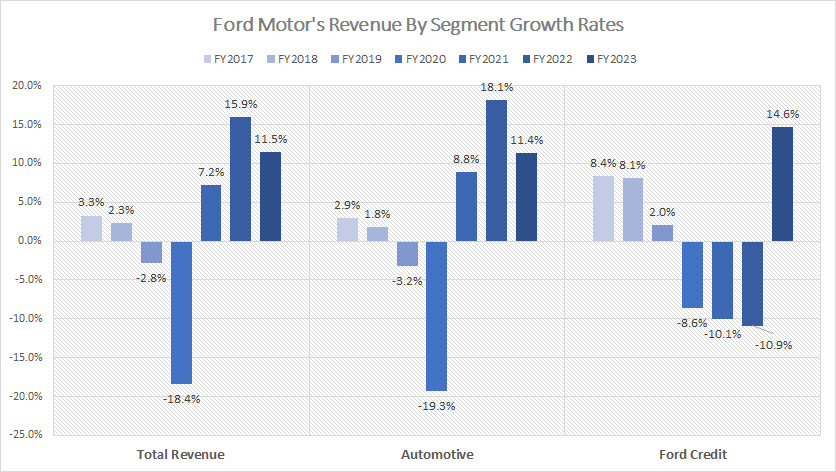
Ford’s automotive revenue grew 11.4% in fiscal 2023 over 2022, and the growth rate averaged 12.8% between 2021 and 2023. On the other hand, Ford Credit’s revenue grew 14.6% in fiscal 2023 over 2022, and the average growth rate was -2.1% for the last three years.
A noticeable trend is that Ford Credit’s revenue has declined in post-pandemic periods except in 2023. As seen, Ford Credit has posted a double-digit revenue decline consecutively since fiscal year 2020.
Automotive, Ford Credit, And Mobility Adjusted EBIT
Ford-Motor-Automotive-Ford-Credit-and-Mobility-adjusted-EBIT
(click image to expand)
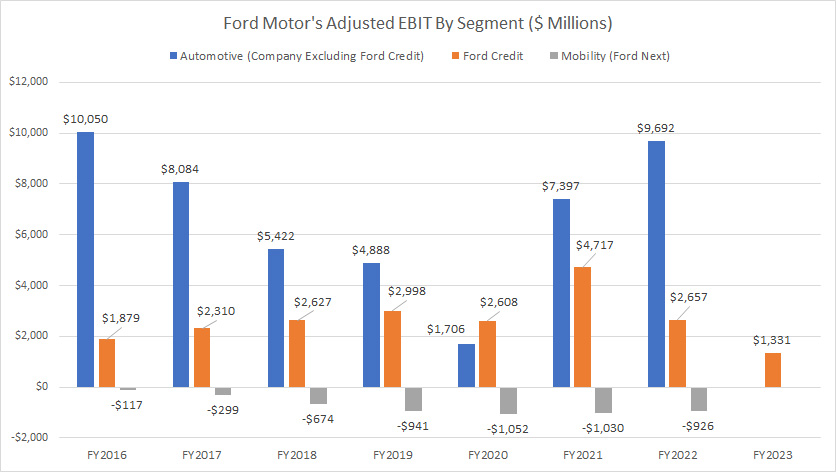
The definition of Ford’s adjusted EBIT is available here: adjusted EBIT. Ford has stopped publishing the consolidated adjusted EBIT of the automotive segment starting in 2023. Instead, Ford has broken down the adjusted EBIT according to new segments: Ford Blue, Ford Model e, Ford Pro, And Ford Next Adjusted EBIT.
That said, Ford’s automotive contributes the bulk of the profit to the company, at nearly $10 billion in adjusted EBIT in fiscal 2022. The adjusted EBIT of Ford’s automotive has significantly risen since 2020 after the COVID pandemic.
Ford Credit’s adjusted EBT, instead of EBIT, topped $1.3 billion, $2.7 billion, and $4.7 billion in fiscal years 2023, 2022, and 2021, respectively, making this segment the second-largest profit contributor to Ford Motor. A noticeable trend is that Ford Credit’s profitability has significantly decreased over the last three years.
Ford’s Mobility does not generate any profit for Ford Motor. Instead, it has incurred significant losses. In fiscal 2022, Mobility’s EBIT-adjusted loss topped $926 million.
Automotive, Ford Credit, And Mobility Adjusted EBIT Margin
Ford-Motor-Automotive-Ford-Credit-and-Mobility-adjusted-EBIT-margin
(click image to expand)
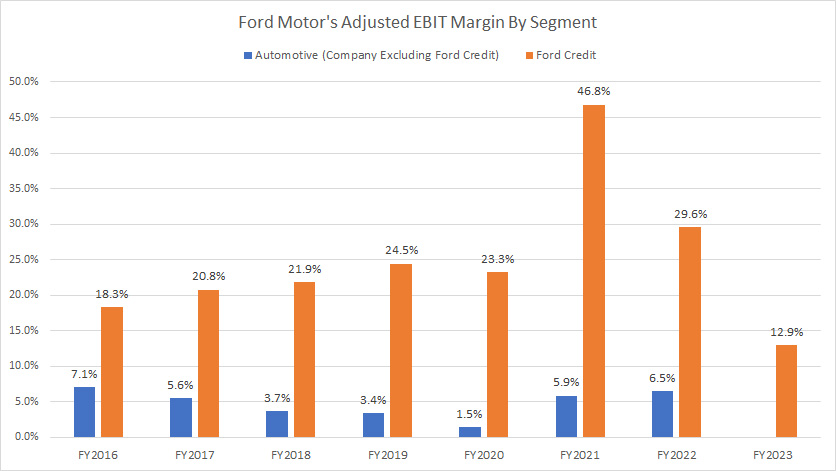
The definition of Ford’s adjusted EBIT is available here: adjusted EBIT. Ford has stopped publishing the consolidated adjusted EBIT of the automotive segment starting in 2023. Instead, Ford has broken down the adjusted EBIT according to new segments: Ford Blue, Ford Model e, Ford Pro, And Ford Next Adjusted EBIT.
Although Ford’s automotive contributes the bulk of the profit to the parent company, it is not the most profitable segment. Instead, Ford Credit, which provides lending and credit services to customers, is the company’s most profitable segment.
As seen in the chart above, Ford’s automotive’s average adjusted EBIT margin was just 4.6% between 2020 and 2022, while Ford Credit’s margin landed at 33% on average during the same period.
North And South America, Europe, And China Revenue
Ford-Motor-automotive-revenue-by-region
(click image to expand)
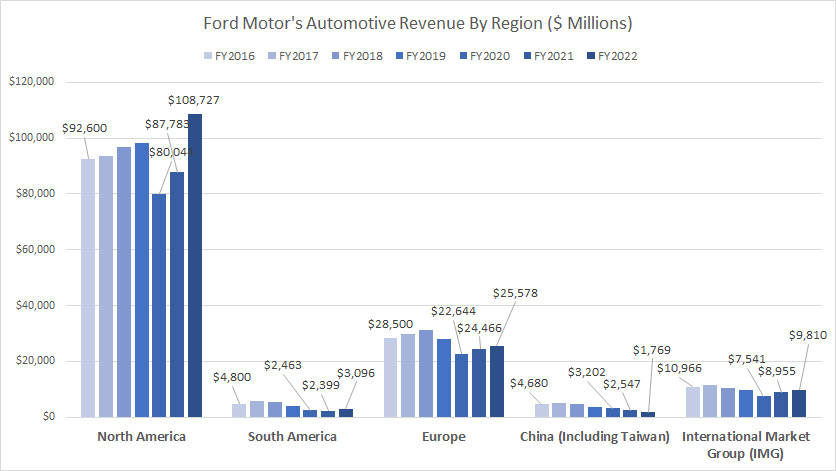
Ford has stopped publishing the automotive revenue based on region starting in fiscal 2023. Instead, Ford has replaced the revenue by region with revenue by new segments: Ford Blue, Ford Model e, Ford Pro, And Ford Next Revenue.
Before 2023, Ford Motor further broke down its automotive revenue based on region. The regions or countries were North America, South America, Europe, and China, which includes Taiwan.
The International Market Group or IMG refers to the rest of the regions in which Ford Motor has a market share such as the Asia Pacific, Middle East, and Africa.
That said, North America was Ford’s largest market, with revenue reaching over $100 billion in 2022 compared to $88 billion in 2021. A noticeable trend is that the revenue in North America has significantly increased since 2020.
Europe was Ford’s second-largest market after North America, with annual sales coming at US$26 billion in 2022 compared to US$24 billion in 2021. Ford’s sales in Europe have slightly increased since 2020 but not as much as in North America.
Ford Motor made only US$3 billion in automotive revenue in South America in 2023. The automotive revenue in South America was much lower in 2022, at only US$2.4 billion.
Ford Motor has performed poorly in China, with the automotive revenue decreasing severely over the years. As seen, Ford’s automotive revenue in China has significantly reduced since 2016 and reached just US$1.8 billion as of 2022, the lowest level ever reported in this region.
Ford’s IMG earns quite a steady and substantial revenue, reaching nearly US$10 billion in fiscal 2022.
North And South America, Europe, And China Revenue In Percentage
Ford-Motor-automotive-revenue-by-region-in-percentage
(click image to expand)
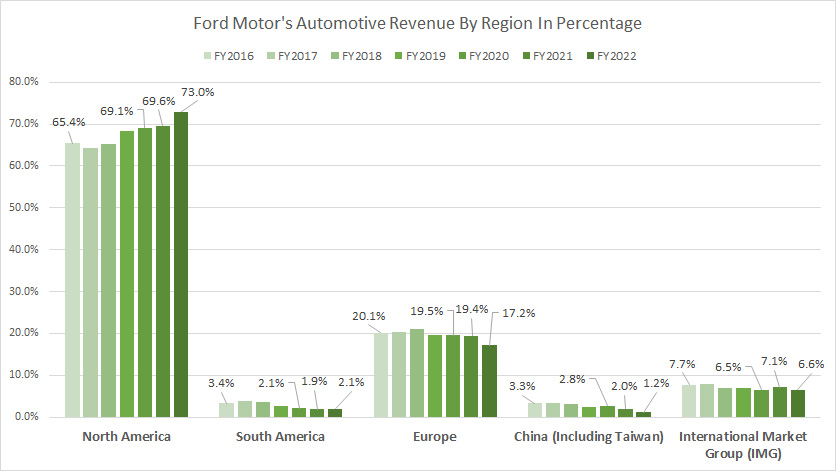
Ford has stopped publishing the automotive revenue by region starting in fiscal 2023. Instead, Ford has replaced the revenue by region with revenue by new segments: Ford Blue, Ford Model e, Ford Pro, And Ford Next Revenue.
Ford’s automotive revenue in North America forms the largest portion, at 73% of the total automotive revenue in fiscal 2022. The revenue contribution from North America has considerably risen since 2016, illustrating the importance of the North American market to the company.
Ford’s Europe contributed about 17% of sales to the automotive sector in 2022, making this region the second biggest market after North America. South America contributed about 2% of Ford Motor’s automotive revenue in fiscal 2022, while sales in China accounted for only 1.2% in the same period.
A noticeable trend is that the revenue contribution from most regions has declined except for North America, whose ratio has significantly increased from 65% in 2016 to 73% as of 2022.
Growth Rates Of North And South America, Europe, And China Revenue
Ford-Motor-growth-rates-of-automotive-revenue-by-region
(click image to expand)
Ford has stopped publishing the automotive revenue by region starting in fiscal 2023. Instead, Ford has replaced the revenue by region with revenue by new segments: Ford Blue, Ford Model e, Ford Pro, And Ford Next Revenue.
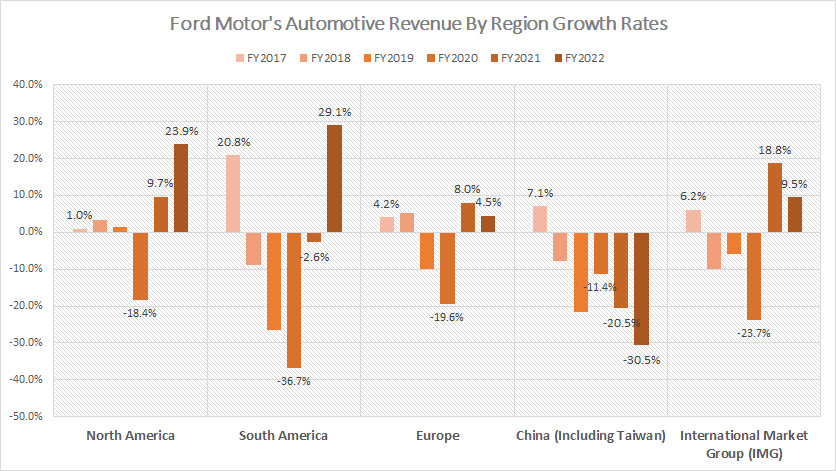
Ford’s revenue has declined in most regions except North America. For example, Ford Motor’s automotive revenue in North America grew 5.1% on average between 2020 and 2022.
On the other hand, Ford’s revenue growth in South America totaled -3.4% on average, while Europe’s figure was -2.3% between 2020 and 2022. Moreover, Ford has performed poorly in China, with revenue growth coming at -20.8% on average between 2020 and 2022.
A noticeable trend is that Ford’s revenue growth has significantly recovered in the post-COVID era in most regions, except for China, which decreased by over 30% in 2022.
North And South America, Europe, And China Adjusted EBIT
Ford-Motor-automotive-adjusted-EBIT-by-region
(click image to expand)
The definition of Ford’s adjusted EBIT is available here: adjusted EBIT. Ford has stopped publishing the adjusted EBIT based on regions starting in 2023. Instead, Ford has broken down the adjusted EBIT according to new segments: Ford Blue, Ford Model e, Ford Pro, And Ford Next Adjusted EBIT.
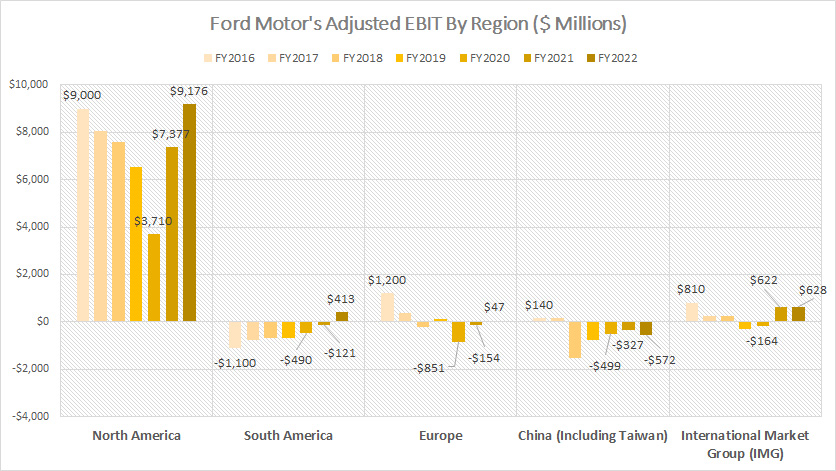
That said, North America is Ford’s major source of profit, with an adjusted EBIT coming at US$9.2 billion in fiscal 2022, up significantly from US$7.4 billion in 2021. Ford’s profitability in North America has risen dramatically since 2020, indicating the remarkable recovery in this region in post-COVID time.
In contrast, Ford incurs losses in other regions, particularly in China. For example, Ford’s adjusted EBIT in China averaged -$466 million between 2020 and 2022, while the figure in Europe landed at -$319 million on average during the same period. Ford made a profit of $413 million in South America in 2022 but reported losses in the region for most other fiscal years.
Despite operating in China for over a decade, Ford Motor still finds it challenging to penetrate the Chinese market. In contrast, North America has been the most profitable region for the company, consistently generating profits over the years.
North And South America, Europe, And China Adjusted EBIT Margin
Ford-Motor-automotive-adjusted-EBIT-margin-by-region
(click image to expand)
The definition of Ford’s adjusted EBIT is available here: adjusted EBIT. Ford has stopped publishing the adjusted EBIT based on regions starting in 2023. Instead, Ford has broken down the adjusted EBIT according to new segments: Ford Blue, Ford Model e, Ford Pro, And Ford Next Adjusted EBIT.
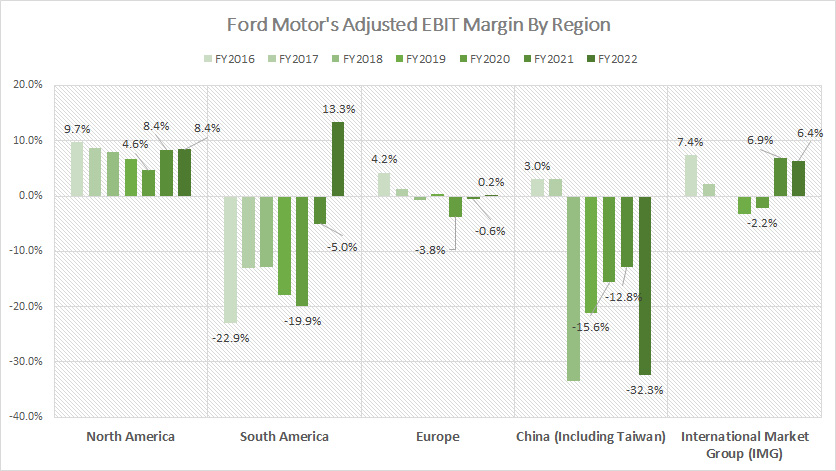
Ford Motor consistently generates high profit margins in North America, highlighting the region’s significance to the company. Although the adjusted EBIT in North America dived in 2020 to just 4%, it averaged 7.2% between fiscal 2020 and 2022, implying that the profitability in this region has significantly recovered post-pandemic.
Ford produced an adjusted EBIT margin of 13.3% in South America in fiscal 2022, the first profit it made in this region since 2016.
On the other hand, Ford’s adjusted EBIT margin averaged -1.4% in Europe since 2020, while the figure came to -20.3% in China, the worst among all countries and regions. Therefore, Ford has barely made a profit in Europe and China.
In short, Ford Motor makes the most profit in North America. More importantly, the profit generated in North America has been consistent and stable.
New Vehicles, Used Vehicles, And Services Revenue
Ford-Motor-new-and-used-vehicles-sales-and-services-revenue
(click image to expand)
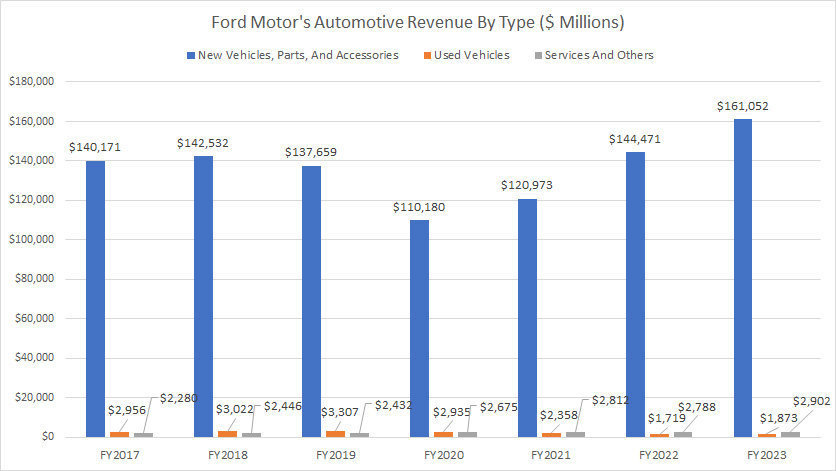
Ford’s revenue from sales of new vehicles, used vehicles, and services is derived primarily from the automotive segment. That said, among all categories, Ford’s sales of new vehicles, parts, and accessories generate the majority of revenue for the company, totaling over $161.1 billion in fiscal 2023, up considerably from $144.5 billion in 2022. Ford’s revenue from sales of new vehicles, parts, and accessories is by far the largest revenue source and much higher than any other type of income.
On the other hand, Ford’s used vehicle sales contribute only a small amount of revenue, totaling only $1.9 billion in fiscal 2023. The revenue from used vehicle sales has significantly decreased since 2017, down by over 36% over the last eight years.
Ford’s services and other revenue contribute a far higher income than used vehicle sales, totaling over $2.9 billion and $2.8 billion in fiscal 2023 and 2022, respectively.
New Vehicles, Used Vehicles, And Services Revenue In Percentage
Ford-Motor-new-and-used-vehicles-sales-and-services-revenue-in-percentage
(click image to expand)
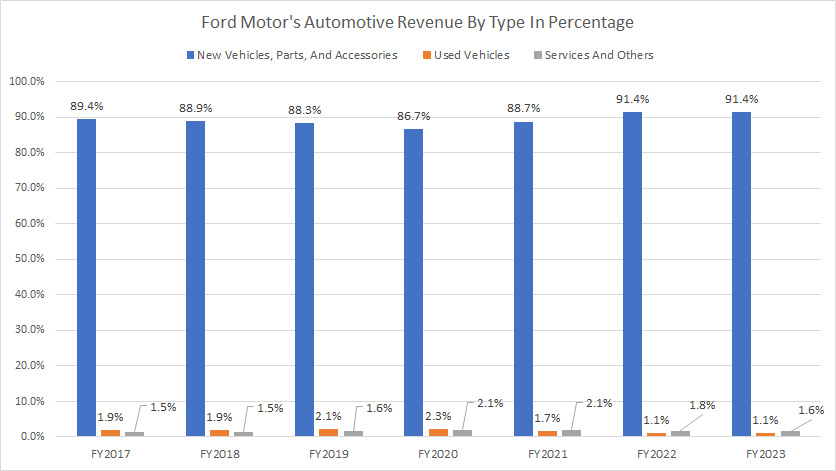
Ford’s sales of new vehicles, parts, and accessories accounted for over 90% of the company’s total revenue, making this type of income the largest among all other income types.
On the other hand, the revenue contribution from used vehicles was only 1.1% of the total, while services and others formed 1.6% of the total as of fiscal 2023.
A noticeable trend is that the revenue contribution from used vehicle sales has declined since 2017, while that of new vehicles has increased from 89.4% in 2017 to 91.4% as of 2023.
Leasing, Financing, And Insurance Income
Ford-Motor-leasing-financing-and-insurance-income
(click image to expand)
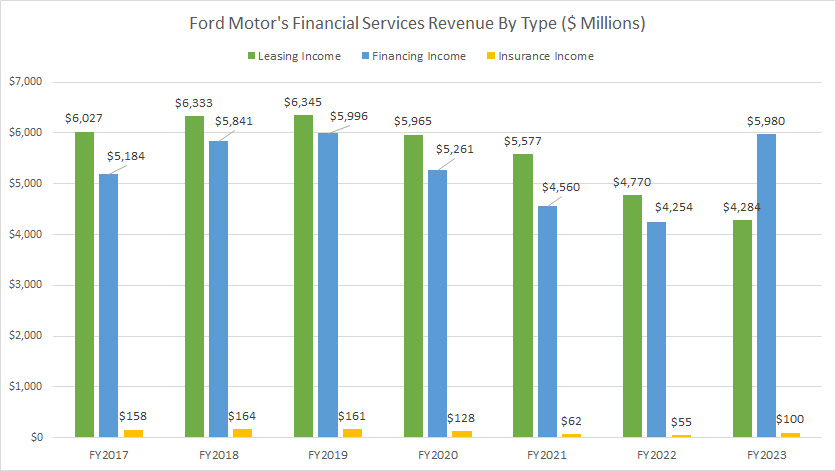
The leasing, financing, and insurance income is derived primarily from Ford Credit, a wholly-owned subsidiary of Ford Motor that provides vehicle-related lending and loan services. Only a minor portion of leasing income comes from Ford’s automotive segment, while the majority of it is from Ford Credit.
It’s worth noting that Ford Motor earned $4.3 billion in leasing income during the fiscal year 2023, a slight dip from the $4.8 billion earned in 2022. Ford’s leasing income has decreased significantly over the years, going from $6 billion in 2017 to $4.3 billion in 2023, indicating a decline of 28% over six years.
On the other hand, Ford’s financing income increased to nearly $6 billion in 2023, a 40% increase over 2022. This has now become the largest source of revenue for Ford Credit.
In fiscal year 2023, Ford Motor’s insurance income contributed only $100 million in revenue, the lowest among all revenue streams under Ford Credit.
A noticeable trend is the significant increase in Ford’s financing income in 2023, while leasing income has decreased.
Leasing, Financing, And Insurance Income In Percentage
Ford-Motor-leasing-financing-and-insurance-income-in-percentage
(click image to expand)
The leasing, financing, and insurance income is derived primarily from Ford Credit, a wholly-owned subsidiary of Ford Motor that provides vehicle-related lending and loan services. Only a minor portion of leasing income comes from Ford’s automotive segment, while the majority of it is from Ford Credit.
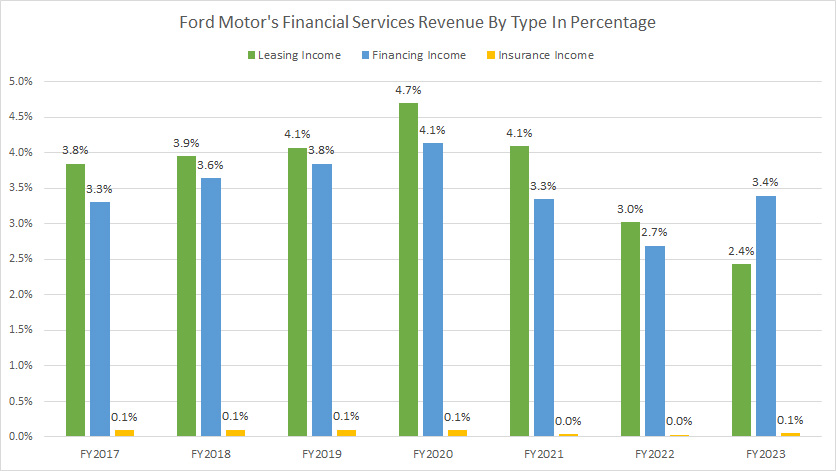
Ford Motor’s lease and finance operations accounted for just 2.4% and 3.4% of its total revenue in 2023, respectively. Meanwhile, the company’s insurance business contributed a negligible 0.1% to its overall revenue during the same year.
U.S., Canada, U.K., Germany, And Mexico Revenue
Ford-Motor-U.S.-Canada-U.K.-Germany-and-Mexico-revenue
(click image to expand)
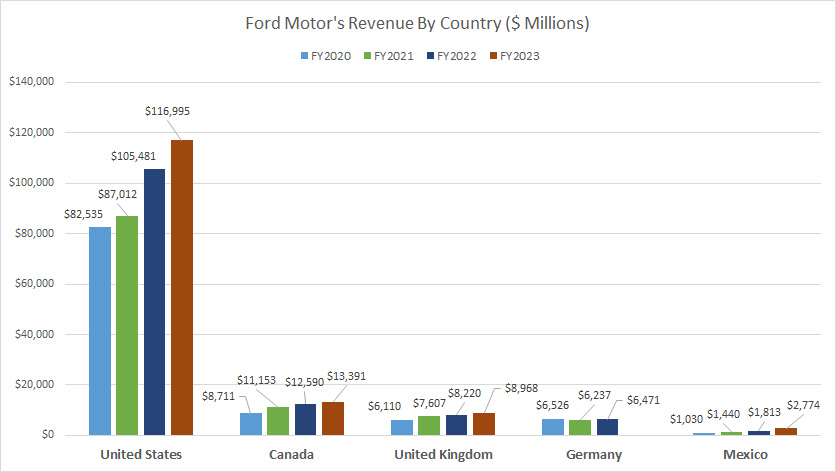
Ford Motor’s revenue is categorized not only by segments but also by country, as illustrated in the plot above. The chart displays the countries where Ford generates the most revenue in descending order from left to right. The countries discussed are the United States, Canada, the United Kingdom, Germany, and Mexico.
Keep in mind that the revenue presented for each country covers not only the automotive segment but also all other segments, including financial services.
All told, Ford Motor gets the majority of its revenue from the United States, totaling nearly $117 billion as of fiscal 2023. This figure has significantly risen over the past four years.
Canada produces the second-highest revenue for Ford Motor, totaling $13.4 billion in fiscal 2023. The revenue figure from Canada also has significantly increased since fiscal 2020.
Ranked slightly behind Canada was the United Kingdom, at $9 billion in revenue in fiscal 2023. Germany came in 4th place at $6.5 billion in sales in fiscal 2022. Ford didn’t provide the 2023 revenue figure for Germany.
Ford earned $2.8 billion in revenue in Mexico in fiscal 2023, the lowest among all countries.
China is nowhere to be seen in the plot above as the country probably does not cut out to be in the top five income-producing countries for Ford Motor.
A significant trend over the past four years is a remarkable rise in revenue figures across various countries, with the U.S. leading the way with a revenue jump of over 40% since 2020.
U.S., Canada, U.K., Germany, And Mexico Revenue In Percentage
Ford-Motor-U.S.-Canada-U.K.-Germany-and-Mexico-revenue-in-percentage
(click image to expand)
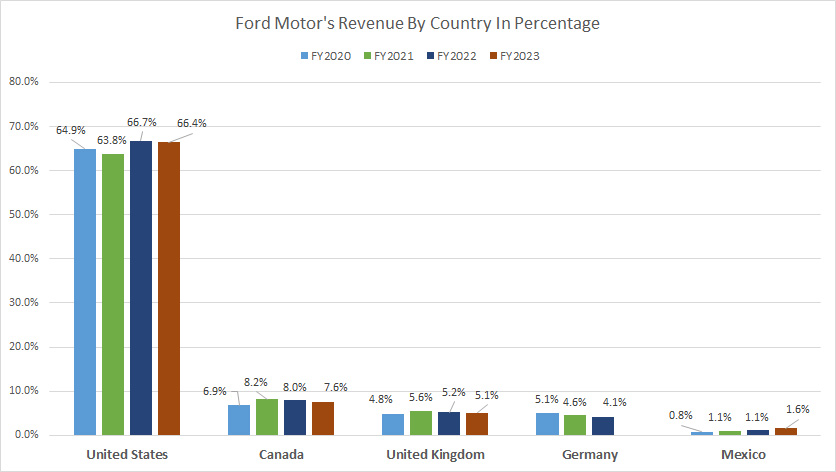
Ford’s revenue from the U.S. accounted for 66.4% of the total as of fiscal 2023, the highest among all countries in comparison.
The ratio from Canada was 7.6% in 2023, while the U.K. contributed 5.1% in the same period. Germany made up 4.1% of the total in 2022. Ford didn’t provide the 2023 revenue figure for Germany.
Mexico accounted for 1.6% of the company’s total as of fiscal 2023.
A trend to note is the increasing revenue contributions from the U.S., Canada, and the U.K. since 2020. In contrast, the ratio for Germany has declined.
Ford Blue, Ford Model e, Ford Pro, And Ford Next Revenue
Ford-Motor-revenue-by-new-segment
(click image to expand)
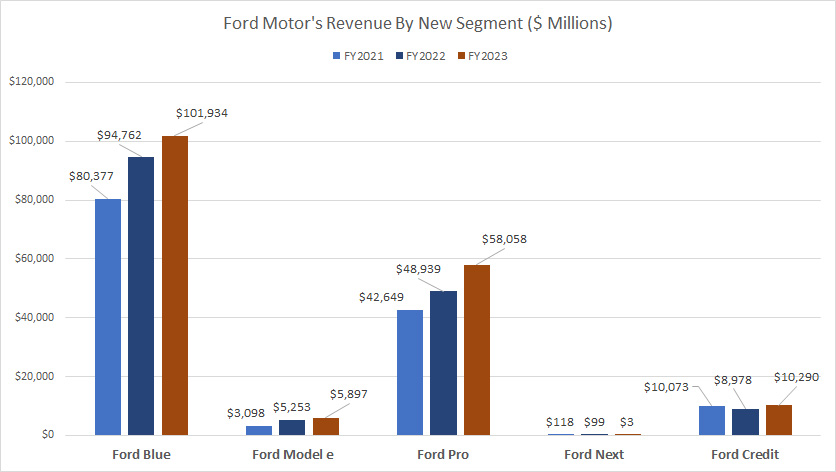
Ford Blue, Ford Model e, Ford Pro, and Ford Next are new reportable segments under a reorganization practice that occurred in fiscal 2023. The definitions of Ford’s new segments are available here: Ford Blue, Ford Model e, Ford Pro, And Ford Next.
Ford Blue is the main source of revenue for its parent company, generating $102 billion in fiscal year 2023. This represents a 7% increase from the previous year. Since 2021, Ford Blue’s revenue has grown significantly, rising from $80.4 billion to $102 billion in 2023.
Ford Pro is a division of Ford Motor that caters to commercial buyers and fleet sales. It contributes significantly to the company’s revenue, ranking second in revenue earned. In 2023, Ford Pro generated $58.1 billion, an 18% increase from the previous year. Notably, Ford Pro’s revenue has significantly increased from $42.6 billion in 2021 to $58.1 billion in 2023, similar to Ford Blue.
In fiscal year 2023, Ford Model E earned $5.9 billion in revenue through the sales of electric vehicles and related components. This represents significant growth for the segment, nearly doubling the revenue earned in 2021.
Ford Next did not generate any revenue in 2023, while Ford Credit’s revenue came to $10.3 billion in the same period, a record figure in the past three years.
Ford Blue, Ford Model e, Ford Pro, And Ford Next Revenue In Percentage
Ford-Motor-revenue-by-new-segment-in-percentage
(click image to expand)
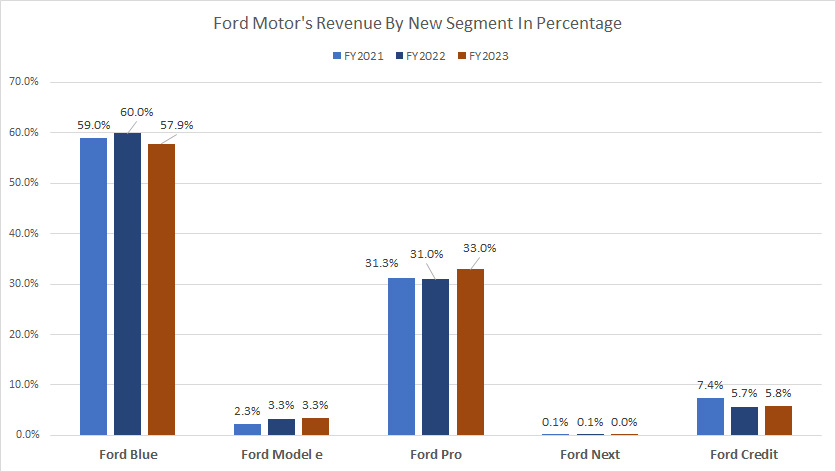
Ford Blue, Ford Model e, Ford Pro, and Ford Next are new reportable segments under a reorganization practice that occurred in fiscal 2023. The definitions of Ford’s new segments are available here: Ford Blue, Ford Model e, Ford Pro, And Ford Next.
Ford Blue’s revenue contribution accounted for 58% of the company’s total revenue in 2023, while Ford Pro’s ratio came to 33% in the same period. Ford Model e contributed only 3% of the company’s total revenue in 2023. Ford Next contributes nothing in most fiscal years.
Ford Credit’s revenue contribution landed at 5.8% of the company’s total in fiscal year 2023, the third-largest after Ford Pro.
Ford Blue, Ford Model e, Ford Pro, And Ford Next Adjusted EBIT
Ford-Motor-adjusted-EBIT-by-new-segment
(click image to expand)
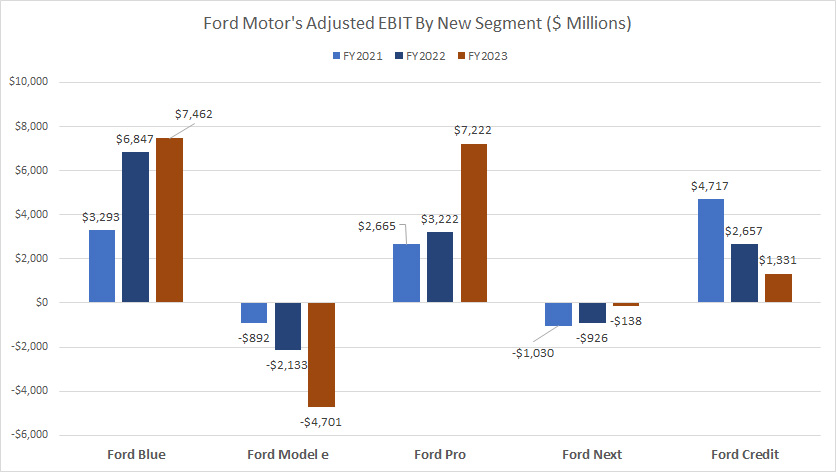
The definition of Ford’s adjusted EBIT is available here: adjusted EBIT. Ford Blue, Ford Model e, Ford Pro, and Ford Next are new reportable segments under a reorganization practice that occurred in fiscal 2023. The definitions of Ford’s new segments are available here: Ford Blue, Ford Model e, Ford Pro, And Ford Next.
Ford Blue produces the majority of profit for the company, at $7.5 billion in adjusted EBIT in fiscal year 2023. Ford Blue’s 2023 result was up 10% over 2022 and 127% over 2021.
Ford Pro produces a profit comparable to Ford Blue’s, totaling over $7.2 billion in adjusted EBIT as of fiscal 2023. Ford Pro’s 2023 result was double that of 2022 and nearly triple that of 2021.
Ford Model e is not a profitable segment. Ford Model e incurred an adjusted loss of $4.7 billion in 2023, which was more than double the loss in 2022.
Ford Next is also not a profitable segment. In fiscal 2023, Ford Next incurred an adjusted loss of -$138 million, a significantly lower loss than the 2022 result.
Ford Credit produced an adjusted EBT of $1.3 billion in 2023, only half of what it made a year ago and 72% lower than the 2021 result. Ford Credit’s profit has significantly decreased since 2021.
In summary, Ford Blue and Ford Pro are the most profitable divisions of Ford Motor Company.
Ford Blue, Ford Model e, Ford Pro, And Ford Next Adjusted EBIT Margin
Ford-Motor-adjusted-EBIT-margin-by-new-segment
(click image to expand)
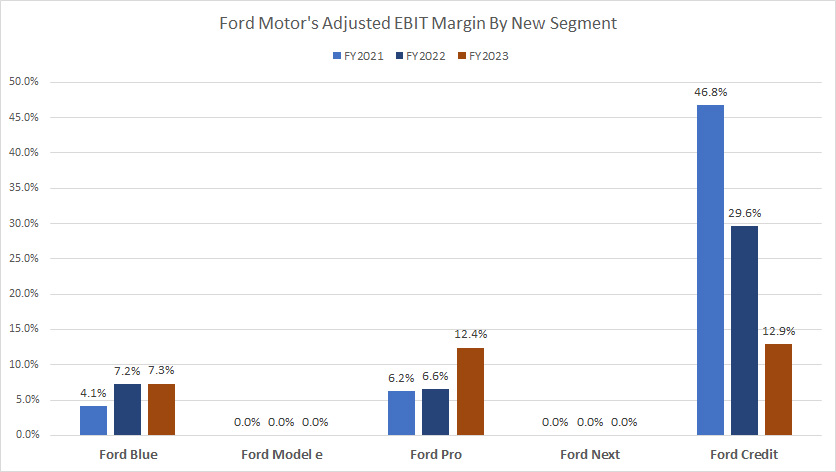
The definition of Ford’s adjusted EBIT is available here: adjusted EBIT. Ford Blue, Ford Model e, Ford Pro, and Ford Next are new reportable segments under a reorganization practice that occurred in fiscal 2023. The definitions of Ford’s new segments are available here: Ford Blue, Ford Model e, Ford Pro, And Ford Next.
Although Ford Credit does not produce the biggest profit for the company, it generates the highest margin. In fact, Ford Credit’s margin is much better than the rest of Ford’s subsidiaries.
In 2023, Ford Credit’s adjusted EBT margin was 12.9%, slightly higher than Ford Pro’s margin of 12.4% and considerably higher than Ford Blue’s margin of 7.3%.
Between 2021 and 2023, Ford Credit’s adjusted EBT margin averaged 29.8% compared to Ford Pro’s average margin of 8.4%. Ford Blue’s adjusted EBIT margin averaged 6.2% for the past three years.
The profit margin of Ford Model e and Ford Next is not applicable as they do not generate any profit.
Conclusion
Ford Motor has recently undergone a reorganization and is now divided into four segments: Ford Blue, Ford Model E, Ford Pro, and Ford Next. However, not all of these segments are profitable, and some are experiencing significant losses.
While Ford has been operating in regions such as South America, Europe, and China for quite some time, the North American region remains the most important for the company. In fact, Ford generates the majority of its revenue and profits from North America.
Unfortunately, Ford has not been able to make significant profits in these other regions, even after more than a decade of operating there, especially in China.
Credits and References
1. All financial figures presented in this article were obtained and referenced from Ford Motor’s SEC filings, earning releases, quarterly and annual reports, investor presentations, press releases, etc., which are available in the following location: Ford shareholders page.
2. Featured images in this article are used under the Creative Commons license and sourced from the following websites: Thomas Hawk and Anathea Utley.
Disclosure
References and examples such as tables, charts, and diagrams are constantly reviewed to avoid errors, but we cannot warrant the total correctness of all content.
The content in this article is for informational purposes only and is neither a recommendation nor a piece of financial advice to purchase a stock.
If you find the information in this article helpful, please consider sharing it on social media and providing a link to it from any website so that more articles like this can be created.
Thank you!

