IQOS and heat stick. Pixabay Image.
This article presents the shipment volumes of Philip Morris International (PMI)’s cigarettes in key regions.
PMI categorizes its markets into four major regions, namely: Europe, SSEA & CIS & MEA, EA & AU & PMI DF, and Americas.
Let’s check it out!
For other key statistics of Philip Morris International, you may find more resources on these pages:
Sales
Revenue
Market Share
- Global market share: cigarette and HTU combined,
- Market share by region: cigarette and HTU combined,
- Market share by country: cigarette and HTU combined,
- Market share by country: cigarette only,
- Market share by country: HTU only,
- Market share of Marlboro and other cigarette brands
Profit Margin
Other Statistics
- Financial health: total debt, payment due, and cash,
- Capital expenditures
Please use the table of contents to navigate this page.
Table Of Contents
Definitions And Overview
Sales By Region (New)
A1. Cigarette Sales By Region
A2. Cigarette Sales By Region in Percentage
Sales By Region (Legacy)
B1. Cigarette Sales By Region
B2. Cigarette Sales By Region in Percentage
Summary And Reference
S1. Insight
S2. References and Credits
S3. Disclosure
Definitions
To help readers understand the content better, the following terms and glossaries have been provided.
Cigarette Sales Volumes: Philip Morris International’s cigarette shipment volumes are measured based on the in-market sales (IMS) volumes.
In-Market Sales (IMS): In-market sales (“IMS”) is defined as sales to the trade channels, which serve the end legal age nicotine users.
Depending on the market and distribution model, IMS may represent an estimate. Consequently, past reported periods may be updated to ensure comparability and to incorporate the most current information.
In other words, in-market sales (IMS) represents the number of units sold to consumers rather than shipments from manufacturers or distributors.
IMS is often used to gauge real consumer demand and market penetration, making it a valuable metric for assessing product performance.
Europe Region: Europe Region is headquartered in Lausanne, Switzerland, and covers all the European Union countries, Switzerland, the United Kingdom, and also Ukraine, Moldova and Southeast Europe.
SSEA, CIS & MEA: South and Southeast Asia, Commonwealth of Independent States, Middle East and Africa Region (“SSEA, CIS & MEA”) is headquartered in Dubai, United Arab Emirates.
It covers South and Southeast Asia, the African continent, the Middle East, Turkey, as well as Israel, Central Asia, Caucasus and Russia.
EA, CIS & PMI DF: East Asia, Australia, and PMI Duty Free Region (“EA, AU & PMI DF”) is headquartered in Hong Kong, and includes the consolidation of PMI’s international duty free business with East Asia & Australia.
Americas: Americas Region is headquartered in Stamford, Connecticut, and covers the United States, Canada and Latin America.
Cigarette Sales By Region (New)
PMI-cigarette-sales-volumes-by-region-new
(click image to expand)
The definition of how PMI measures its cigarette shipment volumes is available here: cigarette sales volumes.
You may find more information about PMI’s regions here: Europe, SSEA, CIS & MEA, EA, AU & PMI DF, and Americas.
PMI reorganized its regions from the previous six to four starting in fiscal year 2023. Prior year data was a recast. Legacy regions are presented here: legacy regions.
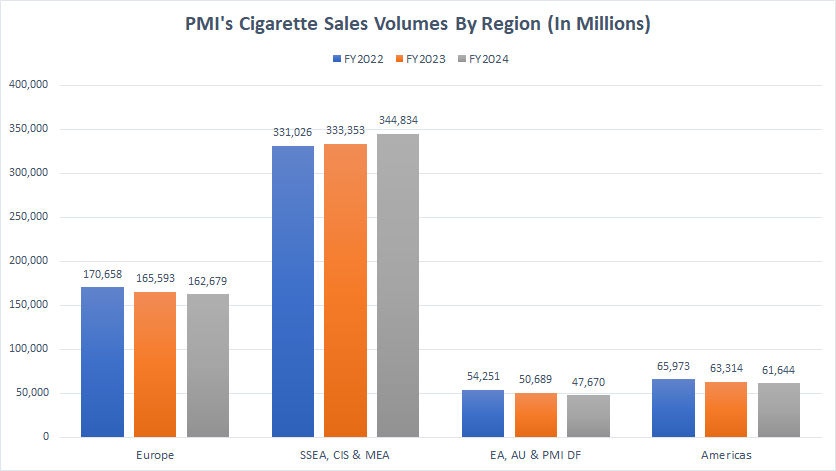
Philip Morris International (PMI) primarily distributes its cigarettes to the SSEA, CIS, and MEA regions, which represent its largest market. Europe follows as PMI’s second-largest market, trailing the SSEA, CIS, and MEA regions in terms of shipments.
The following table shows a detailed breakdown:
Cigarette Sales Volumes in FY2024:
| Region | Sales (in billion units) |
|---|---|
| Europe | 162.7 |
| SSEA, CIS & MEA | 344.8 |
| EA, AU and PMI DF | 47.7 |
| Americas | 61.6 |
| Total Region | 616.8 |
2-Year Sales Trend from FY2022 to FY2024:
| Region | Sales (in billion units) | % Changes |
|---|---|---|
| Europe | 170.7 to 162.7 | -4.7% |
| SSEA, CIS & MEA | 331.0 to 344.8 | +4.2% |
| EA, AU and PMI DF | 54.3 to 47.7 | -12.1% |
| Americas | 66.0 to 61.6 | -6.6% |
| Total Region | 621.9 to 616.8 | -0.8% |
Cigarette Sales By Region In Percentage (New)
PMI-cigarette-sales-volumes-by-region-in-percentage-new
(click image to expand)
The definition of how PMI measures its cigarette shipment volumes is available here: cigarette sales volumes.
You may find more information about PMI’s regions here: Europe, SSEA, CIS & MEA, EA, AU & PMI DF, and Americas.
PMI reorganized its regions from the previous six to four starting in fiscal year 2023. Prior year data was a recast. Legacy regions are presented here: legacy regions.
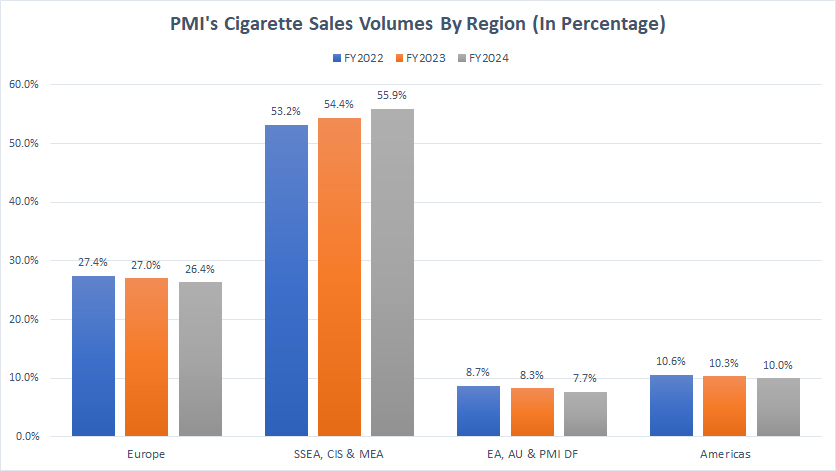
Philip Morris International (PMI) generates over half of its global cigarette sales from shipments to the SSEA, CIS, and MEA regions. In contrast, the EA, AU, and PMI DF region accounts for the smallest share of the company’s cigarette sales volume.
The following table shows a detailed breakdown:
Percentage in FY2024:
| Region | Percentage (%) |
|---|---|
| Europe | 26.4% |
| SSEA, CIS & MEA | 55.9% |
| EA, AU and PMI DF | 7.7% |
| Americas | 10.0% |
2-Year Percentage Trend from FY2022 to FY2024:
| Region | Percentage (%) | % Point Changes |
|---|---|---|
| Europe | 27.4% to 26.4% | -1.1% |
| SSEA, CIS & MEA | 53.2% to 55.9% | +2.7% |
| EA, AU and PMI DF | 8.7% to 7.7% | -1.0% |
| Americas | 10.6% to 10.0% | -0.6% |
Cigarette Sales By Region (Legacy)
PMI-cigarette-sales-volumes-by-region-legacy
(click image to expand)
The definition of how PMI measures its cigarette shipment volumes is available here: cigarette sales volumes.
The regions presented in this section are considered legacy and are no longer classified as reportable segments starting in fiscal year 2023. New reportable regions are presented here: new regions.
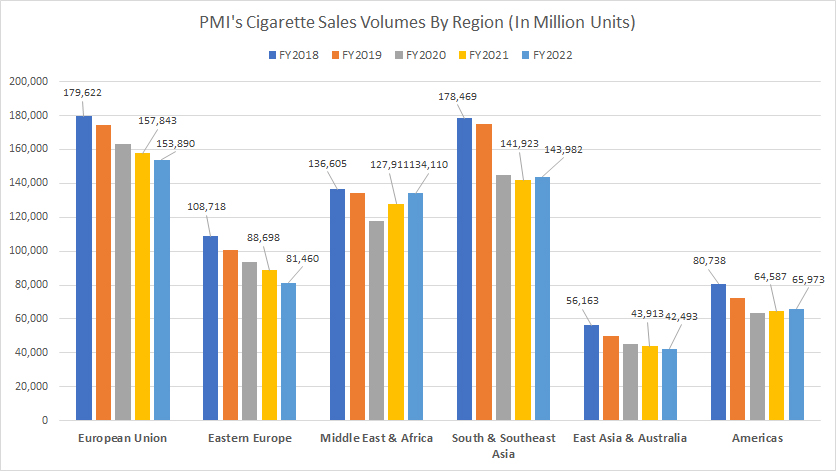
Philip Morris International (PMI)’s cigarette sales in most regions have been on the decline, particularly in European Union and Eastern Europe.
The following table shows a detailed breakdown:
Cigarette Sales Volumes in FY2022:
| Region | Sales (in billion units) |
|---|---|
| European Union | 153.9 |
| Eastern Europe | 81.5 |
| Middle East & Africa | 134.1 |
| South & Southeast Asia | 144.0 |
| East Asia & Australia | 42.5 |
| Americas | 66.0 |
| Total Region | 621.9 |
4-Year Sales Trend from FY2018 to FY2022:
| Region | Sales (in billion units) | % Changes |
|---|---|---|
| European Union | 179.6 to 153.9 | -14.3% |
| Eastern Europe | 108.7 to 81.5 | -25.1% |
| Middle East & Africa | 136.6 to 134.1 | -1.8% |
| South & Southeast Asia | 178.5 to 144.0 | -19.3% |
| East Asia & Australia | 56.2 to 42.5 | -24.3% |
| Americas | 80.7 to 66.0 | -18.3% |
| Total Region | 740.3 to 621.9 | -16.0% |
Cigarette Sales By Region In Percentage (Legacy)
PMI-cigarette-sales-volumes-by-region-in-percentage-legacy
(click image to expand)
The definition of how PMI measures its cigarette shipment volumes is available here: cigarette sales volumes.
The regions presented in this section are considered legacy and are no longer classified as reportable segments starting in fiscal year 2023. New reportable regions are presented here: new regions.
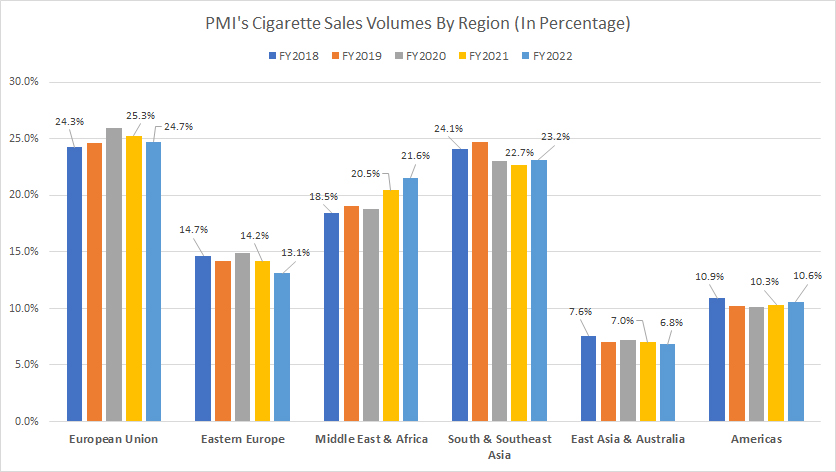
Philip Morris International (PMI)’s cigarette sales, as a share of total sales in most regions, have remained relatively stable despite a notable overall decline. This pattern suggests that the company’s cigarette sales have uniformly decreased across most regions.
The following table shows a detailed breakdown:
Percentage in FY2022:
| Region | Percentage (%) |
|---|---|
| European Union | 24.7% |
| Eastern Europe | 13.1% |
| Middle East & Africa | 21.6% |
| South & Southeast Asia | 23.2% |
| East Asia & Australia | 6.8% |
| Americas | 10.6% |
4-Year Percentage Trend from FY2018 to FY2022:
| Region | Percentage (%) | % Point Changes |
|---|---|---|
| European Union | 24.3% to 24.7% | +0.5% |
| Eastern Europe | 14.7% to 13.1% | -1.6% |
| Middle East & Africa | 18.5% to 21.6% | +3.1% |
| South & Southeast Asia | 24.1% to 23.2% | -1.0% |
| East Asia & Australia | 7.6% to 6.8% | -0.8% |
| Americas | 10.9% to 10.6% | -0.3% |
Insight
Philip Morris International (PMI) continues to rely heavily on the SSEA, CIS, and MEA regions for its cigarette shipments, as these markets collectively account for the majority of its global sales volume.
Despite an overall industry trend toward reduced cigarette consumption, PMI’s sales in these regions have seen steady demand, particularly in countries like Egypt, Indonesia, and Turkey, where smoking remains prevalent.
Europe remains PMI’s second-largest market, though its shipment volumes have experienced gradual decline. Meanwhile, the EA, AU, and PMI DF region contributes the smallest portion of PMI’s global cigarette sales, reflecting the heightened regulatory pressures and shifting consumer preferences toward smoke-free alternatives in markets such as Japan and Australia.
This regional performance highlights the diverging market dynamics PMI must navigate as it works to balance traditional cigarette sales with its transition toward reduced-risk products.
References and Credits
1. All financial figures presented were obtained and referenced from PMI’s quarterly and annual reports published on the company’s investor relations page: PMI’s Reports And Filings.
2. Pexekls Images.
Disclosure
We may use artificial intelligence (AI) tools to assist us in writing some of the text in this article. However, the data is directly obtained from original sources and meticulously cross-checked by our editors multiple times to ensure its accuracy and reliability.
If you find the information in this article helpful, please consider sharing it on social media. Additionally, providing a link back to this article from any website can help us create more content like this in the future.
Thank you for your support and engagement! Your involvement helps us continue to provide high-quality, reliable content.


