Green energy. Pexels Image.
This article compares the vehicle profit and margin of Tesla and BYD.
For your information, BYD does not break down its gross profit by segment. Instead, it combines the gross profit of its automotive and mobile handset businesses.
Therefore, the presented BYD’s automotive gross profit here is derived under the assumption that the automotive segment contributes 60% of gross profit.
This ratio is conservative given that BYD’s revenue contribution from the automotive segment is about 80%, as shown in this article: BYD revenue by segment.
On the other hand, Tesla’s gross profit share from its automotive segment is 80%, as shown in this article: Tesla’s gross profit breakdown.
Let’s look at the details!
For other key statistics of Tesla and BYD, you may find more resources on these pages:
Sales
Revenue
Profit Margin
- Tesla profit margin by segment: automotive, energy, and services,
- BYD vehicle margin and profit per car,
R&D Comparison
Please use the table of contents to navigate this page.
Table Of Contents
Definitions And Overview
Gross Profit
A1. Tesla vs BYD: Automotive Gross Profit
Gross Margin
B1. Tesla vs BYD: Automotive Gross Margin
Profit Per Car
C1. Tesla vs BYD: Gross Profit Per Vehicle
Summary And Reference
S1. Insight
S2. References and Credits
S3. Disclosure
Definitions
To help readers understand the content better, the following terms and glossaries have been provided.
Currency Conversion: Yuan to USD: The exchange rate I used for converting the Chinese Yuan to USD is 1,000 Chinese Yuan to 137.53 USD.
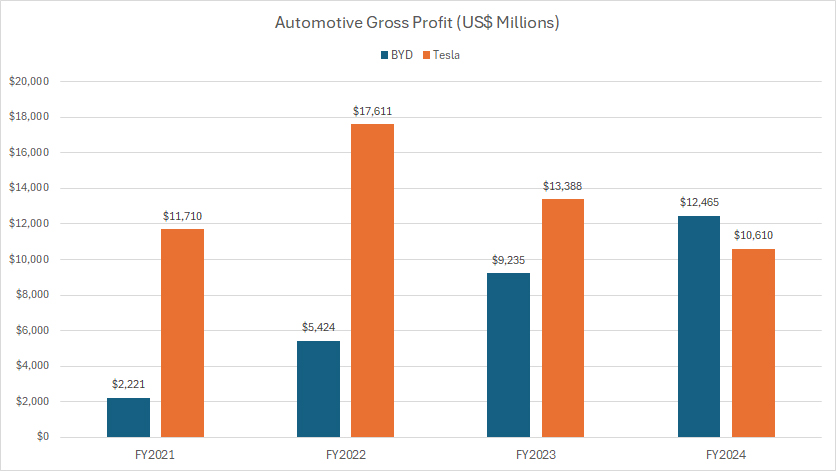
Tesla vs BYD: Automotive Gross Profit
byd-vs-tesla-automotive-gross-profit
(click image to expand)
BYD reports its financial results in native currency Chinese Yuan. For the exchange rate between the Chinese Yuan and USD, please refer to this section: Chinese Yuan to USD conversion.
I need to stress again that BYD’s automotive gross profit presented here is derived under the assumption that the automotive segment contributes around 60% of the consolidated gross profit.
This estimate is conservative, considering that about 80% of BYD’s total revenue originates from the automotive sector, as highlighted in this article: BYD revenue by segment.
If the actual contribution exceeds 60%, BYD’s automotive profit would significantly surpass Tesla’s.
As it stands, BYD’s automotive gross profit reached $12.5 billion in fiscal year 2024, modestly outpacing Tesla’s $10.6 billion.
Over the longer term, spanning 2021 to 2024, BYD’s automotive gross profit has soared from $2.2 billion to $12.5 billion, reflecting a more than fivefold increase.
Meanwhile, Tesla’s automotive gross profit has remained relatively stable, fluctuating between $11.7 billion and $10.6 billion over the same period.
Tesla vs BYD: Automotive Gross Margin
byd-vs-tesla-automotive-gross-margin
(click image to expand)
BYD reports its financial results in native currency Chinese Yuan. For the exchange rate between the Chinese Yuan and USD, please refer to this section: Chinese Yuan to USD conversion.
Again, BYD’s automotive gross profit presented here is derived under the assumption that its automotive segment accounts for approximately 60% of the consolidated gross profit.
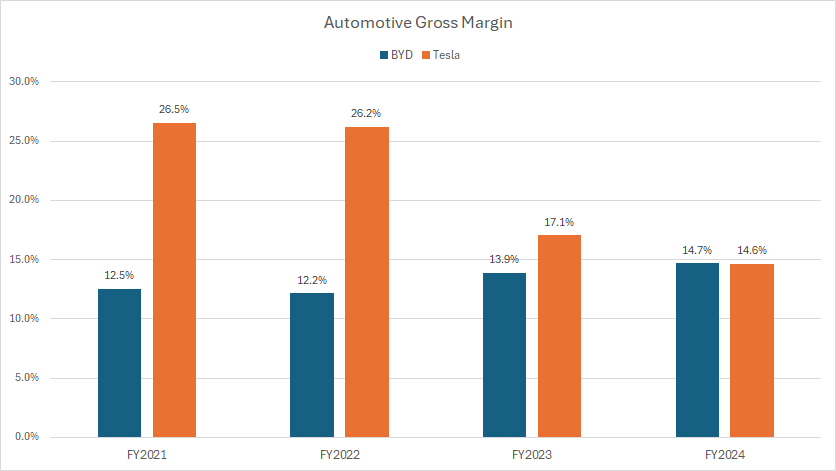
From a gross margin standpoint, BYD’s automotive margin closely aligns with Tesla’s, as depicted in the chart above.
In fiscal year 2024, BYD’s automotive gross margin was 14.7%, compared to Tesla’s 14.6%, indicating a similar profitability level between the two companies.
However, a significant long-term trend emerges when analyzing Tesla’s historical gross margin shifts. Over the past four years, Tesla’s automotive gross margin has undergone a sharp decline, falling from 26.5% in 2021 to 14.6% in 2024 — a drop of nearly 12 percentage points.
BYD, in contrast, has experienced steady margin expansion. From 2021 to 2024, its automotive gross margin rose from 12.5% to 14.7%, reflecting operational improvements and cost efficiencies that have strengthened profitability.
This divergence highlights a key competitive shift — Tesla’s margin compression over recent years suggests rising cost pressures or pricing adjustments, while BYD’s steady increase indicates strong execution in cost control and production efficiency.
Tesla vs BYD: Gross Profit Per Vehicle
byd-vs-tesla-gross-profit-per-car
(click image to expand)
BYD reports its financial results in native currency Chinese Yuan. For the exchange rate between the Chinese Yuan and USD, please refer to this section: Chinese Yuan to USD conversion.
Keep in mind that BYD’s gross profit per car presented here is derived under the assumption that its automotive segment accounts for approximately 60% of the consolidated gross profit.
If the actual ratio exceeds 60%, BYD’s profit per car will be much closer to Tesla’s result.
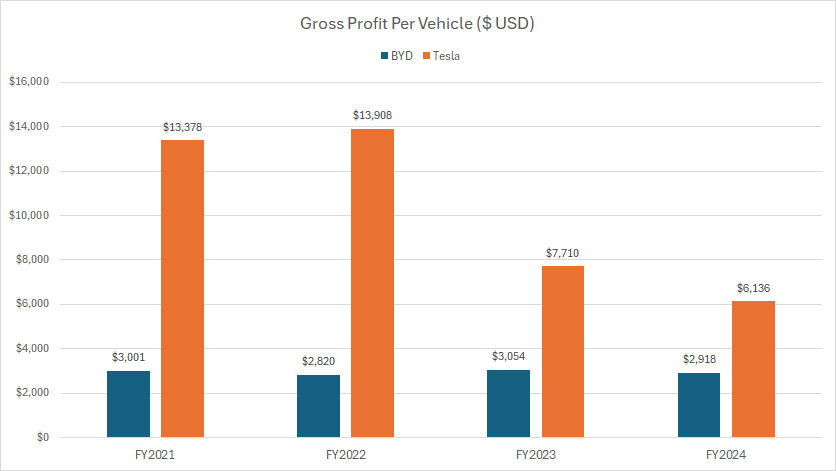
That said, despite BYD’s automotive gross profit and gross margin being on par with Tesla’s, its profit per car remains significantly lower, as reflected in the accompanying chart.
In fiscal year 2024, BYD’s gross profit per vehicle was $2,900, compared to Tesla’s $6,100 — showing that Tesla generates twice the profit per vehicle as BYD.
A key trend is that BYD’s profit per car has remained relatively stable over the past four years, consistently averaging around $3,000 per vehicle.
Tesla’s profit per car, on the other hand, has declined dramatically — falling from over $13,000 per vehicle in 2021 to just $6,100 in 2024, marking a drop of more than 50%.
Tesla’s declining profit per vehicle may signal potential pricing pressures, cost increases, or strategic adjustments, while BYD’s stability suggests consistency in cost management and production efficiency
Insight
The analysis assumes that BYD’s automotive segment contributes 60% of its total gross profit — a conservative estimate, given that approximately 80% of its revenue stems from automotive sales.
In contrast, Tesla’s actual automotive gross profit share stands at 80%, affirming its strong reliance on vehicle sales for profitability.
Despite this difference in profit allocation, BYD’s financial performance showcases rapid growth, with expanding profit and improving margins.
Tesla, however, has experienced margin compression and a decline in profit per vehicle, hinting at cost pressures or strategic pricing shifts.
If BYD’s automotive profit contribution exceeds the estimated 60%, its gross profit lead over Tesla would be even more pronounced, reinforcing its growing financial strength.
However, Tesla still maintains a higher profit per vehicle, emphasizing its premium pricing strategy and operational efficiency, which continues to set it apart.
References and Credits
1. All financial figures presented were obtained and referenced from the companies’ respective annual and quarterly reports published on the following investor relations pages:
– Tesla Investor Relations
– BYD Investor Relations.
2. Pexels Images.
Disclosure
We may use artificial intelligence (AI) tools to assist us in writing some of the text in this article. However, the data is directly obtained from original sources and meticulously cross-checked by our editors multiple times to ensure its accuracy and reliability.
If you find the information in this article helpful, please consider sharing it on social media. Additionally, providing a link back to this article from any website can help us create more content like this in the future.
Thank you for your support and engagement! Your involvement helps us continue to provide high-quality, reliable content.


