Dashboard. Pexels Image.
This article provides an overview of Ford Motor Company’s market share, broken down by country, including the U.S., China, Canada, the United Kingdom, Germany, and others.
Additionally, it covers Ford’s market share by region, encompassing North America, Europe, South America, and ASEAN.
For other statistics of Ford Motor, you may find more information on these pages:
- Ford global sales and market share,
- Ford sales by country – US, China, Canada, UK, Germany, and more, and
- Ford wholesales worldwide and breakdown by segment.
Please use the table of contents to navigate this page.
Table Of Contents
Definitions And Overview
O2. What contributes to the decline in Ford Motor’s market share in China?
United States And China
A1. Market Share In The U.S.
A2. Market Share In China
Canada, U.K., And Germany
A3. Market Share In Canada, U.K., And Germany
Türkiye, Italy, Australia, And France
A4. Market Share In Türkiye And Australia
A5. Market Share In Italy And France
Mexico, Brazil, Argentina, And India
A6. Market Share In Mexico, Brazil, Argentina, And India
North America, Europe 20, South America, And ASEAN
B1. Market Share In North America, Europe 20, South America, And ASEAN
Conclusion And Reference
S1. Conclusion
S2. References and Credits
S3. Disclosure
Definitions
To help readers understand the content better, the following terms and glossaries have been provided.
Market Share: Ford’s market share is defined as the percentage of its retail sales with respect to the industry volume in the relavant market or region, according to its annual reports.
The market share equation is as follows:
Market Share = Retail Sales / Industry Volume
According to Ford, the industry volume is an internal estimate based on publicly available data collected from various government, private, and public sources around the globe. It includes medium and heavy trucks.
Europe 20: Europe 20 markets are United Kingdom, Germany, France, Italy, Spain, Austria, Belgium, Czech Republic, Denmark, Finland, Greece, Hungary, Ireland, the Netherlands, Norway, Poland, Portugal, Romania, Sweden, and Switzerland.
Europe 20 excludes Russia and Turkey.
China: China includes Taiwan; China market share includes Ford brand and JMC brand vehicles produced and sold by its unconsolidated affiliates.
Unconsolidated Affiliates: Unconsolidated affiliates are companies in which a parent company holds a significant, but not a controlling, interest.
Typically, this means the parent company owns between 20% and 50% of the affiliate’s voting shares. Because the parent company does not have full control over the affiliate’s operations, the financial results of unconsolidated affiliates are not fully included in the parent company’s consolidated financial statements.
Instead, the parent company accounts for its investment in unconsolidated affiliates using the equity method. This means the parent company’s share of the affiliate’s profits or losses is reported as a single line item in the parent company’s income statement, and the investment is adjusted accordingly on the balance sheet.
What contributes to the decline in Ford Motor’s market share in China?
Several factors have contributed to the decline in Ford Motor’s market share in China:
- Increased Competition:
- The Chinese automotive market has seen a surge in competition, particularly from local manufacturers like BYD and international players like Tesla. These companies have been more successful in capturing the growing demand for electric vehicles (EVs) in China.
- Shift to Electric Vehicles:
- Chinese consumers are increasingly embracing electric vehicles, and local manufacturers have been quick to respond to this trend. Ford has faced challenges in transitioning to EVs as rapidly as some of its competitors, impacting its market share.
- Cost Competitiveness:
- Ford has struggled with cost competitiveness in the Chinese market. The company has acknowledged that its costs are not competitive, which has affected its ability to compete effectively with local and international manufacturers.
- Economic Factors:
- Economic factors, including rising costs and the transition to EVs, have also played a role in Ford’s declining market share. The company has had to make strategic adjustments, such as cutting jobs and streamlining operations, to address these challenges.
- Consumer Preferences:
- Changing consumer preferences in China have also impacted Ford’s market share. Chinese consumers are increasingly favoring brands that offer advanced technology, better fuel efficiency, and lower emissions. Ford has faced challenges in meeting these evolving preferences.
Summary
In summary, the decline in Ford Motor’s market share in China can be attributed to increased competition, the shift to electric vehicles, cost competitiveness issues, economic factors, and changing consumer preferences.
These challenges have necessitated strategic adjustments by Ford to remain competitive in the world’s largest automotive market.
Market Share In The U.S.
Ford-market-share-in-the-US
(click image to expand)
The explanation of Ford’s market share is available here: market share.
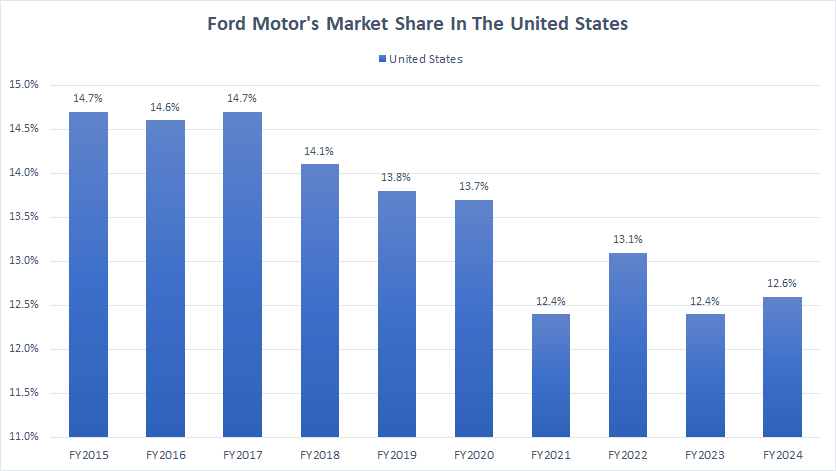
Ford had a market share of around 12.6% in the U.S. in fiscal year 2024, a slight increase from 12.4% in fiscal year 2023, according to its annual reports. In fiscal year 2022, Ford’s market share in the U.S. was 13.1%.
Over the past three years, Ford’s market share in the U.S. has remained relatively stable, averaging 12.7%. This stability indicates a consistent presence in the U.S. automotive market despite minor fluctuations.
However, looking at a longer-term perspective, Ford’s U.S. market share has significantly declined. Nearly a decade ago, Ford’s market share was 14.7%, but it has dropped to record lows over the last several years.
This decline suggests that Ford has faced increased competition and market challenges, leading to a reduction in its market share over time.
Factors such as the rise of new competitors, changes in consumer preferences, and shifts in the automotive industry may have contributed to this decline.
Market Share In China
Ford-market-share-in-China
(click image to expand)
The explanation of Ford’s market share is available here: market share. You can find the definition of Ford’s China market share here: China.
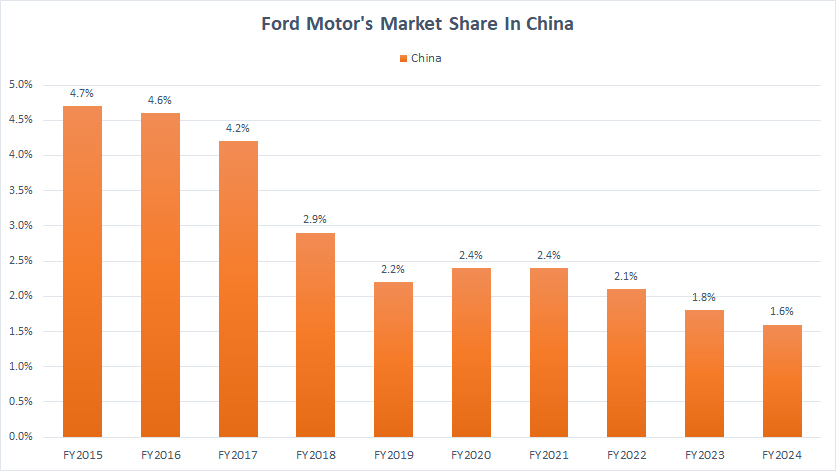
Ford has also experienced a significant market share decline in China, which is much more severe than the decline in the U.S.
While the decline in the U.S. market has been relatively modest, the drop in Ford’s market share in China seems to have no end in sight. Over the past several years, Ford’s market share in China has been persistently decreasing.
In the U.S., Ford’s market share has remained relatively stable, averaging 12.7% over the past three years (2022-2024). However, the long-term trend shows a decline from 14.7% nearly a decade ago to around 12.6% in recent years.
In contrast, the decline in China has been much more pronounced. From a peak of 4.7% in 2015, Ford’s market share has dropped to 1.6% in 2024. On average, Ford’s market share in China has been a modest 1.8% over the past three years (2022-2024).
This significant drop highlights the challenges Ford faces in maintaining its presence in the highly competitive Chinese automotive market.
The Chinese market is highly competitive, with local manufacturers like BYD and international players like Tesla gaining significant market share.
The rapid adoption of electric vehicles (EVs) in China has favored companies that have been quicker to transition to EV production. Besides, Ford has struggled with cost competitiveness in China, impacting its ability to compete effectively with other manufacturers.
Moreover, Chinese consumers are increasingly favoring brands that offer advanced technology, better fuel efficiency, and lower emissions. As Ford navigates these challenges, it will need to adapt its strategies to regain and maintain market share in China.
Market Share In Canada, U.K., And Germany
Ford-market-share-in-Canada-UK-and-Germany
(click image to expand)
The explanation of Ford’s market share is available here: market share.
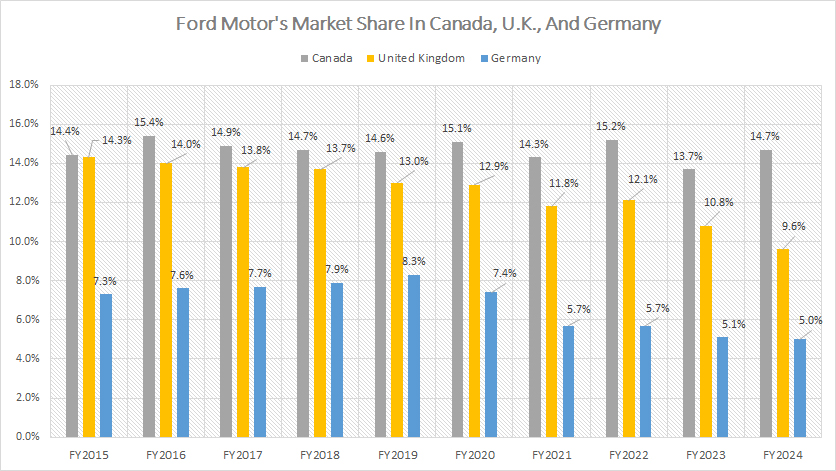
Ford’s market share in Canada has remained relatively stable, averaging around 14.5% over the past three years (2022-2024). In fiscal year 2024, Ford recorded a market share of 14.7% in Canada, up slightly from 13.7% reported in fiscal year 2023.
On a longer-term perspective, from fiscal year 2015 to 2024, Ford’s market share in Canada has shown stability, indicating a consistent presence in the Canadian automotive market.
Ford has consistently offered a robust lineup of vehicles that cater to the preferences and needs of Canadian consumers, including popular models such as the Ford F-150, Ford Escape, and Ford Explorer.
Besides, Ford enjoys strong brand loyalty in Canada, with a dedicated customer base that continues to choose Ford vehicles for their reliability and performance.
In contrast to its stability in Canada, Ford has seen a significant decline in market share in the United Kingdom. In fiscal year 2015, Ford reported a market share of 14.3% in the U.K. However, this figure declined to just 9.6% as of fiscal year 2024.
Over the last three years, Ford’s market share in the U.K. has continued to decrease, dropping from 12.1% in fiscal year 2022 to 9.6% as of fiscal year 2024.
The U.K. automotive market has become highly competitive, with both local and international manufacturers vying for market share. Brands like Volkswagen, BMW, and new entrants in the electric vehicle (EV) market have intensified the competition.
For Germany, Ford reported a market share of 5.0% in this country in fiscal year 2024, roughly in line with that reported in fiscal year 2023. In fiscal year 2022, Ford’s market share in Germany was at 5.7%.
After peaking at 8.3% in fiscal year 2019, Ford’s market share in Germany has been on a continuous decline, reaching record lows over the last several years.
The German automotive market is highly competitive, with strong local manufacturers like Volkswagen, BMW, and Mercedes-Benz, as well as international competitors.
In addition, the rapid shift to electric vehicles (EVs) in Germany has benefited companies that have been quicker to transition to EV production. Ford has faced challenges in this area, impacting its market share in this European country.
Market Share In Türkiye And Australia
Ford-market-share-in-Turkey-and-Australia
(click image to expand)
The explanation of Ford’s market share is available here: market share.
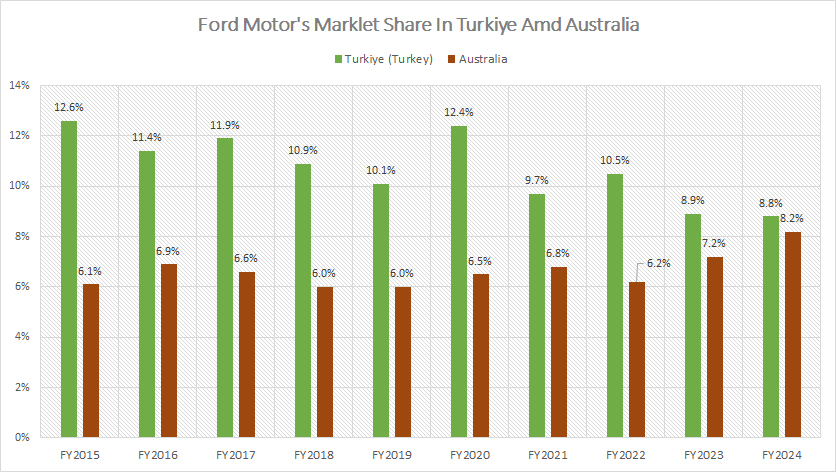
In fiscal year 2024, Ford’s market share in Turkey was 8.8%, which is roughly in line with its market share in fiscal year 2023. However, this figure represents a significant decrease when compared to the 10.5% market share recorded in fiscal year 2022.
The three-year average (2022-2024) of Ford’s market share in Turkey was 9.4%. Over a longer term, Ford’s market share in Turkey has seen a significant decline.
In fiscal year 2015, Ford’s market share in Turkey was 12.6%. The drop to 8.8% in fiscal year 2024 illustrates this substantial decline over nearly a decade.
The Turkish automotive market has become more competitive, with both local and international manufacturers vying for market share. Economic challenges in Turkey, such as currency fluctuations and inflation, may have impacted consumer purchasing power and preferences, affecting overall market dynamics.
In contrast to the declines seen in Turkey, Ford’s market share in Australia has remained consistent and has even increased over recent years. Since fiscal year 2022, Ford’s market share in Australia has risen from 6.2% to 8.2% over the past three years (2022-2024).
Looking at a longer-term perspective, Ford’s market share in Australia has shown solid and steady growth. For example, Ford reported market share of 6.1% in Australia in fiscal year 2015. This figure came in at 7.2% in fiscal year 2023, and further increased to 8.1% as of fiscal year 2024.
This demonstrates a clear upward trend, indicating that Ford has successfully maintained and expanded its presence in the Australian automotive market over nearly a decade.
Ford has continued to offer a robust lineup of vehicles that appeal to Australian consumers, including popular models such as the Ford Ranger and Ford Everest.
Besides, Ford has benefited from strong brand loyalty in Australia, with a dedicated customer base that continues to support the brand.
Market Share In Italy And France
Ford-market-share-in-Italy-and-France
(click image to expand)
The explanation of Ford’s market share is available here: market share.
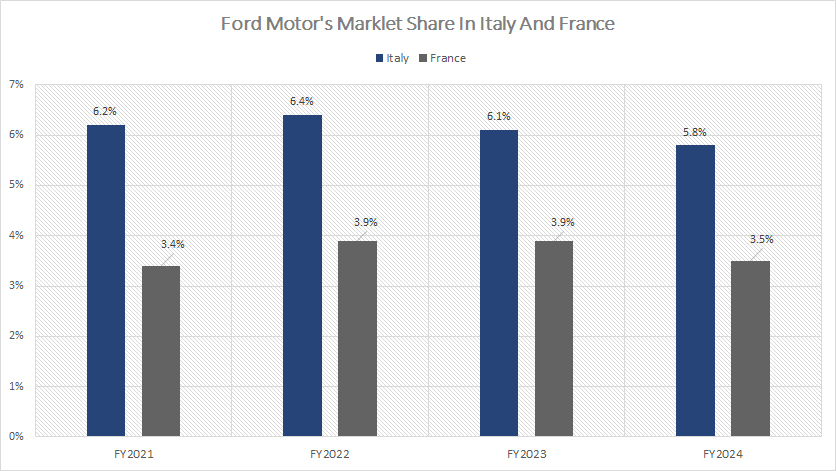
Ford’s market share in Italy and France has remained relatively stable over the past four years (2021-2024), as depicted in the chart above.
In fiscal year 2024, Ford reported a market share of 5.8% in Italy. This figure indicates a slight decrease from the 6.2% market share recorded in fiscal year 2021.
Despite this minor decline, Ford has managed to maintain a strong competitive position in the Italian automotive market.
Similarly, Ford’s market share in France has shown relative stability. In fiscal year 2024, Ford’s market share stood at 3.5%, a slight increase from the 3.4% recorded in fiscal year 2021.
This indicates that Ford has maintained its competitive edge in the French market despite minor fluctuations.
Ford’s ability to offer strong product offerings, build brand recognition, adapt to market conditions, and implement effective marketing strategies has helped maintain its market presence in both countries.
Market Share In Mexico, Brazil, Argentina, And India
Ford-market-share-in-Mexico-Brazil-Argentina-and-India
(click image to expand)
The explanation of Ford’s market share is available here: market share.
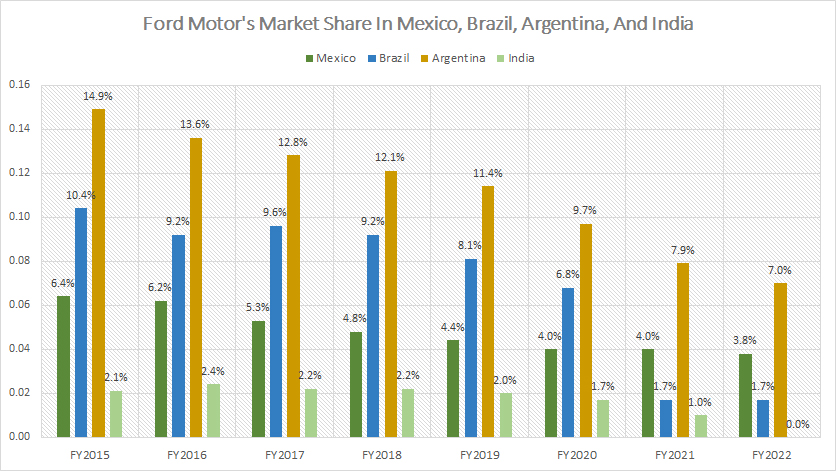
Ford has stopped reporting market share data for countries presented in the chart above since fiscal year 2023, likely due to poor sales performance.
Based on the latest available data from fiscal year 2022, Ford’s market share in these countries amounted to 3.8% in Mexico, 1.7% in Brazil, and 7% in Argentina.
For India, Ford’s last available market share data was 1.0% in fiscal year 2021.
A significant trend is that Ford has experienced significant market share decline in these countries. For example, Ford’s market share in Mexico has reduced by nearly half, dropping from 6.4% in fiscal year 2015 to 3.8% in fiscal year 2022.
Similarly, Ford’s market share in Brazil was down to only 1.7% in fiscal year 2022, from 10.4% seven years ago.
For Argentina, Ford’s market share in this South American country has been cut by half, decreasing from 14.9% in fiscal year 2015 to 7% in fiscal year 2022.
Ford’s market share in India has averaged just 2% in the past. This figure declined to 1% in fiscal year 2021.
The automotive markets in these countries have become more competitive, with both local and international manufacturers gaining market share at Ford’s expense.
Apart from that, economic factors such as currency fluctuations, inflation, and overall market instability have impacted Ford’s ability to maintain its market share.
Market Share In North America, Europe 20, South America, And ASEAN
Ford-market-share-in-America-Europe-and-Asean
(click image to expand)
The definitions of Ford’s market share and Europe 20 are available here: market share and Europe 20.
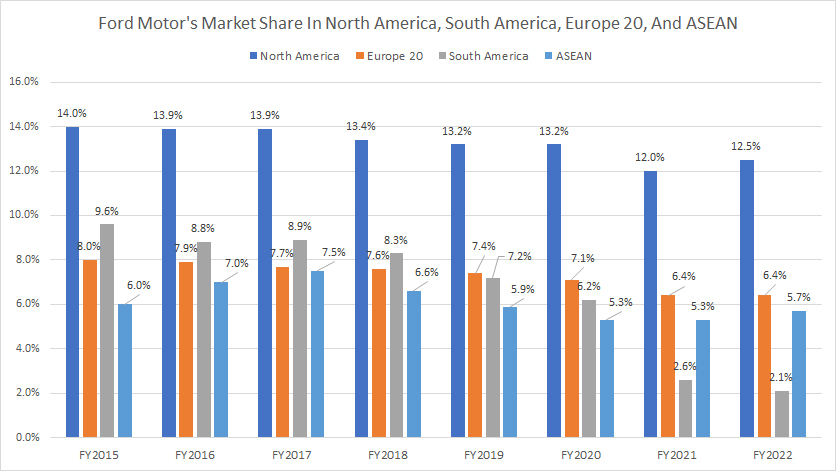
Ford has stopped providing regional market share data starting in fiscal year 2023. The last available data was from fiscal year 2022.
From a regional perspective, Ford has the highest market share in North America compared to other regions such as Europe, South America, and ASEAN.
In fiscal year 2022, Ford’s market share in North America amounted to 12.5%, up slightly from 12% in fiscal year 2021.
On a long-term perspective, Ford’s market share in North America has remained relatively solid, decreasing by only a modest amount, from 14% in fiscal year 2015 to 12.5% in fiscal year 2022.
Ford’s market share in Europe has also decreased by a slight margin since fiscal year 2015, from 8.0% to 6.4% over the eight-year period (2015-2022).
Ford has experienced the most severe decline in market share in South America. It went from 9.6% in fiscal year 2015 to just 2.1% in fiscal year 2022.
Ford’s market share in Asean has remained relatively stable, averaging around 6% over the eight-year period (2015-2022).
In summary, while Ford’s market share has remained strong in North America, showing only modest declines, the company has faced significant challenges in other regions.
The most notable decline has been in South America, where market share has plummeted. Europe has seen a slight decrease, and ASEAN has remained stable.
The variation in performance across different regions highlights the diverse market dynamics Ford faces globally.
Conclusion
In summary, Ford has experienced a mixed performance across different regions and countries. While Ford maintains a strong presence and stability in North America and shows growth in Canada and Australia, it faces significant challenges in South America, the United Kingdom, and other regions.
The consistent performance in ASEAN and relative stability in Italy and France provide some positive notes. However, the overall trend indicates the need for strategic adjustments and innovations to address market challenges and regain competitiveness in regions where market share has declined.
References and Credits
1. All market share data presented were obtained and referenced from Ford’s annual reports published on the company’s investor relation page: Ford’s Financial Reports.
2. Pexels Images.
Disclosure
We may utilize the assistance of artificial intelligence (AI) tools to produce some of the text in this article. However, the data is directly obtained from original sources and meticulously cross-checked by our editors multiple times to ensure its accuracy and reliability.
If you find the information in this article helpful, please consider sharing it on social media. Additionally, providing a link back to this article from any website can help us create more content like this in the future.
Thank you for your support and engagement! Your involvement helps us continue to provide high-quality, reliable content.

