Ford Mustang. Pexels Image.
This article presents the retail sales of trucks, SUVs, and cars of Ford Motor Company. The sales data presented represents only U.S. sales. In addition, we only look at the retail sales data.
For other sales statistics of Ford Motor, you may find more information on these pages:
- Ford sales by vehicle type – electric, hybrid, and internal combustion,
- Ford global sales and market share by country, and
- Ford revenue per vehicle in North America, Europe, and China.
Please use the table of contents to navigate this page.
Table Of Contents
Definitions And Overview
O2. Why Are Ford’s Sedan Sales On The Decline Compared To Truck And SUV?
U.S. Vehicle Sales
A1. Truck, SUV, And Car Sales
A2. Percentage Of Truck, SUV, And Car Sales
Growth Rates Of U.S. Vehicle Sales
A3. Growth Rates Of Truck, SUV, And Car Sales
Conclusion And Reference
S1. Conclusion
S2. References and Credits
S3. Disclosure
Definitions
To help readers understand the content better, the following terms and glossaries have been provided.
Vehicle Retail Sales: Vehicle retail sales refer to the number of vehicles sold directly to consumers through retail channels, such as dealerships.
Ford Motor defines its retail vehicle sales as sales primarily by dealers, sales to the government, and leases to Ford management, and is based, in part, on estimated vehicle registrations; includes medium and heavy trucks.
This metric typically includes sales of new and used cars, trucks, and other types of vehicles. Vehicle retail sales provide insight into consumer demand and purchasing behavior in the automotive market.
Understanding vehicle retail sales is crucial for manufacturers, dealerships, and market analysts to assess the health and trends of the automotive market.
Why Are Ford’s Sedan Sales On The Decline Compared To Truck And SUV?
Ford Motor Company’s sedan sales have been declining compared to trucks and SUVs for several reasons:
- Market Demand: Consumer preferences have shifted significantly towards trucks and SUVs, which are perceived as more versatile and capable vehicles. This trend has been growing over the past decade.
- Profitability: Trucks and SUVs generally offer higher profit margins compared to sedans. Ford decided to focus on these segments to maximize profitability.
- Resource Allocation: The automotive industry is resource-intensive, requiring significant investment in production facilities, tooling, and supply chains. Ford chose to allocate its resources to growing segments like trucks and SUVs rather than the declining sedan market.
- Strategic Shift: In 2018, Ford announced it would phase out most of its sedan models in the U.S., including well-known models like the Fiesta, Fusion, and Taurus. The company decided to invest in its lineup of trucks, SUVs, and crossovers, which now make up the majority of its sales.
These factors combined have led to a significant decline in sedan sales for Ford, while trucks and SUVs have become the primary focus of their business strategy.
Truck, SUV, And Car Sales
ford-truck-suv-and-car-sales-in-the-us
(click image to expand)
The explanation of Ford’s vehicle retail sales is available here: vehicle retail sales.
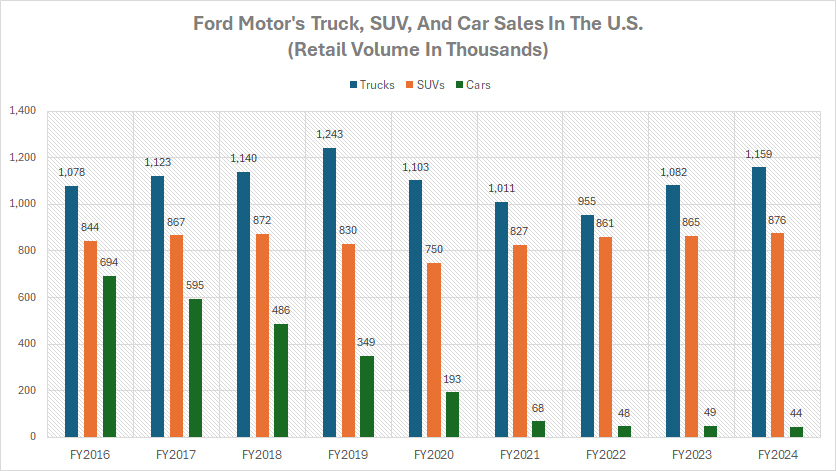
In most fiscal years, Ford’s truck sales in the U.S. significantly exceed those of other vehicle categories, such as SUVs and cars, as illustrated in the chart above.
In fiscal year 2024, Ford’s truck sales in the U.S. surpassed 1.16 million units, while SUV sales reached 876,000 units. In contrast, Ford sold only 44,000 cars or sedans in the U.S. during the same period.
A significant trend is that Ford’s truck sales in the U.S. have remained robust, consistently surpassing a minimum of 1 million units in most fiscal years.
Similarly, Ford’s SUV sales in the U.S. have also shown stability, with the company delivering at least 800,000 units in most fiscal years. In stark contrast, Ford’s sales of cars or sedans in the U.S. have dramatically declined.
As highlighted in the section: Ford car sales collapsed in the U.S., several factors have contributed to the significant decline in Ford’s sedan sales in the U.S.
For example, there has been a shift in market demand towards trucks and SUVs. Consumer preferences have moved significantly towards these vehicle types, which are perceived as more versatile and capable. This trend has been growing steadily over the past decade.
Another major factor contributing to the decline in Ford’s car or sedan sales in the U.S. is the higher profit margin associated with trucks and SUVs. Trucks and SUVs typically offer higher profit margins compared to sedans. Consequently, Ford decided to focus on these segments to maximize profitability.
Percentage Of Truck, SUV, And Car Sales
ford-truck-suv-and-car-sales-in-the-us-in-percentage
(click image to expand)
The explanation of Ford’s vehicle retail sales is available here: vehicle retail sales.
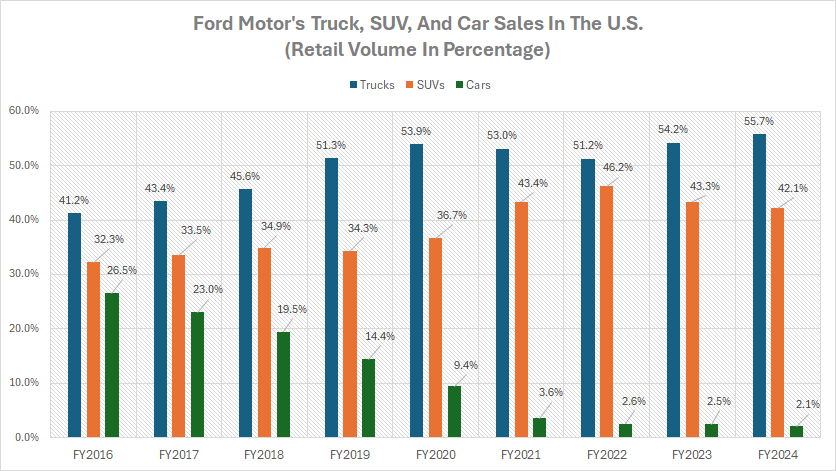
Over the past nine years, Ford’s truck and SUV sales in the U.S. have significantly increased as a proportion of the company’s total retail volume, as depicted in the graph above.
Since fiscal year 2016, the percentage of Ford’s truck sales in the U.S. relative to the company’s total volume in this region has increased from 41% to 56%. Similarly, the proportion of SUVs to the company’s total retail volume has also risen significantly, from 32% to 42% between fiscal year 2016 and 2024.
Combined, the total volume of truck and SUV sales in fiscal year 2024 accounted for a staggering 98% of Ford’s total volume in the U.S.
In contrast, Ford’s car sales in the U.S. have experienced a significant decline, falling from 26.5% of the company’s total volume in fiscal year 2016 to just 2.1% by fiscal year 2024.
As previously discussed, there are multiple factors contributing to the varying percentages of trucks, SUVs, and cars in Ford’s sales. These factors include shifting market demand, higher profit margins, and Ford’s strategic focus on more profitable and popular vehicle segments.
In short, Ford’s truck and SUV sales in the U.S. have significantly increased over the past nine years, both in terms of total units sold and as a percentage of the company’s overall retail volume.
In contrast, car sales have sharply declined. This shift is driven by changing consumer preferences, higher profit margins for trucks and SUVs, and Ford’s strategic focus on these more profitable and popular segments.
Growth Rates Of Truck, SUV, And Car Sales
ford-growth-rates-of-truck-suv-and-car-sales-in-the-us
(click image to expand)
The explanation of Ford’s vehicle retail sales is available here: vehicle retail sales.
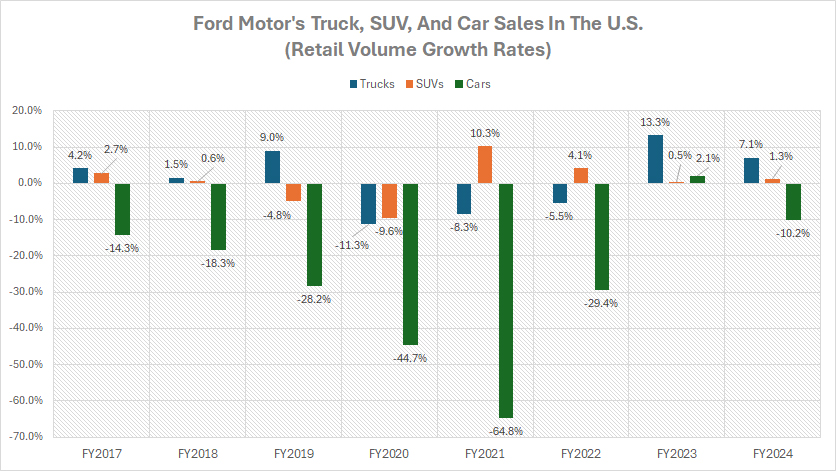
According to the chart above, Ford’s U.S. truck sales have experienced the most significant growth compared to SUV and car. On the other hand, Ford’s U.S. car sales have mostly recorded negative growth rates over the period shown.
On average, Ford’s U.S. truck sales have grown by 5% annually between fiscal years 2022 and 2024. During the same period, SUV sales have increased by 2% annually. However, Ford’s U.S. sedan sales have declined by an average of 12.5% annually over the last three years.
In fiscal year 2024, Ford’s U.S. truck sales increased by 7%, while SUV sales rose by 1.3% compared to the previous year. In stark contrast, Ford’s car sales in the U.S. plummeted by a staggering 10.2% during the same period.
Conclusion
To recap, Ford’s truck and SUV sales in the U.S. have experienced significant growth, both in total units sold and as a percentage of the company’s overall retail volume. On the other hand, Ford’s car sales have dramatically declined, dropping to just 2.1% of total volume with only 44,000 units sold.
This shift is driven by changing consumer preferences, higher profit margins for trucks and SUVs, and Ford’s strategic focus on these more profitable and popular segments.
References and Credits
1. All vehicle sales data presented in this article were obtained and referenced from Ford’s car sales reports published in the company’s investor relation page: Ford’s Car Sales Reports.
2. Pexels Images.
Disclosure
References and examples such as tables, charts, and diagrams are constantly reviewed to avoid errors, but we cannot warrant the total correctness of all content.
The content in this article is for informational purposes only and is neither a recommendation nor a piece of financial advice to purchase a stock.
If you find the information in this article helpful, please consider sharing it on social media and providing a link to it from any website so that more articles like this can be created.
Thank you!


