Maserati car. Pixabay image.
This article provides an in-depth analysis of Stellantis’ vehicle sales across key markets in the Asia-Pacific (APAC) region, including China, India, and other countries.
Apart from vehicles sales, we also look at Stellantis’ market share in the Asia Pacific region.
Keep in mind that the vehicle sales data presented is based on the retail volumes, and may differ significantly from the wholesale results.
Let’s get started!
For other key statistics of Stellantis, you may find more resources on these pages:
Revenue
- Stellantis wholesale, revenue breakdown, and profit margin,
- Stellantis revenue segments and profit margin by division
Sales & Market Share
Other Statistics
Please use the table of contents to navigate this page.
Table Of Contents
Definitions And Overview
Consolidated Sales
A1. Total Vehicle Sales in Major Markets in the Asia Pacific
Sales By Country
B1. Vehicle Sales in China, Japan, India, Australia, and other Asian countries
B2. Percentage of Vehicle Sales in China, Japan, India, Australia, and other Asian countries
Consolidated Market Share
C1. Total Market Share in Major Markets in the Asia Pacific
Market Share By Country
D1. Market Share in China, Japan, India, Australia, and other Asian countries
Conclusion And Reference
S1. Insight
S2. References and Credits
S3. Disclosure
Definitions
To help readers understand the content better, the following terms and glossaries have been provided.
New Vehicle Sales: Stellentis defines its new vehicle sales as the sales of vehicles primarily by dealers and distributors or, directly by the company in some cases, to retail customers and fleet customers.
Sales include mass-market and luxury vehicles manufactured at Stellantis’ plants, manufactured by joint ventures and third-party contract manufacturers, and distributed under its brands. Sales figures exclude sales of vehicles that it contracts to manufacture for other OEMs.
While vehicle sales are illustrative of Stellantis’s competitive position and the demand for its vehicles, sales are not directly correlated to net revenues, cost of revenues, or other measures of financial performance in any given period.
For a discussion of Stellantis’ vehicle shipments that directly correlate to its Net revenues, Cost Of revenues, and other financial measures, you may visit this article: Stellantis Vehicle Wholesale.
Asean & General Distributors (AGD): AGD includes Bangladesh, Brunei, Cambodia, French Polynesia, Indonesia, Laos, Malaysia, Myanmar, Nepal, New Caledonia, Philippines, Singapore, Sri Lanka, Thailand, and Vietnam.
Total Vehicle Sales in Major Markets in the Asia Pacific
Stellantis-vehicle-sales-Asia-Pacific
(click image to expand)
A definition of Stellantis’ vehicle sales is available here: vehicle sales.
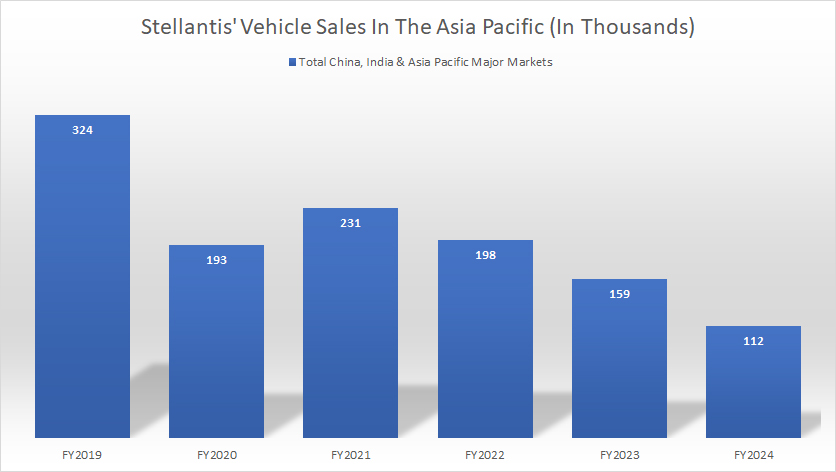
Stellantis’ total vehicle sales in the Asia Pacific declined to only 112,000 vehicles in fiscal year 2024 from 159,000 vehicles in fiscal year 2023, down 30% year-over-year.
Stellantis has consistently sold fewer vehicles in the Asia Pacific since 2021, with vehicle sales reaching their lowest level as of 2024, demonstrating the company’s declining competitive position in this region.
Vehicle Sales in China, Japan, India, Australia, and other Asian countries
Stellantis-vehicle-sales-Asia-Pacific-by-country
(click image to expand)
The definitions of Stellantis’ vehicle sales is available here: vehicle sales. AGD’s definition is available here: AGD.
-
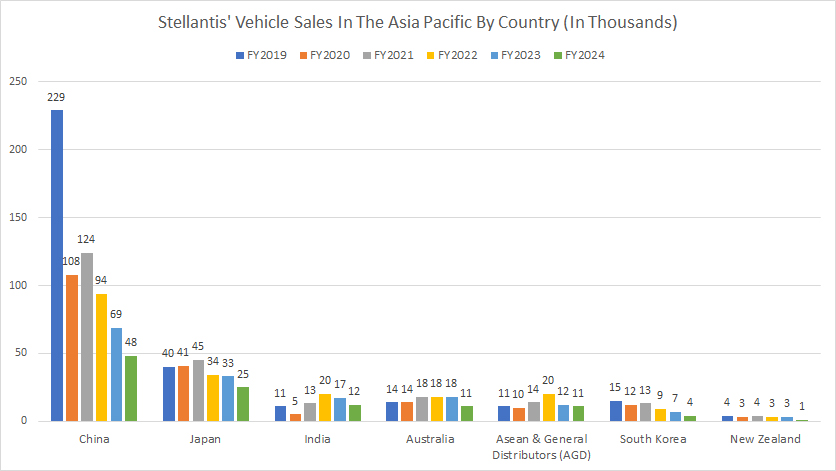
China: China is Stellantis’ biggest market in the Asia Pacific, with vehicle sales reaching 48,000 units in fiscal 2024 in this country. Although Stellantis vehicle sales in China are much larger than in any other country in the Asia Pacific, they have significantly declined in the past five years, from over 200,000 units to only 48,000 units in the latest result.
-
Japan: Stellantis’ retail volume in Japan decreased to 25,000 vehicles as of fiscal year 2024 from 33,000 vehicles in the previous year. This result makes Japan the second-largest market for Stellantis in the Asia Pacific.
-
India & Australia: India and Australia contribute about the same number of vehicle sales to Stellantis. As of fiscal year 2024, the company sold 12,000 and 11,000 vehicles in India and Australia, respectively.
-
AGD & South Korea: Stellantis delivered 11,000 vehicles in Asean & General Distributors in 2024, while vehicle sales in South Korea were much lower at 4,000 units in the same period.
-
New Zealand: Stellantis’ vehicle sales in New Zealand were among the lowest in the Asia Pacific, totaling only 1,000 units in fiscal year 2024.
A noticeable trend is that Stellantis’ vehicle sales in most countries in the Asia Pacific have significantly declined since 2019, highlighting Stellantis’ decreasing competitive position in this region. The declining trend is the most obvious in China.
Percentage of Vehicle Sales in China, Japan, India, Australia, and other Asian countries
Stellantis-vehicle-sales-Asia-Pacific-by-country-in-percentage
(click image to expand)
The definitions of Stellantis’ vehicle sales is available here: vehicle sales. AGD’s definition is available here: AGD.
-
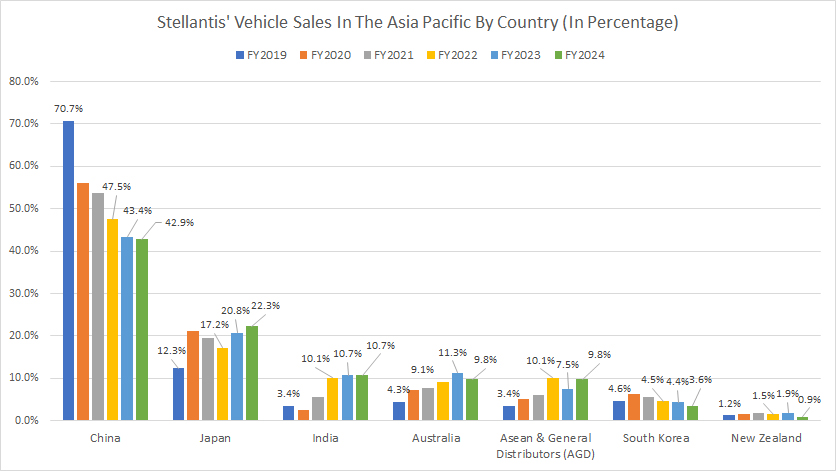
China: Stellantis’ China contributed 43% of sales in the Asia Pacific region as of fiscal year 2024, down considerably from over 70% in 2019.
-
Japan: On the other hand, Japan’s sales accounted for 22% of Stellantis’ total volume in the Asia Pacific in fiscal year 2024, up from 12.3% in 2019.
-
India & Australia: India and Australia each contributed about 10% of sales to the company in 2024.
-
AGD & South Korea: Sales in the AGD made up only 10% of Stellantis’ total retail volume in the Asia Pacific, while the ratio of South Korea landed at 3.6% as of 2024.
-
New Zealand: New Zealand’s sales formed the lowest ratio among all Asia Pacific countries, at less than 1.0% in 2024.
Although vehicle sales in most countries in the Asia Pacific have decreased, their respective sales percentages have increased, implying that vehicle sales in China have fallen at much faster rates than any other country in this region.
Total Market Share in Major Markets in the Asia Pacific
Stellantis-market-share-Asia-Pacific
(click image to expand)
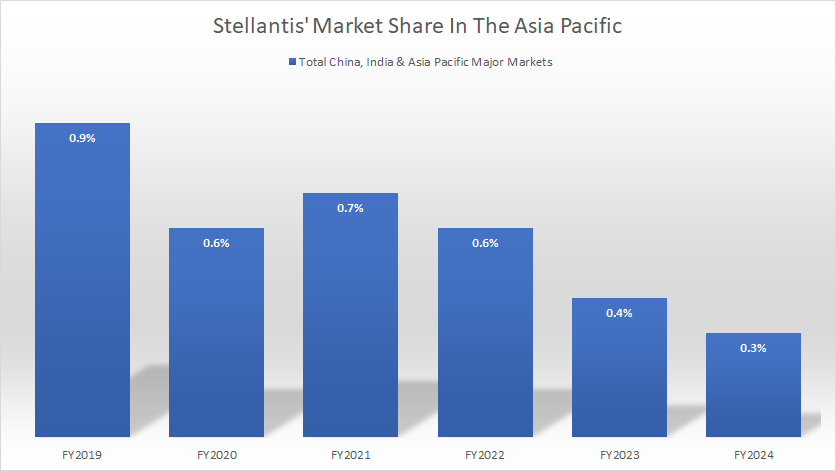
Stellantis achieved a total market share of only 0.3% in the Asia Pacific region as of fiscal year 2024, down slightly from 0.4% in 2023.
A noticeable trend is that Stellantis’ market share in the Asia Pacific has never exceeded 1.0% since 2019, demonstrating the company’s poor competitive position in this region.
Also, Stellantis’s market share in the Asia Pacific has significantly decreased since 2019, from 0.9% in 2019 to 0.3% in the latest result.
Market Share in China, Japan, India, Australia, and other Asian countries
Stellantis-market-share-Asia-Pacific-by-country
(click image to expand)
AGD’s definition is available here: AGD.
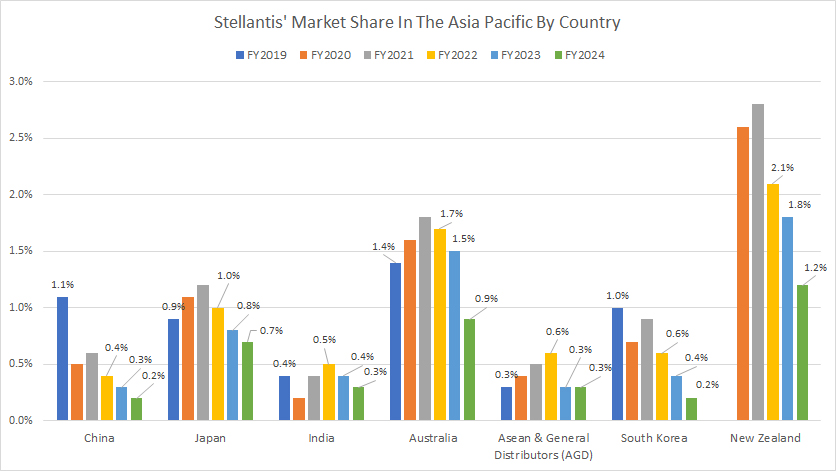
Although Stellantis sells the most vehicles in China in the Asia Pacific, its market share in this country is pathetic, as shown in the chart above.
-
China: According to the data, Stellentis’ market share in China was only 0.2% in fiscal year 2024, a record low since 2019. Additionally, the company’s market share has declined from 1.1% in 2019 to 0.2% in 2024, consistent with the decrease in vehicle sales we noted earlier in our discussion: Stellantis China sales.
-
Japan: Stellantis had a slightly higher market share in Japan, at 0.7% as of 2024. Stellatis’ market share in Japan has also decreased from 1.2% in 2021 to 0.7% as of 2024.
-
India: Stellantis’ market share of 0.3% in India indicates its poor competitive position in this country.
-
AGD & South Korea: As of fiscal year 2024, Stellantis has less than 0.5% market share South Korea and the Asean & General Distributors (AGD) region.
-
Australia & New Zealand: Stellantis’ market share in Australia and New Zealand was among the highest compared to other countries in the Asia Pacific. As of 2024, the market share numbers in these countries arrived at 0.9% and 1.2%, respectively.
A noticeable trend is that Stellantis’ market share in most countries in the Asia Pacific has considerably decreased in the past three years, demonstrating the company’s declining competitive position in this region.
Insight
Stellantis has a limited presence in the Asia-Pacific (APAC) region, with low vehicle sales and minimal market share across most markets.
Over the past several years, its performance has declined significantly, particularly in China, where competitive pressures and shifting consumer preferences have contributed to a sharp downturn in sales.
Despite the overall decline, Stellantis has maintained resilience in certain APAC markets. In Japan, its market share has remained relatively stable, while in India, it has held firm at 0.3% as of 2024, unchanged from five years ago.
These markets highlight Stellantis’ selective strength in the region, even as its broader APAC presence faces challenges.
References and Credits
1. All financial figures presented were obtained and referenced from Stellantis’ quarterly and annual reports published on the company’s investor relations page: Stellantis Investor Relation.
2. Pixabay images.
Disclosure
We may use artificial intelligence (AI) tools to assist us in writing some of the text in this article. However, the data is directly obtained from original sources and meticulously cross-checked by our editors multiple times to ensure its accuracy and reliability.
If you find the information in this article helpful, please consider sharing it on social media. Additionally, providing a link back to this article from any website can help us create more content like this in the future.
Thank you for your support and engagement! Your involvement helps us continue to provide high-quality, reliable content.

