Debt leverage. Pixabay Image
This article presents how General Motors (NYSE: GM) funds its balance sheets, whether by debt, equity, or equally both.
The analysis of GM’s debt leverage and capital structure involves evaluating various ratios like the debt-to-equity and debt-to-assets ratios.
Investors interested in GM’s debt figures and liquidity may visit this page here: GM US$120 Billion Debt Problem.
Let’s get started!
Let’s look at more details, starting with the table of contents below.
Table Of Contents
Overview And Definitions
Total Debt Leverage
Individual Debt Leverage
B1. Automotive Debt To Equity Ratio
B2. GM Financial Debt To Equity Ratio
Adjusted Debt Leverage
C1. Net Debt To Equity Ratio
C2. Unsecured Debt To Equity Ratio
Liability Leverage
D1. Long-Term Liabilities To Equity Ratio
D2. Total Liabilities To Equity Ratio
Capital Structure
E1. Total Debt To Assets Ratio
E2. Total Liabilities To Assets Ratio
Total Debt As A Percentage Of Liabilities
F1. Total Debt To Total Liabilities Ratio
Summary And Reference
S1. Summary
S2. References and Credits
S3. Disclosure
Definitions
To help readers understand the content better, the following terms and glossaries have been provided.
Debt To Equity Ratio: Debt to equity ratio is a financial metric to evaluate a company’s leverage level. It compares the amount of debt a company has to its shareholders’ equity, indicating how much of its funding comes from borrowing versus investments made by its owners.
By analyzing this ratio, investors and analysts can gain insight into a company’s financial health, risk level, and ability to repay its debts. Understanding the debt-to-equity ratio can be critical for making informed investment decisions and evaluating a company’s overall financial performance.
Capital Structure: Capital structure refers to the way a company finances its operations through a combination of debt and equity. The capital structure of a company can have a significant impact on its financial performance and long-term sustainability.
It determines how much of a company’s funding comes from borrowing versus investments made by its owners. The primary goal of a company’s capital structure is to achieve an optimal balance between debt and equity that maximizes shareholder value while minimizing financial risk.
Understanding capital structure is crucial for investors and managers, as it can impact a company’s ability to raise capital, invest in growth opportunities, and generate profits. In this context, analyzing a company’s capital structure can provide valuable insights into its financial health and help investors make informed decisions about investing in the company.
Types of Debt
The following debt definitions have been provided to help readers understand the content better.
Automotive Debt: General Motors (GM) automotive debt is the amount of debt the company has incurred to finance its automotive operations.
This includes debt incurred for research and development, manufacturing, and marketing of its vehicles. As of 3Q 2023, GM’s total automotive debt was reported to be approximately US$16.4 billion, which is a significant amount of leverage for the company.
However, it’s worth noting that GM has been trying to reduce its debt levels in recent years and has successfully decreased its automotive debt by more than 50% since 2020.
GM Financial Debt: GM Financial’s debt refers to the total amount of borrowing that GM Financial, the subsidiary of General Motors that provides auto financing, has taken on to fund its operations.
This includes debt incurred for providing loans and leases to customers and debt for other expenses like research and development and marketing. As of 3Q 2023, GM Financial’s total debt was reported to be approximately US$103 billion.
Analyzing GM Financial’s debt can provide insights into the company’s financial health, ability to generate profits, and overall leverage level within the larger General Motors organization.
GM Net Debt: Net debt is a financial metric representing the difference between a company’s total debt and its cash and cash equivalents.
In the case of General Motors (GM), net debt would be the difference between the company’s total debt (which includes both automotive debt and GM Financial’s debt) and its available cash and cash equivalents. This metric provides insight into the company’s overall debt leverage and its ability to repay its debts.
As of 3Q 2023, GM’s net debt was reported to be approximately US$35 billion.
GM Unsecured Debt: GM’s unsecured debt refers to the debt that is not backed by any collateral or asset and, therefore, is considered riskier for the lenders.
It is a type of debt with no specific asset pledged as collateral, which means that in case of default, the lender cannot seize any particular asset to recover the outstanding amount. Unsecured debt is usually issued based on the borrower’s creditworthiness and financial health, and the interest rates are generally higher than secured debt.
General Motors (GM) has issued unsecured debt in the past, which includes bonds, notes, and other similar financial instruments. As of 3Q 2023, GM’s unsecured debt reached approximately US$74 billion, consisting of automotive and GM Financial portions.
Debt To Equity Ratio
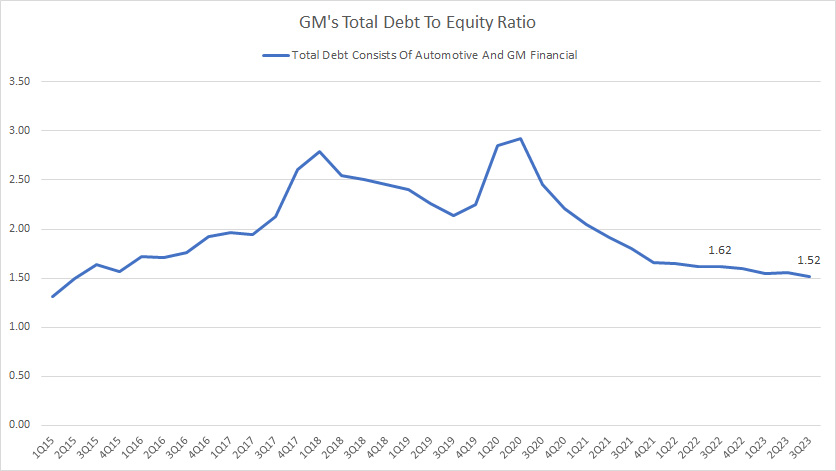
GM total debt to equity ratio
(click image to expand)
GM’s total debt consists of automotive and GM Financial. This figure came in at US$119 billion as of 3Q 2023.
GM’s total equity reached US$78 billion as of 3Q 2023.
As such, GM’s debt-to-equity ratio was 1.52X as of 3Q 2023, slightly lower than the 1.62X ratio measured a year ago.
At a debt-to-equity ratio of about 1.5X, GM’s debt leverage was 1.50 dollars of debt to 1.00 dollars of equity.
Since 2020, GM has reduced its debt-to-equity ratio from almost 3.0X to 1.52X, indicating a significant improvement in debt leverage.
Therefore, GM’s total debt of US$120 billion should not be a problem for the company as the debt leverage has remarkably declined.
Automotive Debt To Equity Ratio
GM-automotive-debt-to-equity-ratio
(click image to expand)
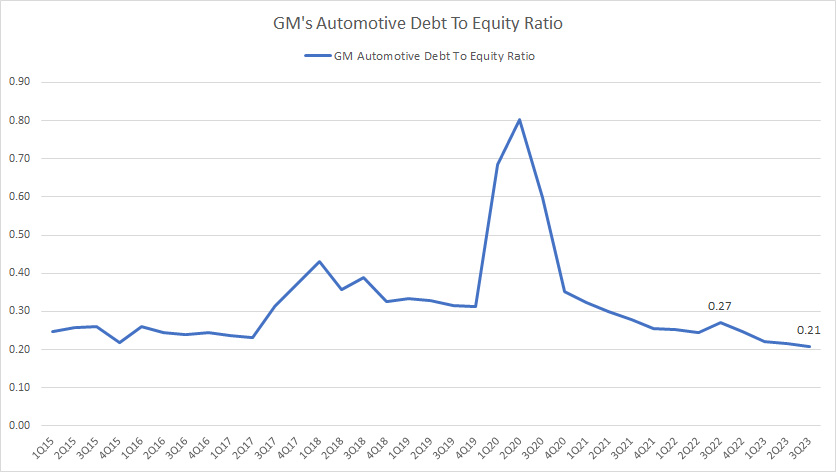
GM’s automotive debt was US$16.4 billion as of 3Q 2023, consisting of only 14% of the total debt.
Therefore, GM’s automotive debt-to-equity ratio was only 0.21X as of 3Q 2023, a significantly low leverage with respect to equity.
At a debt-to-equity ratio of 0.21X, GM’s automotive debt leverage was 0.20 dollars of debt to 1.00 dollars of equity.
Moreover, GM’s automotive debt leverage has significantly declined since 2020, suggesting the automotive segment’s remarkable deleveraging effort in the post-pandemic era.
GM Financial Debt To Equity Ratio
GM-Financial-debt-to-equity-ratio
(click image to expand)
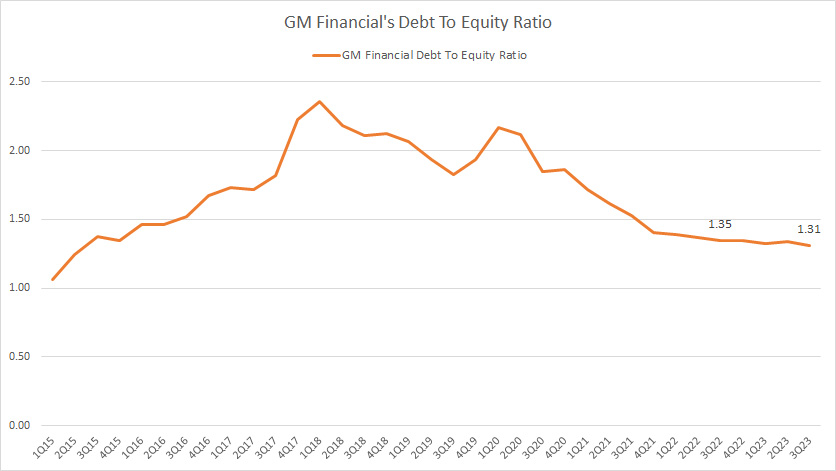
GM Financial’s debt was US$102.5 billion as of 3Q 2023, consisting of 86% of the total debt.
Therefore, GM Financial’s debt was the biggest debt contributor to the company.
As of 3Q 2023, GM Financial’s debt-to-equity ratio reached 1.31X, down slightly over the quarter a year ago.
At a debt-to-equity ratio of 1.31X, GM Financial’s debt leverage was 1.30 dollars of debt to 1.00 dollars of equity.
Similarly, GM Financial’s debt leverage has significantly declined since 2020, suggesting the segment’s remarkable deleveraging effort in the post-pandemic era.
Net Debt To Equity Ratio
GM net debt to equity ratio
(click image to expand)
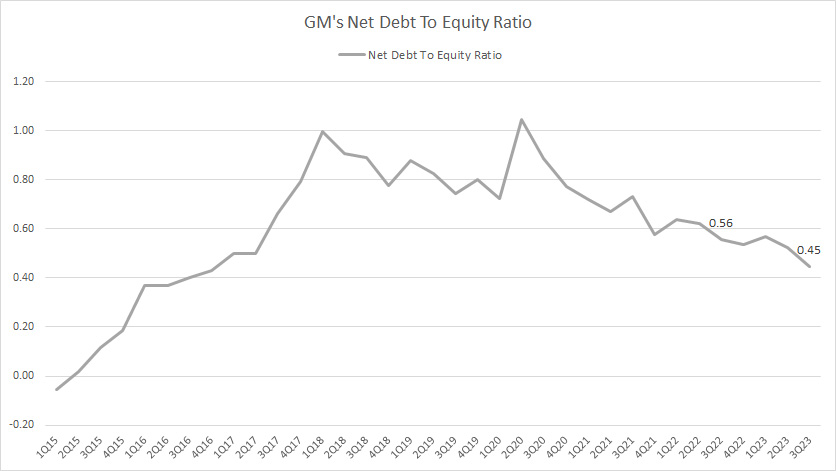
GM’s net debt came in at US$35 billion after accounting for the cash on hand.
As of 3Q 2023, GM’s net debt to equity ratio reached 0.45X, down slightly over the quarter a year ago.
At a debt-to-equity ratio of 0.45X, GM’s net debt leverage was only 0.45 dollars of debt to 1.00 dollars of equity.
Similarly, GM’s net debt leverage has significantly declined since 2020, suggesting the company’s remarkable effort in debt reduction in the post-pandemic era.
Unsecured Debt To Equity Ratio
GM-unsecured-debt-to-equity-ratio
(click image to expand)
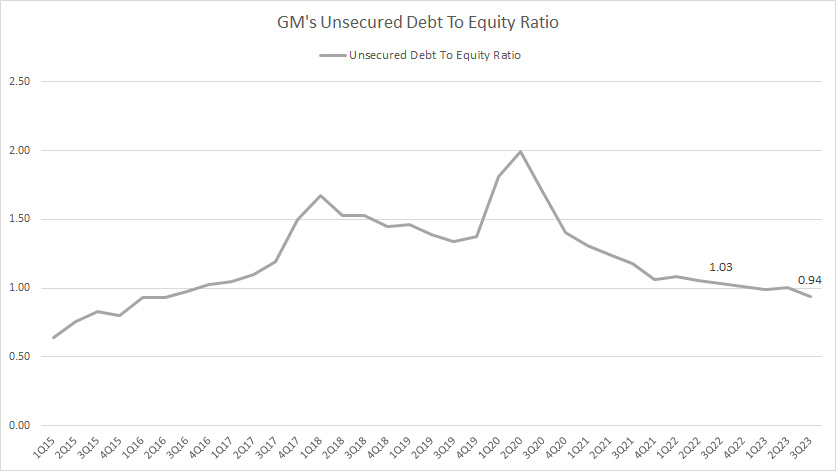
GM’s unsecured debt came in at US$73.6 billion as of 3Q 2023.
As a result, GM’s unsecured debt-to-equity ratio reached 0.94X, down slightly over the quarter a year ago.
At a debt-to-equity ratio of 0.94X, GM’s unsecured debt leverage was only 0.94 dollars of debt to 1.00 dollars of equity.
Similarly, GM’s unsecured debt leverage has significantly declined since 2020, implying that the massive unsecured debt should not threaten GM’s financial health.
Long-term Liabilities To Equity Ratio
GM long-term liabilities to equity ratio
(click image to expand)
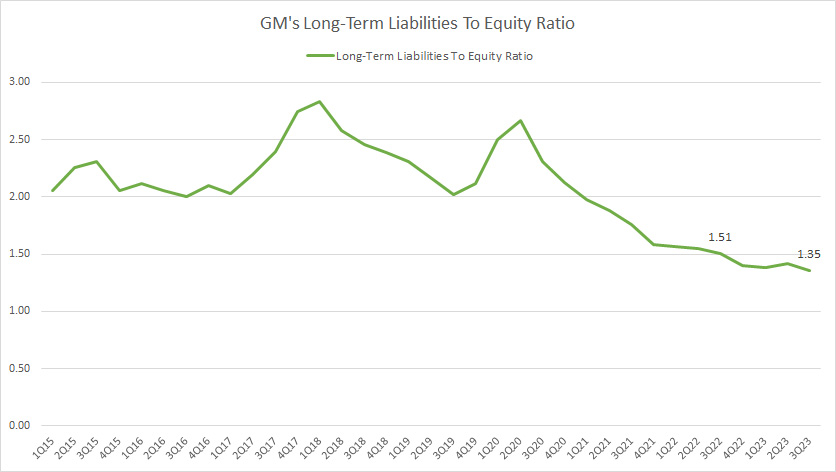
GM had approximately US$106 billion in long-term liabilities as of 3Q 2023.
As of fiscal 3Q 2023, GM’s long-term liabilities to equity ratio reached 1.35X, a record low since 2015.
GM’s long-term liabilities leverage has significantly declined since 2015, indicating that the company has responsibly managed its indebtedness.
Total Liabilities To Equity Ratio
GM total liabilities to equity ratio
(click image to expand)
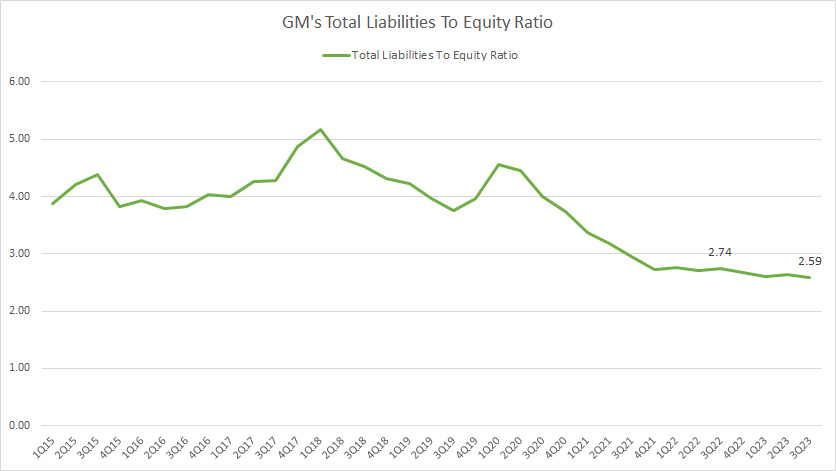
GM had approximately US$203 billion in total liabilities as of 3Q 2023.
As of fiscal 3Q 2023, GM’s total liabilities to equity ratio reached 2.59X, a record low since 2015.
GM’s total liabilities leverage has significantly declined over the years, indicating a well-managed indebtedness.
Total Debt To Asset Ratio
GM total debt to asset ratio
(click image to expand)
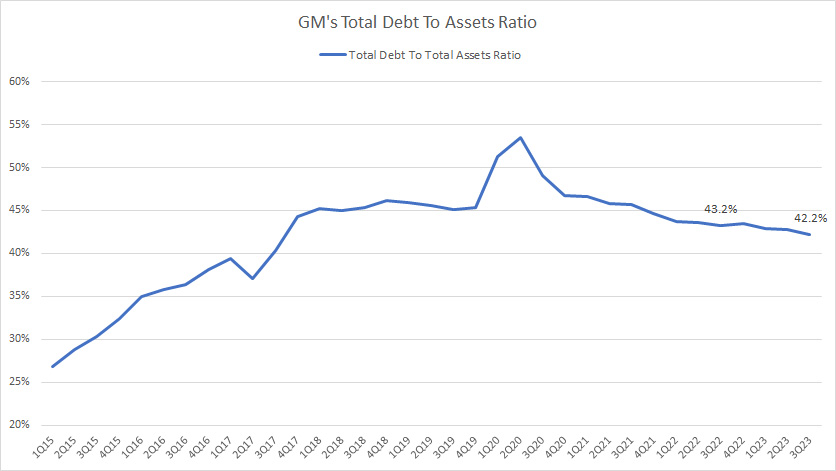
GM’s total debt of US$119 billion represents about 42% of its total assets in fiscal 3Q 2023.
At a debt-to-assets ratio of 42% or 0.42X, GM’s debt structure is 0.42 dollars of debt for every $1.00 of assets.
Moreover, this ratio has significantly declined since 2020, suggesting that GM has responsibly deleveraged its debt level in the post-pandemic periods.
Total Liabilities To Asset Ratio
GM total liabilities to asset ratio
(click image to expand)
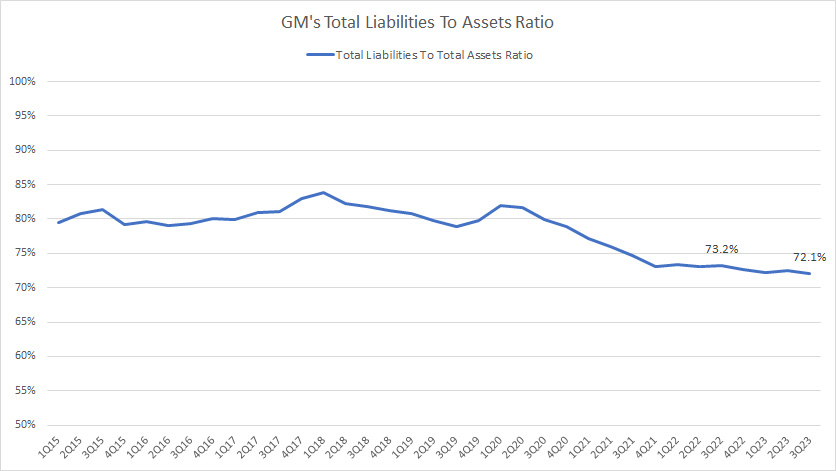
GM’s total liabilities of US$203 billion represent about 72% of its total assets in fiscal 3Q 2023.
In other words, most of GM’s assets are represented by liabilities such as debt instruments (both current and long-term), post-retirement benefits, pensions, and other liabilities.
The rest of GM’s assets are made up of shareholders’ equity, or 38% of its assets.
Despite the seemingly high debt ratio, GM’s total liabilities have significantly declined with respect to total assets since 2015.
The chart above shows that the ratio exceeded 80% in 2015.
The decline of GM’s total liabilities to assets ratio shows that GM has responsibly managed its indebtedness and has not let it go out of hand.
Total Debt To Total Liabilities Ratio
GM-total-debt-to-total-liabilities-ratio
(click image to expand)
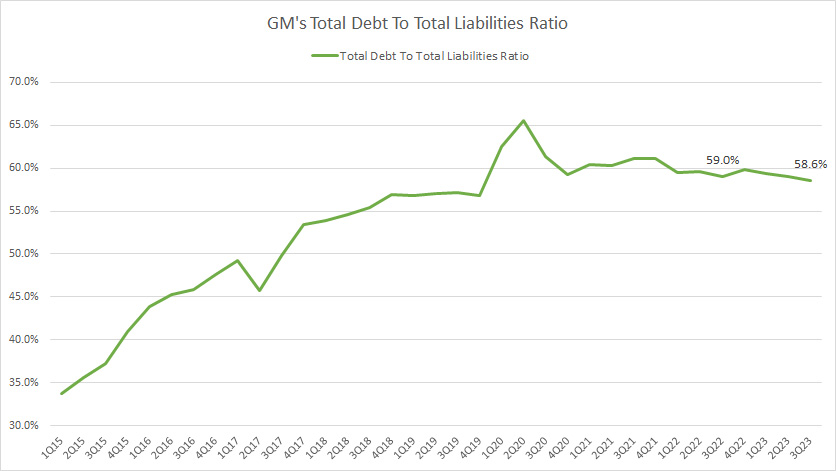
GM’s total debt made up about 59% of its total liabilities in fiscal 3Q 2023.
This ratio has significantly risen since 2015, from 35% in 2015 to the latest figure of 59%.
GM’s total liabilities are predominantly comprised of debt at 59%, with the remaining portion being other liabilities such as accrued liabilities, postretirement benefits, pensions, etc.
The increasing debt ratio indicates GM’s higher priority on debt while gradually reducing other liabilities.
Conclusion
In summary, GM’s debt leverage has been managed reasonably well.
Most ratios have remained steady or declined as of fiscal 2023 compared to several years ago.
Particularly, GM’s debt leverage in the post-pandemic era is considerably lower than in 2020, illustrating the company’s properly managed indebtedness.
In short, GM’s debt should not pose an issue for the company’s financial well-being.
References and Credits
1. All financial figures presented in this article were obtained and referenced from GM’s quarterly and annual reports, SEC filings, investor presentations, press releases, etc., which are available in General Motors’ Financial Reports.
2. Featured images in this article are used under Creative Commons licenses and sourced from the following websites: Truck Hardware
Disclosure
References and examples such as tables, charts, and diagrams are constantly reviewed to avoid errors, but we cannot warrant the total correctness of all content.
The content in this article is for informational purposes only and is neither a recommendation nor a piece of financial advice to purchase a stock.
If you find the information in this article helpful, please consider sharing it on social media and providing a link to this article from any website so that more articles like this can be created in the future.
Thank you!
