Bitcoin trading. Pixabay Image
Coinbase, the popular cryptocurrency exchange, debuted on the stock market on April 14th, 2021.
Since then, the company’s stock price has been a topic of interest for many investors.
With its unique position as one of the leading digital asset exchanges and its recent surge in popularity, Coinbase has garnered much attention in the financial world.
As the crypto market grows, many are curious about Coinbase’s valuation and how it compares to other companies in the industry.
In this context, it’s worth examining Coinbase’s stock price and valuation to understand its potential and how it may impact the broader financial landscape.
This article explores Coinbase’s market cap, stock valuation, valuation vs peers, and price target.
Let’s get started.
Please use the table of contents to navigate this page.
Table Of Contents
Market Cap
Share Price Vs Fair Value
A1. Share Price Based On Discounted Cash Flow
Historical Valuation
B1. Price To Sales Ratio
B2. Price To Earnings Ratio
B3. Price To Book Ratio
Valuation Vs Peers
C1. PS Ratio Vs Peers
C2. PE Ratio Vs Peers
Valuation Vs Industry
D1. PS Ratio Vs Industry
D2. PE Ratio Vs Industry
Analyst Forecast
E1. Share Price Vs Price Target
Conclusion And Reference
S1. Conclusion
S2. References and Credits
S3. Disclosure
Market Capitalization
Coinbase-market-capitalization
(click image to expand)
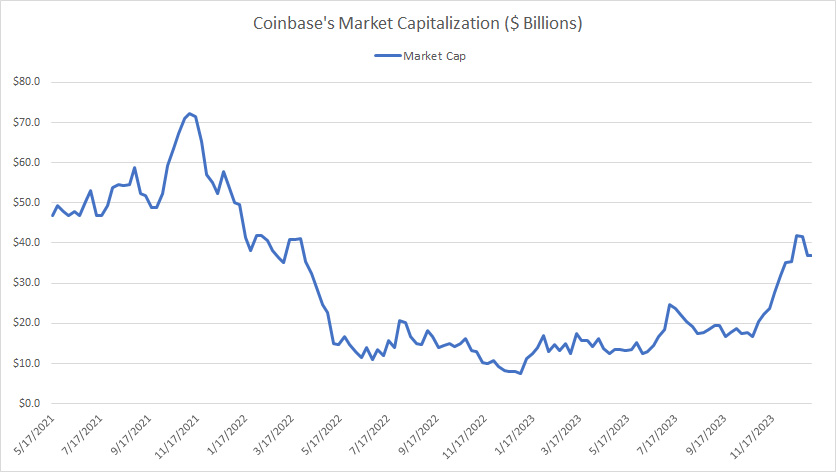
Coinbase’s market cap exceeded US$70 billion during 2021.
However, its market cap plunged below US$10 billion in mid-2022 when the crypto routs occurred, primarily driven by the bankruptcy and liquidation of several crypto exchanges.
Coinbase’s market cap has significantly recovered since the end of 2023, reaching nearly US$40 billion as of Jan 2024.
Share Price Based On Discounted Cash Flow
Coinbase-share-price-based-on-discounted-cash-flow
(click image to expand)
* Data comes from Simpy Wall St.
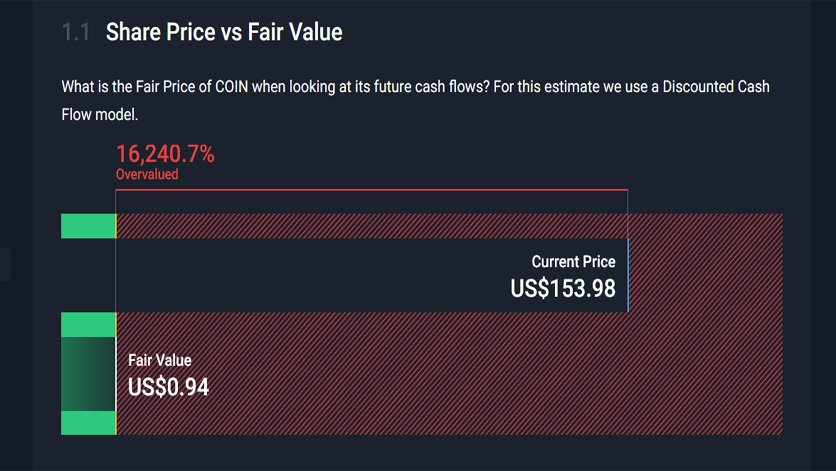
Coin’s share price was traded at US$154 as of Jan 2024.
Coin’s share price of US$154 was significantly overvalued by 16,240%, according to Simply Wall St, based on the fair value estimated by the discounted cash flow model.
My best guess for Coinbase’s fair value of US$0.94 was that the company generates poor cash flow as seen in this article: Coinbase Cash Flow Problem.
Price To Sales Ratio
Coinbase’s price-to-sales ratio as of Jan 2024.
| Date | Trailing Price To Sales Ratio |
|---|---|
| 1/6/2024 | 14.0X |
| 2023 | 6.3X |
| 2022 | 3.3X |
| 2021 | 8.6X |
| Average | 6.5X |
Coinbase was valued at 14.0X its trailing 12-month (TTM) revenue as of Jan 2024.
On average, Coinbase’s price-to-sales ratio was 6.5X between 2021 and 2024.
In 2022, Coinbase’s valuation tumbled significantly as the price-to-sales ratio was only 3.3X, driven primarily by the crypto rout caused by the bankruptcy and liquidation of several crypto exchanges.
Coinbase’s rising PS ratio in 2024 reflects a robust crypto market recovery and contributes to the company’s growing valuation.
Price To Earnings Ratio
Coinbase’s price-to-earnings ratio as of Jan 2024.
| Date | Trailing Price To Earnings Ratio |
|---|---|
| 1/6/2024 | -50.1X |
| 2023 | -14.7X |
| 2022 | -9.6X |
| 2021 | 21.9X |
| Average | -6.1X |
Coinbase’s price-to-earnings ratio, or PE ratio, was -50.1X as of Jan 2024.
Coinbase’s price-to-earnings ratio averaged -6.1X between 2021 and 2024.
Coinbase’s negative PE ratio indicates that the company is not profitable from a GAAP perspective in most periods.
Price To Book Ratio
Coinbase’s price-to-book ratio as of Jan 2024.
| Date | Trailing Price To Book Ratio |
|---|---|
| 1/6/2024 | 6.2X |
| 2023 | 2.9X |
| 2022 | 3.1X |
| 2021 | 9.6X |
| Average | 4.5X |
Coinbase’s stocks were traded at a price-to-book ratio of 6.2X as of Jan 2024, up significantly from the ratio in 2023.
On average, Coinbase’s price-to-book ratio was 4.5X between 2021 and 2024.
Coinbase’s rising price-to-book ratio in 2024 reflects a growing valuation for the company, in line with the recovery in the crypto market.
PS Ratio Vs Peers
Coinbase-price-to-sales-ratio-vs-peers
(click image to expand)
* Data comes from Simpy Wall St.
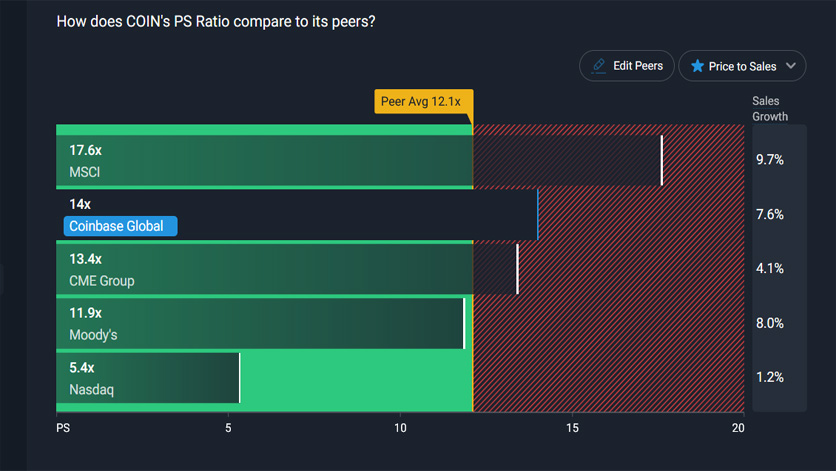
Coinbase’s price-to-sales ratio of 14X puts the company’s valuation slightly on the high side compared to its peers.
Among all companies in comparison, MSCI commands the highest price-to-sales ratio, probably due to the higher projected sales growth of 9.7%.
On the other hand, Coinbase’s forecasted sales growth came in at only 7.6%, while the figures for CME Group, Moody’s, and Nasdaq were 4.1%, 8.0%, and 1.2%, respectively.
PE Ratio Vs Peers
Coinbase-price-to-earnings-ratio-vs-peers
(click image to expand)
* Data comes from Simpy Wall St.
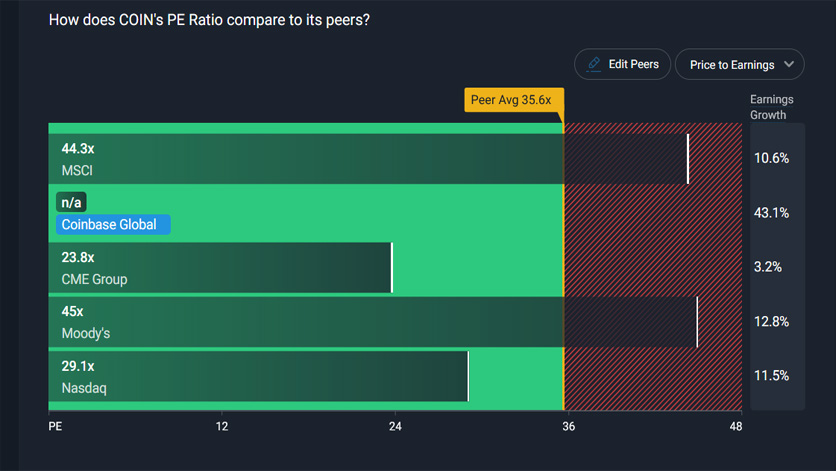
Although Coinbase’s PE ratio was negative at -50X, its projected earnings growth was among the highest at 43% compared to peers.
On the other hand, the forecasted earnings growth for MSCI, CME Group, Moody’s, and Nasdaq was 10.6%, 3.2%, 12.8%, and 11.5%, respectively, which was much lower than Coinbase’s.
PS Ratio Vs Industry
Coinbase’s PS ratio vs the U.S. Capital Market industry as of Jan 2024.
| Companies | PS Ratio | Sales Growth | Market Cap |
|---|---|---|---|
| Industry Average | 3.0X | – | – |
| Coinbase Global | 14.0X | 7.6% | US$36.8b |
| MSCI | 17.6X | 9.7% | US$42.6b |
| Tradeweb Markets | 15.6X | 10.4% | US$21.8b |
| MarketAxess Holdings | 14.3X | 9.9% | US$10.5b |
| Tokens.com | 14.0X | 3.6% | US$14.0m |
| CME Group | 13.4X | 4.1% | US$71.1b |
| Moody’s | 11.9X | 8.0% | US$68.0b |
| S&P Global | 11.0X | 6.7% | US$135.5b |
| Blackstone | 10.5X | 27.3% | US$143.0b |
* Data comes from Simpy Wall St.
Against the U.S. Capital Markets industry, Coinbase’s valuation of 14.0X to revenue or sales was much higher than the industry average of just 3.0X.
Companies operating in the same industry that roughly have the same valuation as Coinbase are MarketAxess Holdings, Tokens.com, and CME Group.
This group of companies also has projected revenue growth similar to that of Coinbase Global.
PE Ratio Vs Industry
Coinbase’s PE ratio vs the U.S. Capital Market industry as of Jan 2024.
| Companies | PE Ratio | Earnings Growth | Market Cap |
|---|---|---|---|
| Industry Average | 27.1X | – | – |
| Coinbase Global | – | 43.1% | US$36.8b |
| S&P Global | 54.7X | 16.5% | US$135.5b |
| Tradeweb Markets | 54.1X | 16.3% | US$21.8b |
| Blackstone | 48.3X | 23.5% | US$143.0b |
| Moody’s | 45.0X | 12.8% | US$68.0b |
| MSCI | 44.3X | 10.6% | US$42.6b |
| MarketAxess Holdings | 42.3X | 12.0% | US$10.5b |
| CME Group | 23.8X | 3.2% | US$71.1b |
| Tokens.com | – | – | US$14.0m |
* Data comes from Simpy Wall St.
The average PE ratio for the U.S. Capital Market was around 27.1X compared to the negative PE ratio of Coinbase.
Coinbase is unprofitable, as reflected in the negative PE ratio, while most of its peers in the industry are profitable.
However, the projected earnings or profit growth for Coinbase was 43.1%, the highest among all companies in comparison.
Share Price Vs Price Target
Analyst price target for Coinbase Global (COIN) as of Jan 2024.
| Types Of Share Price | Dates | ||
|---|---|---|---|
| Jan 2025 | Jan 2024 | Jan 2023 | |
| Average 1-Yr Price Target | US$107.6 | US$71.1 | US$380.1 |
| Potential Upside At The Time Of Forecasting | -30.1% | +101.0% | +50.6% |
| 1-Year Actual Share Price | NA | US$173.9 | US$35.4 |
| Actual Share Price At The Time Of Forecasting | US$154.0 | US$35.4 | US$252.4 |
| Number Of Analysts | 22 | 24 | 16 |
| Analysts’ Highs | US$200.0 | US$155.0 | US$500.0 |
| Analysts’ Lows | US$50.0 | US$30.0 | US$225.0 |
* Data comes from Simpy Wall St.
Coinbase’s share price is projected to hit US$107.6 on average by Jan 2025, according to 22 analysts.
However, Coinbase’s share price has already hit US$154 as of Jan 2024.
Has Coinbase’s share price risen too fast and too much in 2024?
Although Coinbase’s share price was traded at US$154, there was a potential upside, considering that some analysts estimated the stock to be valued at US$200 by Jan 2025, giving it a gain of 30%.
Conclusion
Coinbase Global is a cryptocurrency exchange platform that went public in April 2021. The company’s stock, trading under the COIN ticker, has seen significant volatility since its debut.
As of Jan 2024, Coinbase Global’s stock valuation was approximately $40 billion. Between 2021 and 2024, Coinbase’s market cap has declined by about 40%.
Several factors have contributed to Coinbase’s fluctuating valuation, including changes in the overall cryptocurrency market, regulatory developments, and financial performance.
Analysts have issued various price targets for Coinbase Global’s stock. Some bullish analysts have set price targets as high as $200, while more cautious analysts have set targets closer to $50 as of Jan 2024.
Overall, the consensus among analysts is that Coinbase Global’s stock has significant potential for growth but also carries substantial risks due to the volatility of the cryptocurrency market and uncertainties surrounding regulation.
As with any investment, it is essential for investors to carefully consider their own risk tolerance and investment goals before deciding to invest in Coinbase or any other stock.
References and Credits
1. All financial figures presented in this article were obtained and referenced from Yahoo Finance and Simply Wall St, which can be accessed at these links: Yahoo Finance and Simply Wall St – Coin Valuation.
2. Pixabay Images.
Disclosure
References and examples such as tables, charts, and diagrams are constantly reviewed to avoid errors, but we cannot warrant the total correctness of all content.
The content in this article is for informational purposes only and is neither a recommendation nor a piece of financial advice to purchase a stock.
If you find the information in this article helpful, please consider sharing it on social media and provide a link to this article from any website so that more articles like this can be created.
Thank you!
