Crypto asset. Pixabay image.
This article presents the revenue and revenue breakdown of Coinbase Global, Inc. (NASDAQ: COIN). In addition to revenue, we also explore Coinbase’s profit margin.
For your information, Coinbase provides a safe and easy-to-use technology and a financial platform to enable anyone on earth with an internet connection to discover, trade, and engage with crypto assets and decentralized applications.
Crypto assets are primarily digital assets built using blockchain technology, including cryptocurrencies, stablecoins, and security tokens. Decentralized applications run on a decentralized network, typically using blockchain technology.
Investors interested in Coinbase’s trading volume statistics may find more information on this page: Coinbase trading volume by segment and by crypto asset.
Let’s get started!
Please use the table of contents to navigate this page.
Table Of Contents
Definitions And Overview
O2. Coinbase Revenue Overview
O3. How Does Coinbase Work
O4. How Does Coinbase Make Money
Consolidated Revenue
B1. Revenue By Year
B2. Revenue By Quarter
B3. Revenue By TTM
Revenue Growth
B4. Growth Rates Of Revenue By TTM
Profitability And Margins
C1. Operating Income, Net Income And Adjusted EBITDA
C2. Operating Margin, Net Margin And Adjusted EBITDA Margin
Revenue By Region/Country
D1. The United States And Rest Of World Revenue
D2. The United States And Rest Of World Revenue In Percentage
D3. Growth Rates Of The United States And Rest Of World Revenue
Revenue By Segment
E1. Transaction And Subscription Revenue
E2. Transaction And Subscription Revenue In Percentage
E3. Growth Rates Of Transaction And Subscription Revenue
Transaction Revenue By User Type
F1. Consumer And Institutional Users Revenue
F2. Consumer And Institutional Users Revenue In Percentage
Transaction Revenue By Crypto Asset
F3. Bitcoin, Ethereum And Other Crypto Assets Revenue
F4. Bitcoin, Ethereum And Other Crypto Assets Revenue In Percentage
Subscription And Services Revenue By Category
G1. Stablecoin Revenue, Blockchain Rewards, Custodial Fees, And Interest Income
G2. Stablecoin Revenue, Blockchain Rewards, Custodial Fees, And Interest Income In Percentage
Other Revenue By Category
H1. Crypto Assets Sales Revenue And Corporate Interest Income
H2. Crypto Assets Sales Revenue And Corporate Interest Income In Percentage
Conclusion And Reference
S1. Conclusion
S2. References and Credits
S3. Disclosure
Definitions
To help readers understand the content better, the following terms and glossaries have been provided.
Stablecoins: Stablecoins are a type of cryptocurrency designed to maintain a stable value relative to a particular asset or basket of assets, such as the US dollar, gold, or other cryptocurrencies.
Unlike other cryptocurrencies like Bitcoin, which can be highly volatile and subject to large price fluctuations, stablecoins aim to provide users with a more stable and predictable store of value. This makes them well-suited for use as a medium of exchange and for other financial applications like lending, borrowing, and trading.
There are several types of stablecoins, including fiat-backed, commodity-backed, and algorithmic stablecoins, each with unique features and characteristics.
Adjusted EBITDA: Coinbase defines the adjusted EBITDA as net loss or income, adjusted to exclude the following items:
1. provision for or benefit from income taxes,
2. interest expense,
3. depreciation and amortization,
4. stock-based compensation expense,
5. impairment expense,
6. non-recurring accrued legal contingencies, settlements, and related costs,
7. nonrecurring Direct Listing expenses, impairment on crypto assets still held, net,
8. restructuring,
9. fair value gain or loss on derivatives,
10. crypto asset borrowing costs,
11. gain on extinguishment of long-term debt, net,
12. loss or gain on investments, net,
13. unrealized foreign exchange gain or loss, and
14. other adjustments, net.
Crypto Assets Sales: According to Coinbase, crypto asset sales are periodic sales of the company’s own crypto assets.
The purpose of these sales is to fulfill customer accommodation transactions for orders that do not meet the minimum trade size for execution on Coinbase’s platform OR to maintain customers’ trade execution and processing times during unanticipated system disruptions.
For your information, Coinbase has custody and control of these crypto assets before the sale to the customer and records revenue at the point in time when the sale is processed.
Coinbase Revenue Overview
Coinbase-revenue-overview
(click image to expand)
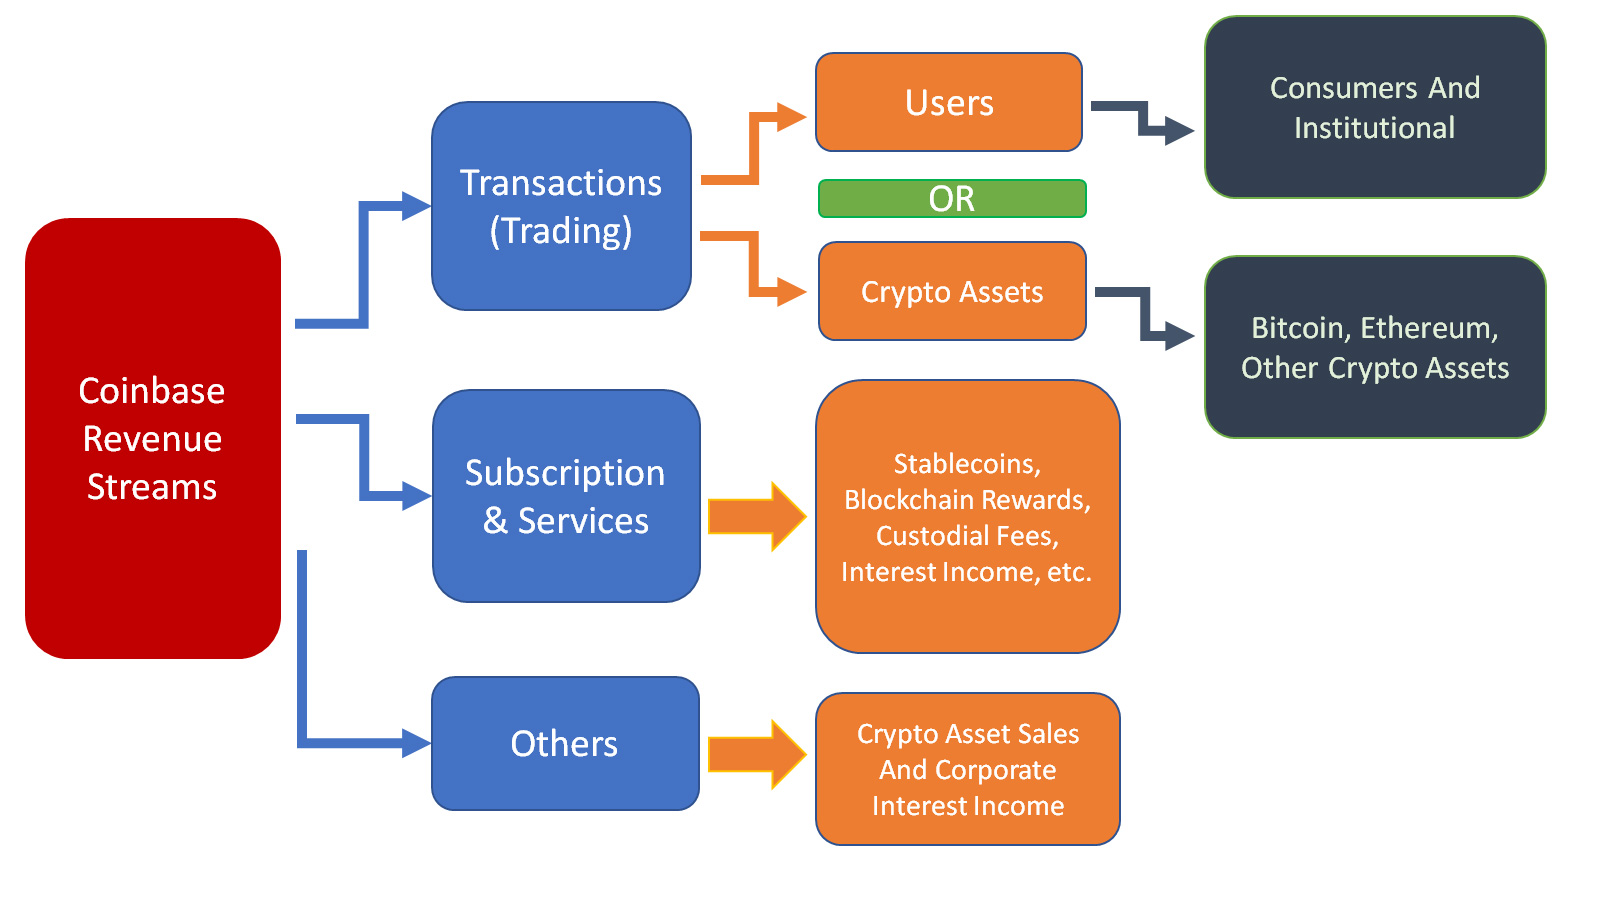
Coinbase’s revenue streams comprise transactions, subscription and services, and others.
Transaction or trading revenue can be categorized by users such as retail and institutional or by crypto assets such as bitcoin, Ethereum, and other crypto assets.
Coinbase’s subscription and services revenue consists of stablecoins, blockchain rewards, custodial fees, interest income, etc.
Coinbase’s other revenue includes sales of crypto assets and corporate interest income.
How Does Coinbase Work
Coinbase is a cryptocurrency exchange platform allowing users to buy, sell, and store digital currencies such as Bitcoin, Ethereum, and Litecoin. To start using Coinbase, you must first create an account by signing up on their website or downloading their mobile app. Once you have signed up, you can link your bank account or credit card to your Coinbase account, allowing you to buy and sell cryptocurrencies.
When you buy a cryptocurrency on Coinbase, the platform will hold it in a digital wallet. You can access your wallet on the platform or transfer your cryptocurrency to another wallet address. Coinbase also provides various security measures to ensure the safety of your digital assets, including two-factor authentication and insurance coverage for any losses due to security breaches.
Additionally, Coinbase has a user-friendly interface and provides educational resources for beginners to learn more about cryptocurrencies. The platform charges fees for transactions and conversions, but the fees are competitive with other cryptocurrency exchanges.
How Does Coinbase Make Money
Coinbase generates its revenue primarily from two sources: transaction fees and subscription/services revenue. Transaction fees are generated from trading on Coinbase’s platforms, which refer to the company’s website and app. The transaction revenue is highly dependent on the price and quantity of assets being traded, and it’s recognized as soon as the transaction is completed.
Subscription and service revenue consists of several sources, including blockchain rewards, custodial fees, and interest income. Blockchain rewards are earned by participating in activities on the blockchain, while custodial fees are made by securing customer crypto assets in dedicated cold storage.
Coinbase also earns interest income on fiat money under a revenue-sharing agreement with the issuer of USD Coin (USDC) and on loans issued to consumers and institutional users. Additionally, Coinbase makes money off customer custodial funds and cash held at certain third-party banks that provide interest.
Revenue By Year
Coinbase-total-revenue-by-year
(click image to expand)
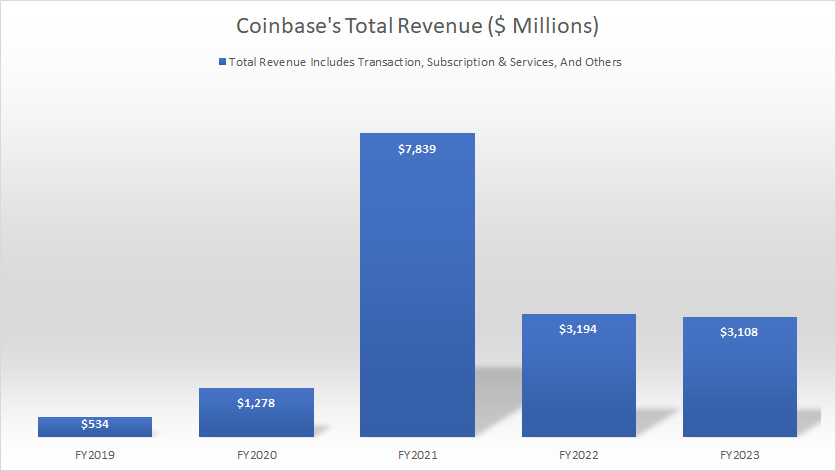
On a consolidated basis, Coinbase’s total revenue hit US$3.1 billion as of fiscal 2023, down slightly from US$3.2 billion in 2022 but significantly from the record figure of US$7.8 billion in 2021.
Although revenue was cut by more than half from 2021, it still increased by over 138% from 2020.
Revenue By Quarter
Coinbase-total-revenue-by-quarter
(click image to expand)
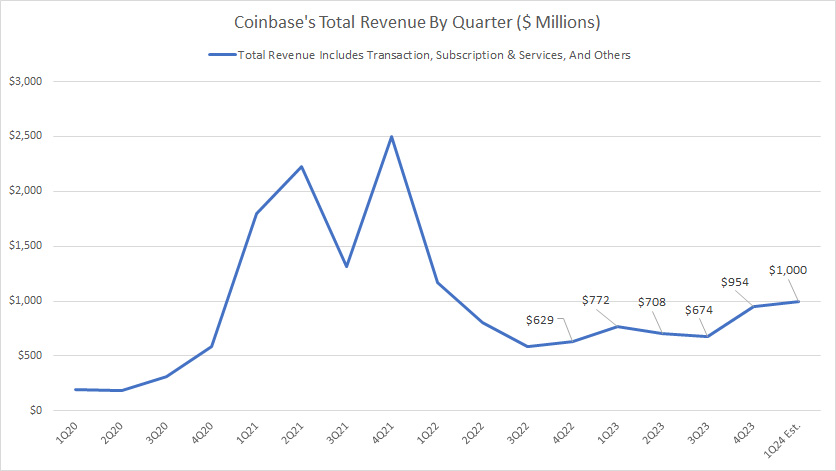
Coinbase earned US$954 million, US$674 million, and US$708 million in quarterly revenue in 4Q, 3Q, and 2Q 2023, respectively. Coinbase guided for significant revenue growth in 1Q 2024, potentially exceeding US$1 billion.
Revenue By TTM
Coinbase-total-revenue-by-ttm
(click image to expand)
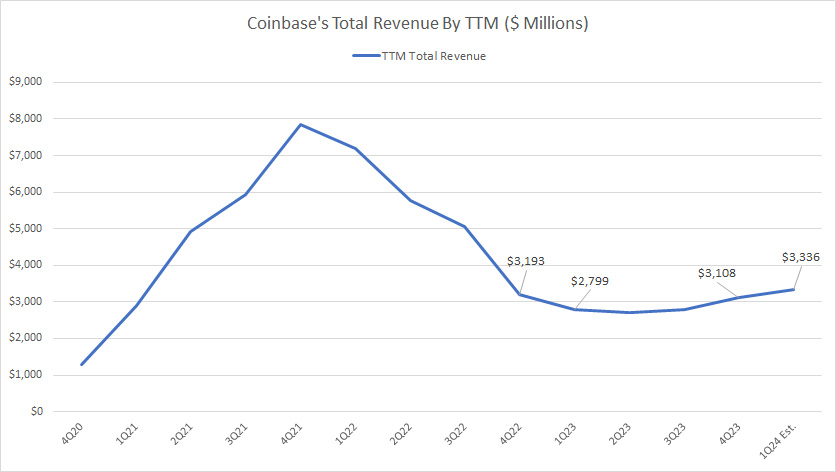
The TTM plot presented in the chart above shows that Coinbase’s total revenue has steadily recovered since 2023, totaling over US$3.1 billion in fiscal 4Q 2023.
By 1Q 2024, Coinbase’s TTM revenue may hit US$3.3 billion based on the guidance provided, up 18% from a year ago.
Although revenue has recovered, it is still significantly below pre-pandemic levels.
Growth Rates Of Revenue By TTM
Coinbase-growth-rates-of-total-revenue-by-ttm
(click image to expand)
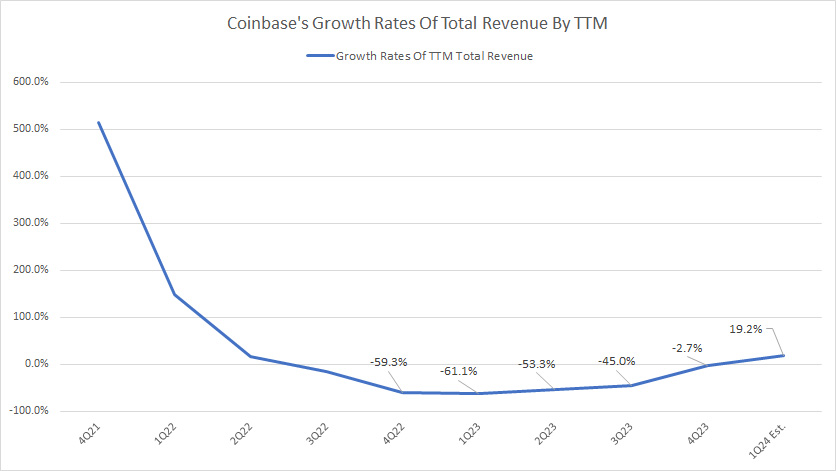
As presented in the plot above, Coinbase’s revenue growth has considerably slowed in post-pandemic periods but has shown signs of a recovery.
As seen, the YoY growth rates have significantly improved since 2023. As of 4Q 2023, Coinbase’s revenue decline narrowed to 2.7% compared to a decline of 59% a year ago.
Going to 1Q 2024, Coinbase’s revenue is expected to climb by 19% from a year ago, a record growth rate since 2022.
Operating Income, Net Income And Adjusted EBITDA
Coinbase-profitability
(click image to expand)
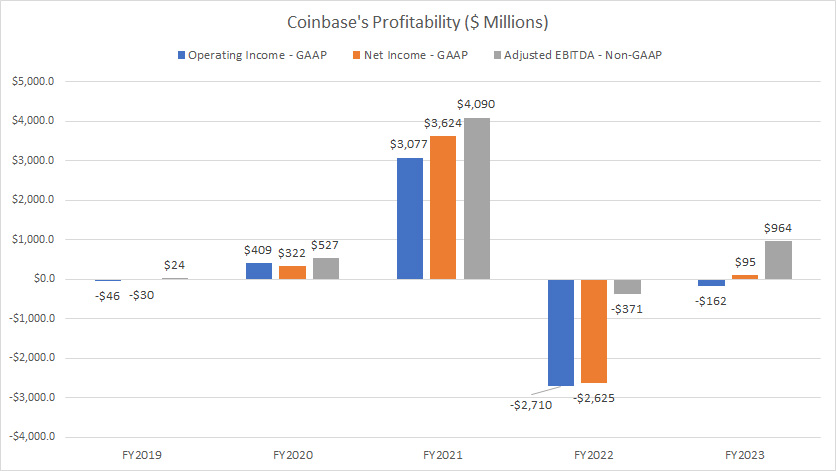
Coinbase was highly profitable between 2020 and 2021 during the pandemic, with operating income reaching $3 billion in 2021 while the adjusted EBITDA exceeded $4 billion. The definition of Coinbase’s adjusted EBITDA is available here: adjusted EBITDA.
However, Coinbase suffered considerable losses in 2022 when the net loss totaled $2.6 billion while operating loss exceeded $2.7 billion. In 2023, Coinbase’s losses were significantly narrowed when operating loss was reduced to $162 million while net income came in at $95 million.
Coinbase significantly recovered in 2023 when it generated an adjusted EBITDA of $964 million, a record profit since 2022.
Operating Margin, Net Margin And Adjusted EBITDA Margin
Coinbase-margins
(click image to expand)
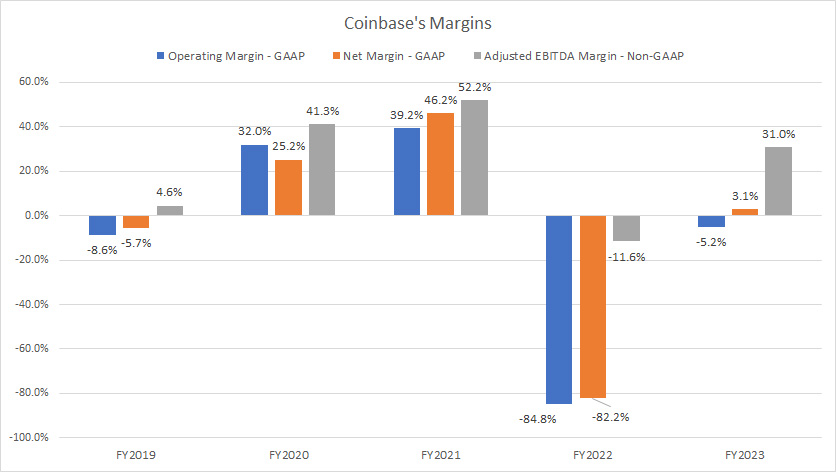
Similarly, Coinbase’s margins plummeted in fiscal 2022, underscoring the company’s record losses. The definition of Coinbase’s adjusted EBITDA is available here: adjusted EBITDA.
As seen, Coinbase’s operating margin in fiscal 2022 was down to -85%, while the net profit margin declined to -82%. The formidable adjusted EBITDA margin was not spared and fell to -11.6%.
In 2023, Coinbase’s profit margins recovered significantly, with the adjusted EBITDA margin climbing the most, reaching 31%. In the same fiscal year, Coinbase’s operating margin improved to -5.2% while the net profit margin reversed from a loss to a positive figure of 3.1%.
The United States And Rest Of World Revenue
Coinbase-U.S.-and-rest-of-world-revenue
(click image to expand)
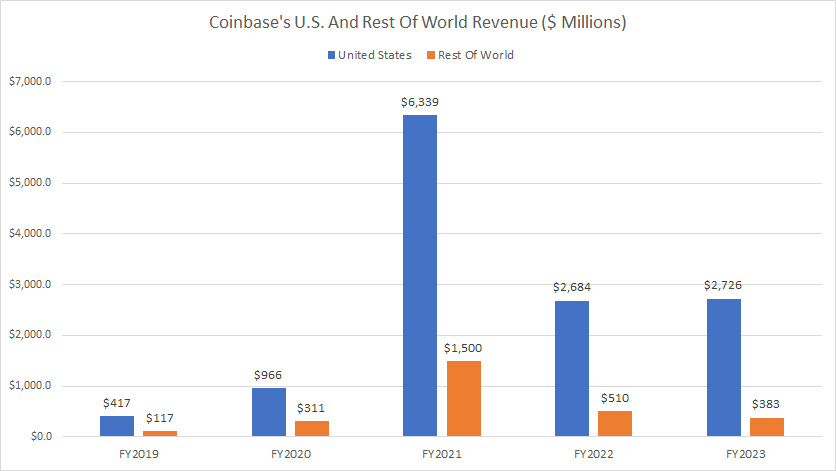
Coinbase gets a significantly massive portion of its revenue in the U.S., notably at $2.7 billion in fiscal 2023 and 2022, respectively.
On the other hand, Coinbase’s revenue streams from the rest of world totaled only $383 million and $510 million in fiscal 2023 and 2022, respectively, a much lower portion compared to revenue from the U.S.
While the revenue in the U.S. and the rest of world declined considerably in fiscal 2023 from previous highs, they were still up long-term, remarkably at more than 500% and 300% for the U.S. and the rest of world, respectively, from 2019.
The United States And Rest Of World Revenue In Percentage
Coinbase-U.S.-and-rest-of-world-revenue-in-percentage
(click image to expand)
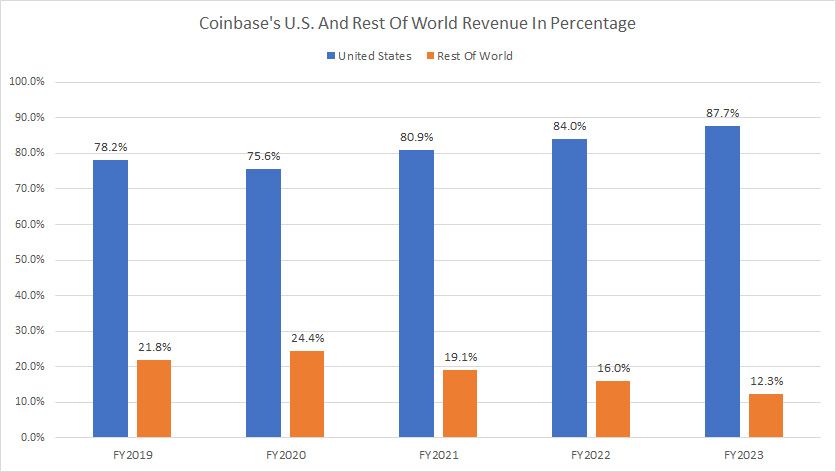
Coinbase earned nearly 88% of its revenue in the U.S. as of fiscal year 2023, and this ratio has significantly risen since fiscal year 2019.
On the other hand, Coinbase’s revenue streams from the rest of world accounted for only 12% of the company’s total revenue as of fiscal 2023, down significantly from 21.8% in 2019.
In short, Coinbase relies more heavily on revenue from the United States than the rest of the world.
Growth Rates Of The United States And Rest Of World Revenue
Coinbase-growth-rates-of-U.S.-and-rest-of-world-revenue
(click image to expand)
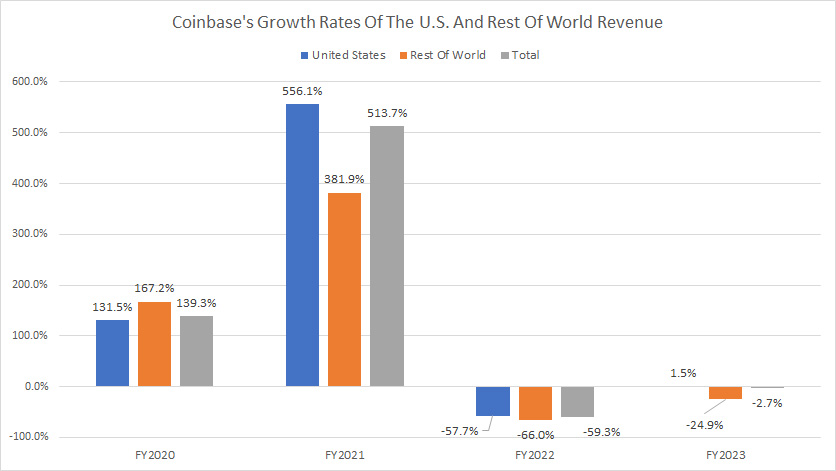
Coinbase’s revenue growth in the U.S. and other countries recovered significantly in fiscal year 2023 over 2022.
As seen, Coinbase’s revenue growth in the U.S. climbed 1.5% in 2023 compared to a decline of 58% in 2022. Similarly, Coinbase’s revenue decrease for the rest of world was reduced to 25% in 2023 compared to 66% in 2022.
Transaction And Subscription Revenue
Coinbase-transaction-and-subscription-revenue
(click image to expand)
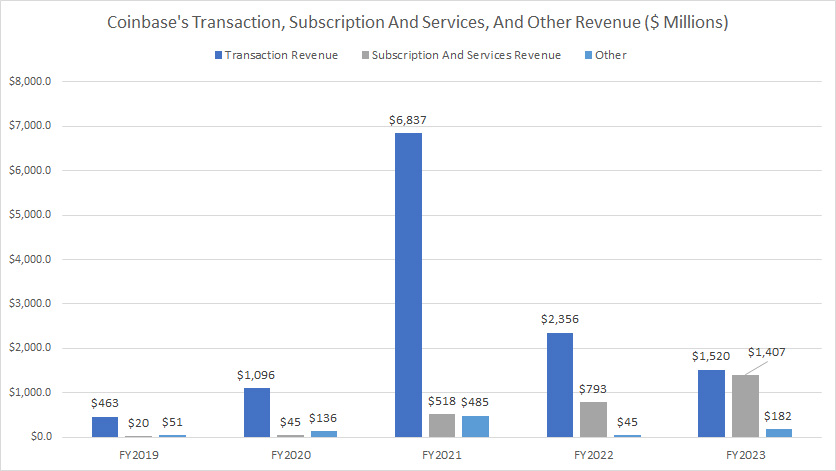
Coinbase earns the majority of its revenue from transactions in which trading fee is derived, as mentioned in the overview section: how Coinbase generates revenue.
Although transaction revenue represents the bulk of Coinbase’s sales, it has significantly declined since fiscal year 2021. It was down to $1.5 billion in 2023, roughly at the same level as subscription and services revenue.
On the other hand, Coinbase’s subscription and services revenue has significantly climbed since 2021, totaling over $1.4 billion as of 2023, nearly double the figure in 2022.
A noticeable trend is that subscription and services revenue has continued to rise, illustrating the resilience of this revenue segment in post-pandemic periods.
Transaction And Subscription Revenue In Percentage
Coinbase-transaction-and-subscription-revenue-in-percentage
(click image to expand)
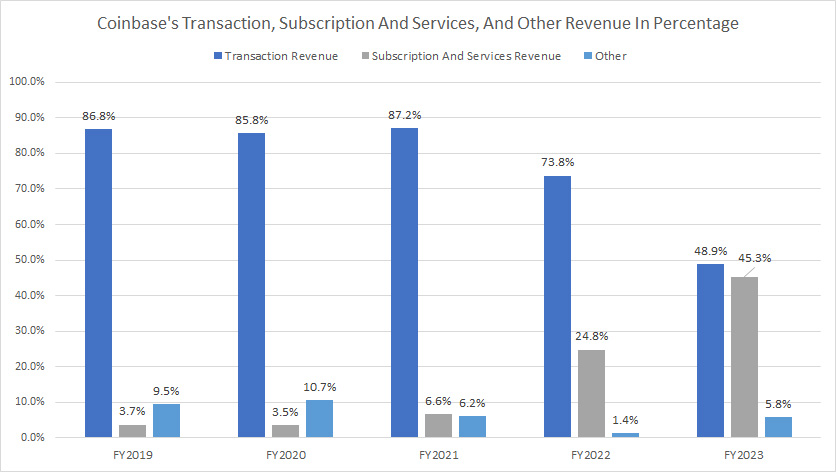
From the perspective of percentages, Coinbase’s transaction revenue accounted for 49% of the company’s total sales as of fiscal 2023. This figure has considerably decreased since 2019, from 87% to 49%.
In contrast, the percentage of Coinbase’s subscription and services revenue has continued to rise and accounted for 45% of its total revenue as of 2023, up significantly from 25% in 2022.
Growth Rates Of Transaction And Subscription Revenue
Coinbase-growth-rates-of-transaction-and-subscription-revenue
(click image to expand)
You can find the definition of Coinbase’s transaction and subscription revenue here: how Coinbase generates revenue.
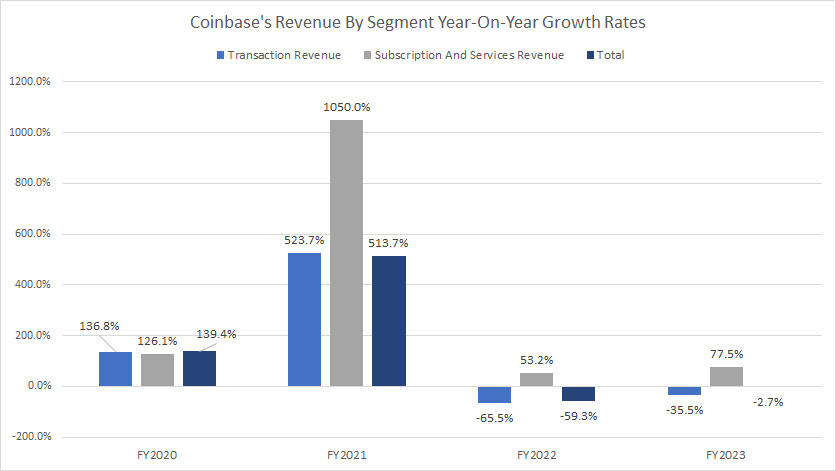
Coinbase’s revenue growth recovered considerably in fiscal year 2023 over 2022. However, the transaction revenue was still down by 35.5% in 2023.
On the other hand, Coinbase’s subscription and services revenue increased 77.5% in 2023 over 2022, a much better growth than 53% in 2022, and largely avoided the downturn seen in the trading segment.
Consumer And Institutional Users Revenue
Coinbase-transaction-revenue-by-user-type
(click image to expand)
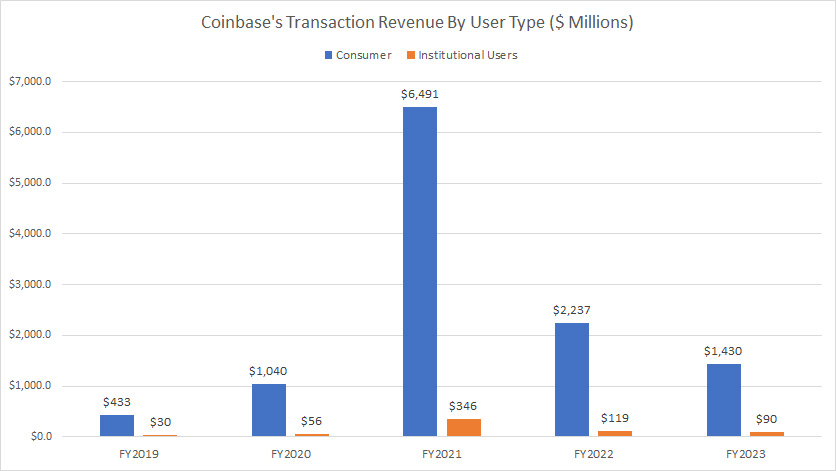
Coinbase’s transaction revenue can be further divided into consumers and institutional users.
Under the transaction segment, Coinbase earns the majority of sales from trading by consumers or retail users, totaling over $1.4 billion and $2.2 billion in fiscal 2023 and 2022, respectively. These figures were significantly down from $6.5 billion generated in 2021.
On the other hand, Coinbase’s revenue from transactions by institutional users accounts for only a minor portion, totaling just $90 million and $119 million in fiscal years 2023 and 2022, respectively. These figures were much lower than $346 million earned in 2021.
Consumer And Institutional Users Revenue In Percentage
Coinbase-transaction-revenue-further-breakdown-in-percentage
(click image to expand)
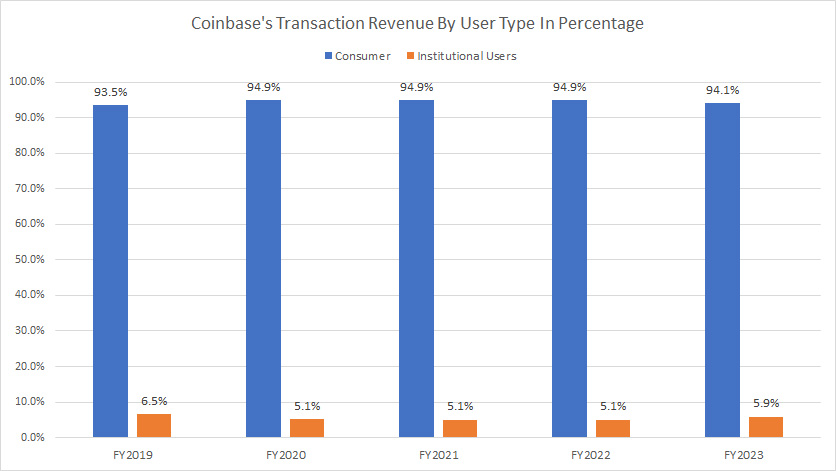
From the percentage perspective, Coinbase’s transaction revenue from consumer trading accounts for over 90% of the segment’s total revenue. This figure reached 94.1% in 2023, down slightly over 94.9% in 2022.
On the other hand, trading revenue by institutional users contributes to only 5% of its total revenue within the transaction segment. It reached 5.9% in 2023, up slightly from 5.1% in 2022.
Bitcoin, Ethereum And Other Crypto Assets Revenue
Coinbase-transaction-revenue-by-crypto-asset
(click image to expand)
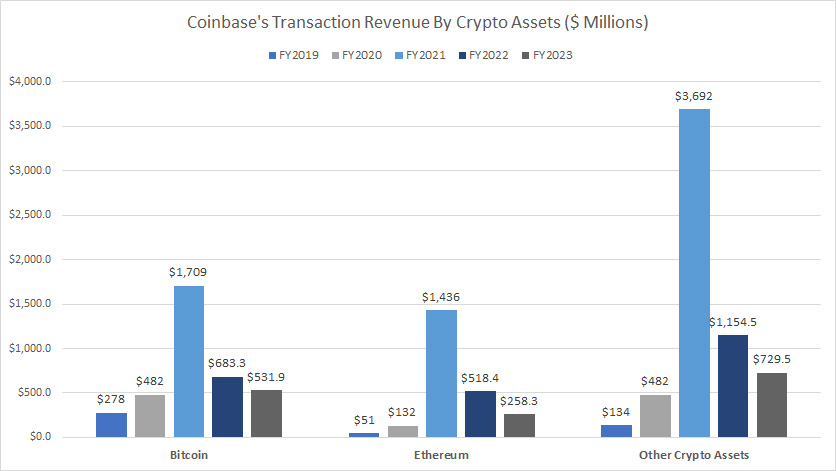
Coinbase’s transaction revenue can also be categorized by the type of crypto assets, ie, bitcoins, Ethereum, etc., as well as by retail and institutional users.
That said, Coinbase’s transaction revenue from other crypto assets forms the bulk of the segment revenue, totaling as much as $730 million and $1.2 billion in fiscal years 2023 and 2022, respectively.
Bitcoin contributed $532 million and $683 million in trading revenue in fiscal years 2023 and 2022, respectively. Ethereum contributed about $258 million and $518 million in transaction revenue in fiscal years 2023 and 2022, respectively.
A trend worth mentioning is the significant decrease in trading revenue for all crypto assets from fiscal year 2021 to fiscal year 2023.
Bitcoin, Ethereum And Other Crypto Assets Revenue In Percentage
Coinbase-transaction-revenue-by-crypto-asset-in-percentage
(click image to expand)
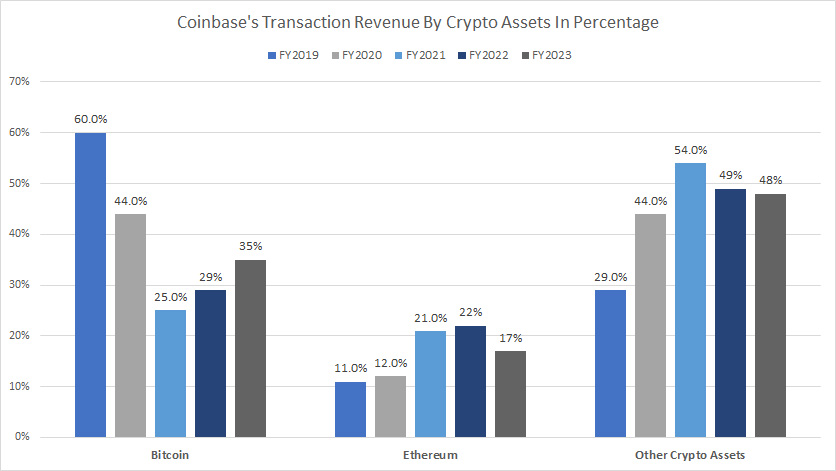
The transaction revenue from other crypto assets is roughly half of Coinbase’s total trading revenue. Its revenue share declined to 48% as of 2023 from 54% in 2021.
On the other hand, bitcoin accounts for about one-third of Coinbase’s transaction revenue. Its revenue share landed at 35% as of fiscal 2023, up significantly from 29% in 2022.
Ethereum contributes to roughly one-fifth of Coinbase’s total transaction revenue. Although the ratio was down to 17% in 2023, Ethereum’s revenue share has nearly doubled since fiscal 2019 and reached its peak at 22% in fiscal 2022.
Stablecoin Revenue, Blockchain Rewards, Custodial Fees, And Interest Income
Coinbase-subscription-and-services-revenue-further-breakdown
(click image to expand)
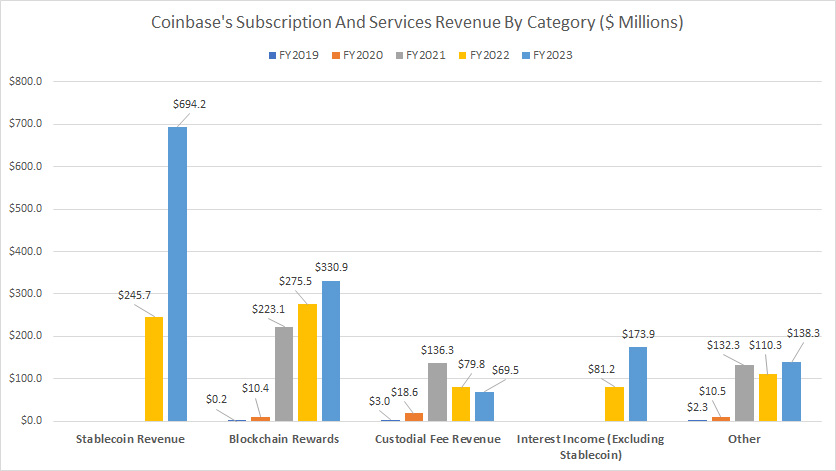
Within the subscription and services segment, Coinbase’s stablecoin revenue forms the largest portion, at $694 million and $256 million in fiscal years 2023 and 2022, respectively.
Blockchain rewards revenue, which totaled $331 million and $275 million in fiscal 2023 and 2022, respectively, constituted the company’s second-highest sales under the subscription and services segment.
With revenue coming at $70 million and $80 million in 2023 and 2022, Coinbase’s custodial fee revenue represented the smallest portion of sales within the subscription and services segment.
Interest income revenue (excluding stablecoins) reached a record figure of $174 million as of fiscal 2023, more than double that in 2022.
A noticeable trend in the subscription and services segment is the rising revenue in most categories between 2022 and 2023, with stablecoin revenue dominating the majority of the growth in this sector. The chart shows that it grew over 180% from $246 million in 2022 to $694 million in 2023.
Stablecoin Revenue, Blockchain Rewards, Custodial Fees, And Interest Income In Percentage
Coinbase-subscription-and-services-revenue-further-breakdown-in-percentage
(click image to expand)
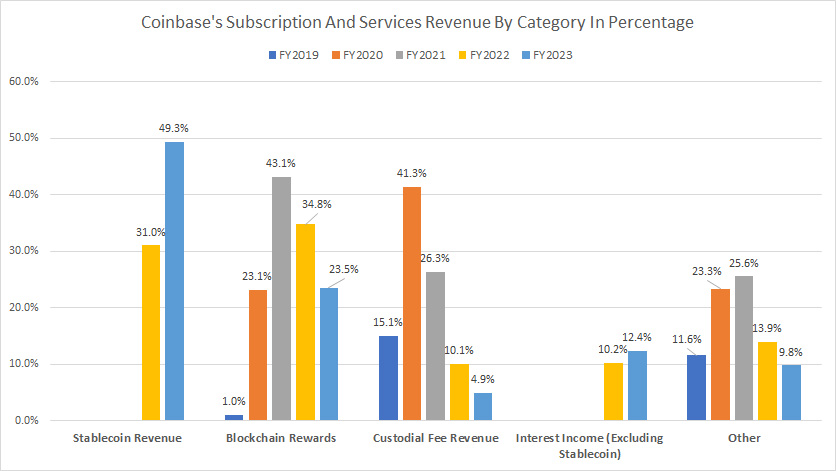
Coinbase’s stablecoins revenue accounted for almost half of the subscription and services revenue, with sales reaching 49% of the total in fiscal 2023, a significant rise from 31% in 2022.
The revenue share of blockchain rewards has decreased from 43% in 2021 to 23.5% as of 2023, while custodial fee revenue formed only 4.9% of the subscription and services revenue in 2023, down considerably from 41% in 2020.
Coinbase’s interest income contributed slightly over 10% of revenue in fiscal 2023 under the subscription and services segment.
Crypto Assets Sales Revenue And Corporate Interest Income
Coinbase-other-revenue-further-breakdown
(click image to expand)
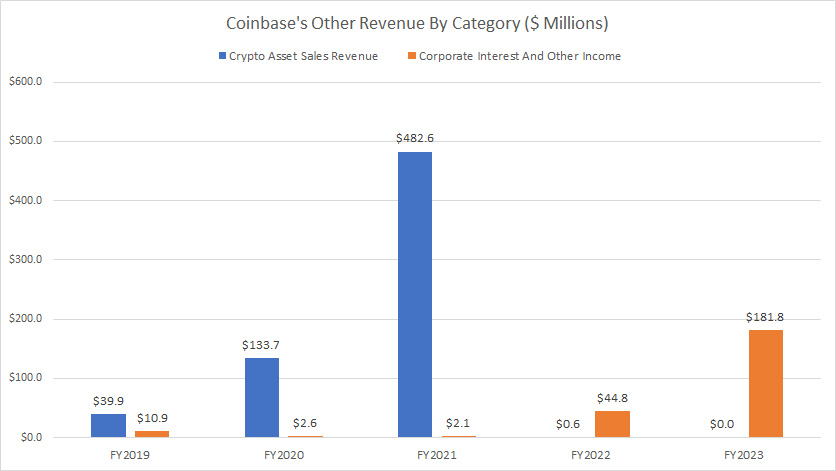
Coinbase’s other revenue consists of crypto assets sales and corporate interest income. According to Coinbase, crypto asset sales are periodic sales of the company’s own crypto assets. The definition of Coinbase’s crypto assets sales is available here: crypto assets sales.
For your information, Coinbase owns a significant amount of crypto assets, including Bitcoin and Ethereum, as shown in this article: Coinbase crypto investment and bitcoin holdings.
That being said, Coinbase’s crypto asset sales revenue totaled nearly $500 million in fiscal 2021 before plummeting to just $0.6 million in fiscal 2022. In fiscal 2023, Coinbase’s crypto asset sales revenue was nil, meaning that the company might not have performed any transaction related to the sales of its own crypto assets.
On the contrary, Coinbase generated a very small amount of corporate interest income. The revenue figure from corporate interest income was less than $5 million before 2022, but it surged to $182 million and $45 million in 2023 and 2022, respectively.
Crypto Assets Sales Revenue And Corporate Interest Income In Percentage
Coinbase-other-revenue-further-breakdown-in-percentage
(click image to expand)
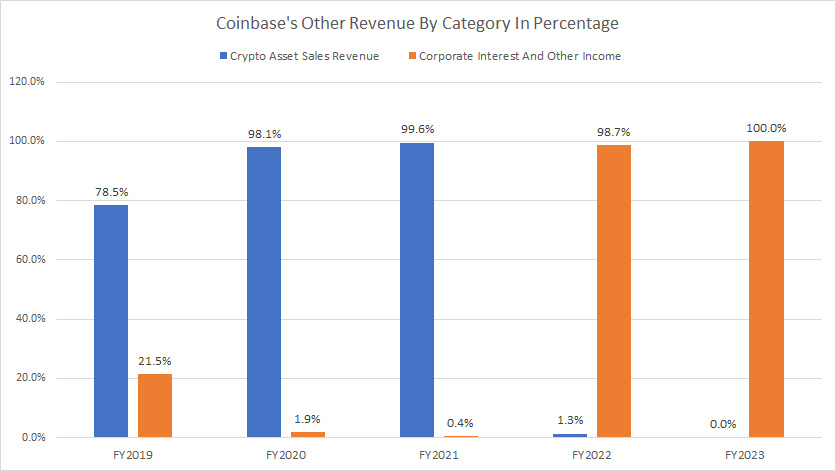
Coinbase’s crypto asset sales revenue accounted for nearly 100% of total revenue within the other revenue segment in fiscal 2021. The ratio plunged to 1.3% in 2022 and became nil in 2023.
On the other hand, Coinbase’s corporate interest income surged to 99% of the total other segment revenue in 2022. The ratio became 100% in 2023, underscoring the considerable rise of corporate interest income revenue.
Conclusion
In short, Coinbase’s revenue significantly slowed in fiscal 2022 but showed signs of recovery in 2023. Also, Coinbase guided significant revenue growth for 1Q 2024.
Will Coinbase’s recovery momentum continue in fiscal 2024 along with the prices of most crypto assets?
Please leave your comment below.
Credits and References
1. All financial figures presented in this article were obtained and referenced from Coinbase Global, Inc.’s SEC filings, earnings reports, financial statements, investor letters, news releases, shareholder presentations, webcast, etc., which are available in Coinbase Investor Relations.
2. Pixabay images.
Disclosure
References and examples such as tables, charts, and diagrams are constantly reviewed to avoid errors, but we cannot warrant the total correctness of all content.
The content in this article is for informational purposes only and is neither a recommendation nor a piece of financial advice to purchase a stock.
If you find the information in this article helpful, please consider sharing it on social media and providing a link to it from any website so that more articles like this can be created.
Thank you!

