GM vs Tesla. Flickr Image.
Tesla (NASDAQ: TSLA) and General Motors (NYSE: GM) are automakers with very large asset bases. In the financial statements, you will find that the total assets of both automaker consist of mostly long-term assets.
For example, in fiscal year 2023, Tesla’s ratio of long-term assets to total assets was 53% while GM’s ratio came in at 63%. Therefore, long-term assets are very important to these automakers. Both companies depend more on long-term assets to generate sales.
Due to the large asset bases, long-term assets in particular, you can see that Tesla and GM have fairly low asset turnover ratio, typically less than 1.0X. It is expected that they slowly turn over their assets through sales because of the large asset bases. In other words, both automakers are less efficient in making use of their assets.
This article explores the total assets and asset turnover ratios of Tesla and General Motors. We will find out how both companies perform in terms of assets turnover.
For your information, Tesla and GM operate through different business models. For example, Tesla sells its products on a retail basis while GM is on a wholesale basis. The expectation is that GM should have better asset turnover ratio compared to Tesla because it does not own those dealership stores.
Let’s take a look!
Investors interested in other statistics of both automakers may find more resources on these pages: Tesla accounts receivable, Tesla stock dilution, and Tesla versus GM in vehicle profit and margin.
Please use the table of contents to navigate this page.
Table Of Contents
Definitions And Overview
Consolidated Assets
A1. Total Assets
Growth Rates
Ratios
Conclusion And Reference
S1. Conclusion
S2. References and Credits
S3. Disclosure
Definitions
To help readers understand the content better, the following terms and glossaries have been provided.
Assets Turnover Ratio: The assets turnover ratio is a financial metric used to evaluate how efficiently a company uses its assets to generate revenue. It measures the amount of sales or revenue generated per dollar of assets.
The formula to calculate the assets turnover ratio is:
\[ Assets\ Turnover\ Ratio = \frac{Net\ Sales}{Average\ Total\ Assets} \]
Where:
Net Sales: This is the total revenue generated from sales of goods or services, excluding returns, allowances, and discounts.
Average Total Assets: This is the average value of the company’s assets over a specific period, typically calculated as the average of the beginning and ending total assets for the period.
A higher assets turnover ratio indicates that the company is effectively utilizing its assets to generate sales, whereas a lower ratio may suggest inefficiencies in asset use.
Total Assets
tesla-vs-gm-in-total-assets
(click image to expand)
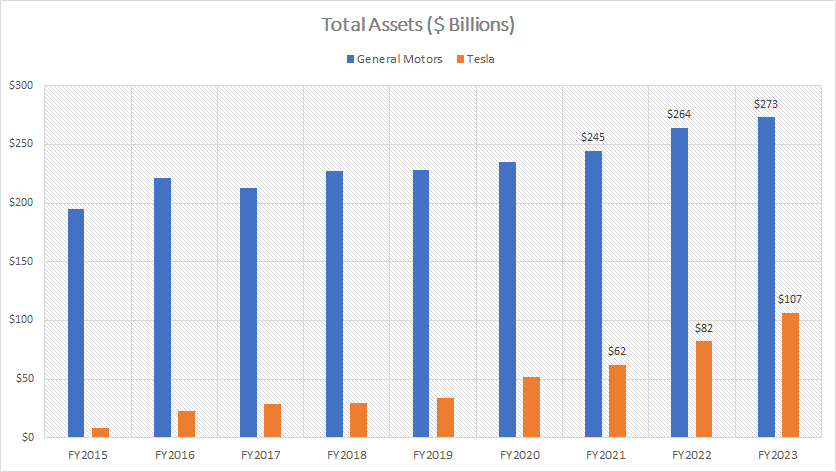
In terms of total assets, General Motors carries much higher total assets than Tesla, as shown in the chart above.
As of fiscal year 2023, General Motors’ total assets reached $273 billion while Tesla had only $107 billion in total assets. Therefore, Tesla’s total assets amounted to only about 40% of General Motors’ total assets in fiscal year 2023.
Although Tesla carries much fewer assets than GM, its asset values have increased much faster than GM. For example, since 2015, Tesla’s total assets have risen from $10 billion in 2015 to $107 billion as of 2023, representing an increase of over 10X in eight years.
Conversely, GM’s total assets have only grown by 36% since fiscal year 2015.
Total Assets Growth
tesla-vs-gm-in-total-assets-growth
(click image to expand)
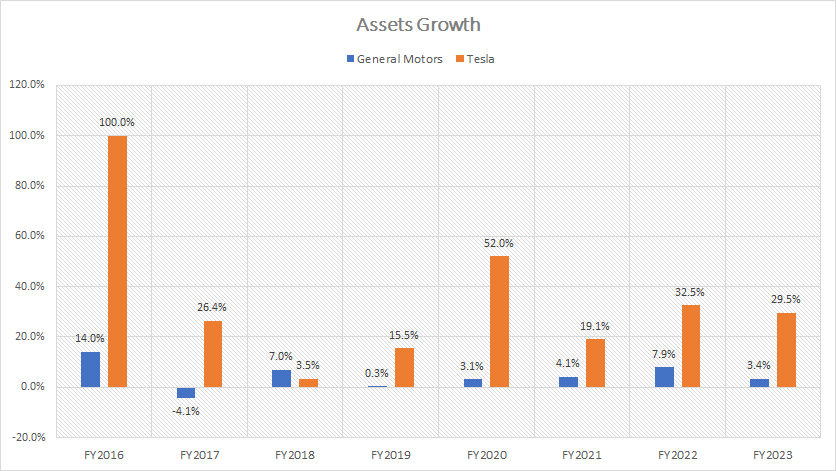
The chart above shows that Tesla’s total assets have much higher year-on-year growth rates than General Motors.
For example, Since 2019, Tesla’s total assets have grown at an average annual rate of approximately 30%. On the other hand, GM’s total assets have grown at only 4% per year since 2019, well below Tesla’s annual growth rate.
Assets Turnover Ratio
tesla-vs-gm-in-assets-turnover-ratio
(click image to expand)
The formula of assets turnover ratio is available here: assets turnover ratio.
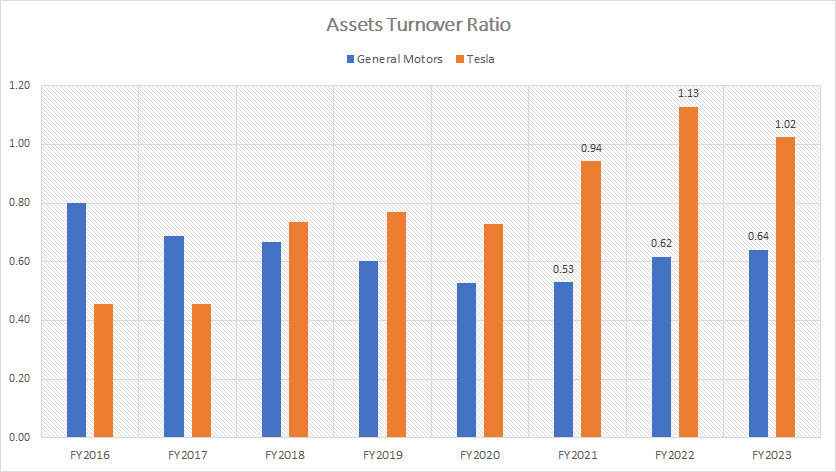
Although Tesla carries much fewer assets compared to General Motors, its assets turnover is much higher than GM, as shown in the chart above.
Tesla’s assets turnover ratio used to be less than General Motors. Since fiscal year 2018, Tesla’s assets turnover ratio has significantly soared, reaching 1.02X as of fiscal year 2023 versus GM’s assets turnover ratio of just 0.64X.
Therefore, Tesla turns over its assets at a faster rate than General Motors. For every dollar in assets, Tesla generated $1.02 in revenue, while GM generated $0.64.
Tesla generates much higher revenue per dollar of assets than GM. In other words, Tesla utilizes its assets more efficiently than GM.
Conclusion
In conclusion, GM has more assets than Tesla. GM’s total assets reached $273 billion as of fiscal year 2023, while Tesla’s figure was $107 billion.
However, Tesla turnover its assets much faster than General Motors. Tesla generates higher revenue per every dollar of assets than GM.
In short, Tesla utilizes its assets more efficiently than GM.
References and Credits
1. All financial figures presented in this article were obtained and referenced from the respective annual reports which are available in the following links: General Motors Investor Relations and Tesla Investor Relations.
2. Pixabay Images.
Disclosure
References and examples such as tables, charts, and diagrams are constantly reviewed to avoid errors, but we cannot warrant the full correctness of all content.
The content in this article is for informational purposes only and is neither a recommendation nor a piece of financial advice to purchase a stock.
If you find the information in this article helpful, please consider sharing it on social media and also provide a link back to this article from any website so that more articles like this one can be created in the future.
Thank you!


