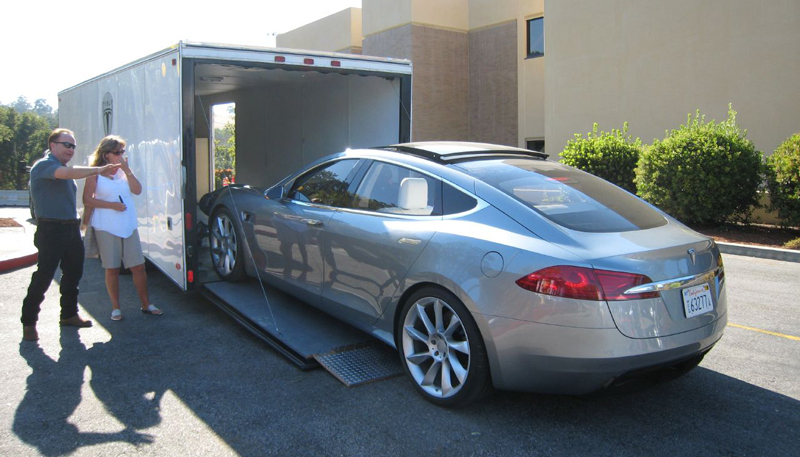
Tesla Model S new delivery. Source: Flickr
The assets owned by a company represent resources that generate future economic benefits for a company. That future economic benefits can be in the form of monetary benefits such as cash.
Other than producing cash, assets can also help to increase the value of a company. For example, Tesla has invested in bitcoin. When the prices of bitcoin increases, the stock price tends to follow.
In addition, Tesla also enjoys capital gain of its assets, although this may not be reflected in the balance sheets. Besides, some assets help to reduce the expenses of a company such as a piece of equipment that saves labor cost.
With that said, the assets of a company should not be overlooked. It’s no exception for Tesla (NASDAQ:TSLA). In fact, Tesla’s assets have become more important. Some assets help to gauge the growth of the automaker. For example, Tesla’s physical assets such buildings, lands, equipment, etc., should grow when the company expands.
All told, this article looks at Tesla’s total assets and the breakdown by individual assets.
Let’s get started.
Please use the table of contents to navigate this page.
Table Of Contents
Definitions And Overview
O2. How Does Tesla Grow Its Assets?
O3. What Does The Growth Of Tesla’s Total Assets Tell Us?
Consolidated Result
A1. Total Assets
Short-Term Assets
B1. Current Assets
Long-Term Assets
C1. Long-Term Assets
Breakdown Of Long-Term Assets
D1. Tangible Or Physical Assets
D2. Operating Lease Vehicles
D3. Solar Energy Systems
Summary And Reference
S1. Summary
S2. References and Credits
S3. Disclosure
Definitions
To help readers understand the content better, the following terms and glossaries have been provided.
Operating Lease Vehicles: The “Operating Lease Vehicles” asset on Tesla’s balance sheet refers to the value of vehicles that Tesla has leased to customers under operating lease agreements.
In these agreements, Tesla retains ownership of the vehicles while allowing customers to use them for a specified period in exchange for regular lease payments. This asset category captures the value of those leased vehicles that are still under the lease term and have not yet been returned to Tesla.
The valuation typically considers the original cost of the vehicles, less any accumulated depreciation. This asset is crucial for Tesla as it represents a significant portion of the company’s revenue from its leasing operations.
Solar Energy Systems: Tesla’s Solar Energy Systems assets typically refer to the solar energy products and systems that the company has installed or leased to customers, as well as those held in inventory for future installations.
These assets are part of Tesla’s energy generation and storage segment. The key components can include:
1. **Solar Panels and Solar Roof Tiles**: These physical products capture sunlight and convert it into electricity. Tesla’s innovative solar roof tiles, in particular, double as both roofing material and solar energy generators.
2. **Solar Energy Systems in Leases and Power Purchase Agreements (PPAs)**: For customers who choose not to purchase the solar energy systems outright, Tesla offers options to lease the equipment or to enter into PPAs, where customers agree to purchase the power generated by the system at a predetermined rate. The value of these systems, expected to generate future income through lease payments or PPAs, is recognized as an asset.
3. **Energy Storage Products**: This includes Tesla’s Powerwall, Powerpack, and Megapack batteries that store energy generated from solar panels. These storage solutions are crucial for ensuring the availability of electricity generated from solar power even when the sun isn’t shining.
The valuation and classification of these assets in the balance sheet are subject to accounting standards and principles, and their presentation might evolve as Tesla continues to grow its energy business and as accounting standards change.
Tangible Assets: Tangible assets are physical and measurable assets used in a company’s operations. Examples include buildings, machinery, vehicles, furniture, and inventory.
These assets typically have a finite lifespan and are subject to depreciation, except for land, which is considered to have an indefinite useful life and is not depreciated. Tangible assets are important for businesses as they can be used to produce goods or services, secure loans, or be sold to generate cash.
How Does Tesla Grow Its Assets?
Tesla has effectively grown its assets through strategic investments, innovation, and expansion into new markets. Here are several key strategies that have been pivotal in the company’s asset growth:
1. **Innovation and Product Development**: Tesla continuously invests in research and development to innovate and improve its product offerings. This includes its electric vehicles, energy storage solutions, and solar technology products. By staying at the forefront of technology, Tesla creates high-demand products that drive sales and revenue, consequently growing its assets.
2. **Vertical Integration**: Tesla’s approach to vertical integration, controlling much of its supply chain and manufacturing process, has been a significant asset growth driver. This strategy includes producing batteries at its gigafactories, which helps reduce costs and improve efficiency. By managing its supply chain tightly, Tesla can scale up its production capabilities more effectively, contributing to asset growth.
3. **Global Expansion**: Tesla has aggressively expanded its presence globally, entering new markets and establishing production facilities in strategic locations such as China and Germany. This opens new revenue streams and diversifies its asset base across different geographies, contributing to growth.
4. **Direct Sales Model**: Tesla’s direct-to-consumer sales model bypasses traditional dealership networks, allowing for better control over inventory and reducing overhead costs. This innovative approach has contributed to efficient capital use and asset growth.
5. **Energy Projects and Services**: Beyond vehicles, Tesla has ventured into large-scale energy storage projects and solar energy solutions. These projects not only diversify Tesla’s revenue streams but also contribute to the growth of its asset base through investments in renewable energy infrastructure.
6. **Capital Raising and Investment**: Tesla has effectively used capital markets to fund its expansion. Through public offerings and debt issuances, Tesla has raised significant capital, which has been reinvested into growth initiatives, further expanding its asset base.
7. **Brand Value and Market Sentiment**: The strong brand value and positive market sentiment towards Tesla have played a crucial role in its asset growth. The company’s ability to maintain a high market capitalization allows for easier access to capital and partnerships, facilitating further asset growth.
In summary, Tesla’s growth in assets is the result of its innovative business model, strategic investments in technology and infrastructure, global expansion, and effective capital-raising strategies. By focusing on sustainable energy solutions and maintaining a strong brand image, Tesla continues to grow its assets and expand its market presence.
What Does The Growth of Tesla Total Assets Tell Us?
The growth of Tesla’s total assets over time can provide several key insights into the company’s financial health and strategic direction.
Firstly, it indicates Tesla’s capacity for investment in research and development, expansion, and acquisition, which are critical for sustaining innovation and maintaining competitive advantage in the electric vehicle and clean energy sectors.
Secondly, an increasing trend in total assets suggests that Tesla effectively leverages its resources to scale operations, enhance production capabilities, and expand its global footprint. This could signal strong management execution and a robust business model that can attract further investment and drive shareholder value.
Thirdly, the growth of Tesla’s total assets also reflects its ability to generate revenue and manage liabilities, which is essential for long-term sustainability. It can demonstrate Tesla’s success in navigating challenges in the automotive and energy industries, such as supply chain disruptions, regulatory hurdles, and competition.
However, it’s important to consider this growth in the context of Tesla’s overall financial performance, including revenue, profit margins, debt levels, and cash flow. Rapid asset growth, if not supported by revenue and cash flow, could indicate potential issues with asset utilization or financial stability.
Therefore, analyzing Tesla’s total assets in conjunction with other financial metrics provides a more comprehensive understanding of the company’s financial health and strategic positioning.
Total Assets
Tesla total assets
(click image to expand)
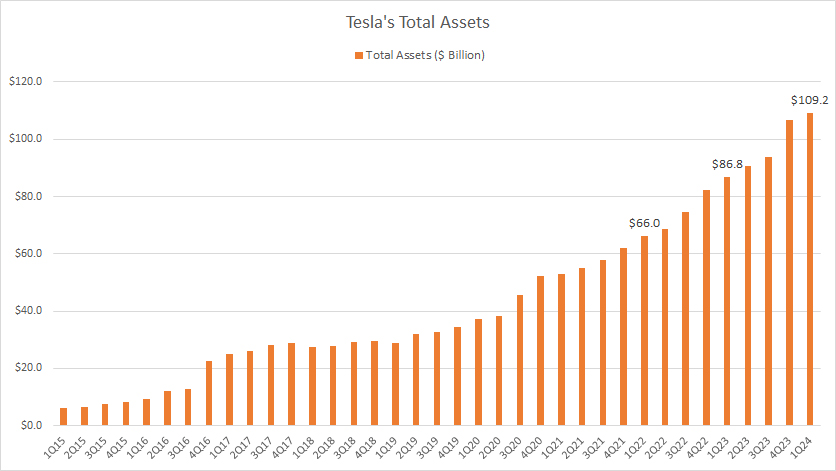
Tesla’s total assets have significantly risen since 2015, reaching an all-time high of $109 billion as of 1Q 2024, up 26% from last year and nearly double from 2022.
Essentially, the growth of the automaker’s total assets can tells us a lot about the company. These key insights are clearly laid down here: Tesla’s growth of total assets.
Current Assets
Tesla current assets
(click image to expand)
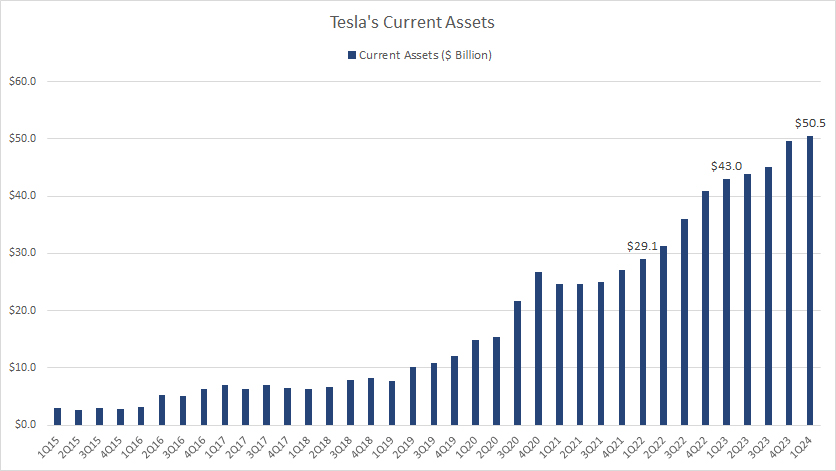
Tesla’s current assets have tremendously increased since 2015, reaching a record figure of $50.5 billion as of 1Q 2024, up 17% from a year ago and nearly double the figure from 2022.
The increase in Tesla’s current assets can suggest several positive developments. First, it may indicate improved liquidity, meaning Tesla has more short-term assets readily convertible to cash, enhancing its capability to cover short-term liabilities and potentially invest in opportunities without requiring additional debt or equity financing.
Secondly, the growth in Tesla’s current assets such as cash and cash equivalents, marketable securities, accounts receivable, and inventory could reflect higher sales volumes, efficient collections from customers, and smart inventory management. This could signal strong operational performance and market demand for Tesla’s products.
Long-Term Assets
Tesla long-term assets
(click image to expand)
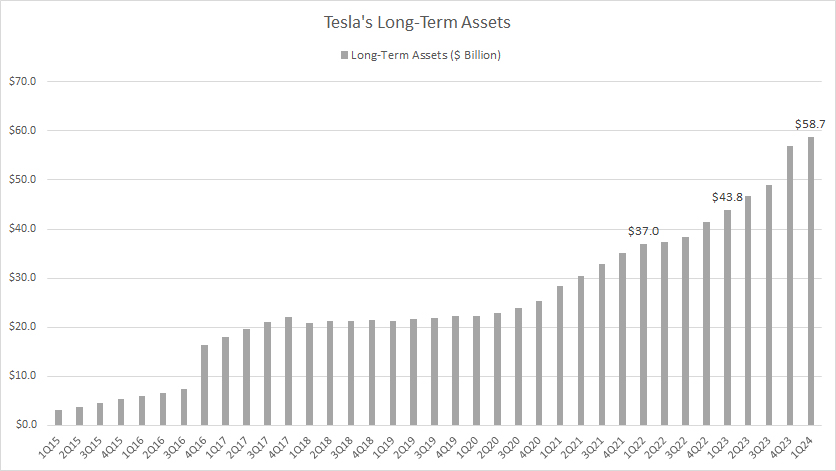
Tesla’s long-term assets increased by 34% from last year to $58.7 billion as of 1Q 2024. Since 2022, Tesla’s long-term assets have increased by nearly 60%.
The significant growth in Tesla’s long-term assets could indicate that Tesla is investing heavily in its future growth. This includes investments in new manufacturing facilities, research and development for future products or acquisitions of other companies to broaden their technological capabilities or market reach.
Additionally, the increase in Tesla’s long-term assets might signal that Tesla is bolstering its production capacity to meet anticipated demand. This is particularly relevant for a company like Tesla, which operates in the rapidly evolving electric vehicle and renewable energy sectors. Expanding production capabilities could be crucial for maintaining competitive advantage and capitalizing on market opportunities.
Tangible Assets
Tesla property, plant and equipment assets
(click image to expand)
The definition of Tesla’s tangible assets is available here: tangible assets.
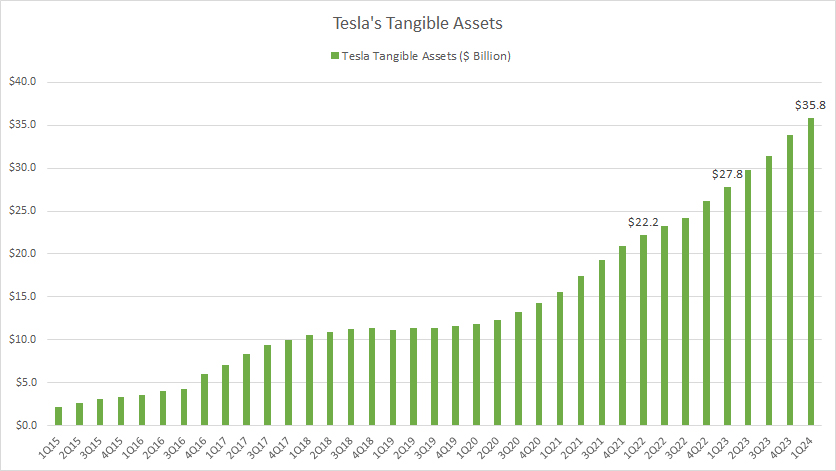
Tesla’s tangible assets includes fixed or physical assets such as the property, plant and equipment as well as the operating lease right-of-use assets. These are properties owned and leased by Tesla, including land, offices, warehouses, factories, machinery, etc.
According to the chart, Tesla’s total tangible assets have been rising. It reached $35.8 billion as of fiscal 1Q 2024, a record figure and up 29% from last year or 61% from 2022.
A significant increase in tangible assets suggests that Tesla is expanding its operations. This could mean opening new manufacturing plants, increasing production capacity, or investing in new technologies for Tesla. This is a positive sign for investors, indicating the company’s growth and potential for increased revenue.
Tesla’s accumulation of tangible assets also implies that Tesla is investing heavily in capital expenditures. This is crucial for a technology and manufacturing company like Tesla, as it needs to stay at the forefront of innovation, requiring constant upgrades to equipment and facilities.
Operating Lease Vehicles
Tesla operating lease vehicles assets
(click image to expand)
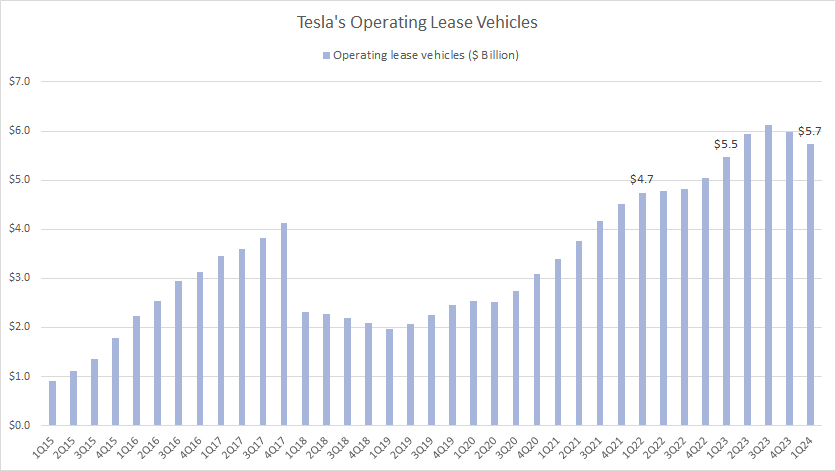
Tesla’s operating lease vehicles assets are another category of long-term assets that relate to the company’s leasing revenue.
The definition of Tesla’s operating lease vehicles assets is available here: operating lease vehicles.
Tesla is the lessor whereas its customers are the lessees. Tesla leases its vehicles such as the Model 3 and collects recurring leasing revenue from these leased assets.
However, there was a sudden decline in the asset values in 1Q18. The decline was attributed to the change in accounting standards in which a portion of this asset was re-classified to revenue immediately upon the adoption of the new standards.
All told, Tesla’s operating leased vehicles assets have steadily risen, reaching a record figure of $5.7 billion as of fiscal Q1 2024.
The increase in this asset category means that Tesla is investing more in its leasing program, pointing to a strategic decision to make its electric vehicles (EVs) more accessible to consumers who prefer leasing over purchasing. This can help Tesla increase its market penetration and customer base.
Secondly, the rise in operating lease vehicles assets reflects Tesla’s confidence in the residual value of its vehicles. By holding more vehicles under lease, Tesla is betting on the durability and appeal of its cars, anticipating that they will maintain significant value at the end of the lease terms.
Additionally, this increase could signal Tesla’s anticipation of growing demand in the EV market. By expanding its leasing fleet, Tesla prepares to meet this demand, ensuring it has a sufficient supply of vehicles for consumers opting for leasing options.
From a financial perspective, an increase in operating lease vehicles on the balance sheet could lead to higher revenue recognition over the lease periods. However, it might also imply higher initial capital expenditure and operating costs related to the maintenance and management of the leased fleet.
All in all, the continuous growth in this asset class is a positive sign that Tesla is doing well in its leasing business.
Solar Energy Systems
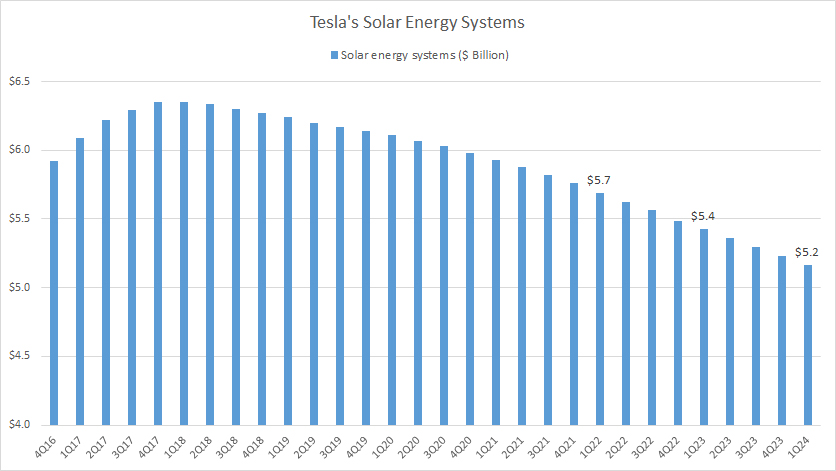
Tesla solar energy systems assets
(click image to expand)
The definition of Tesla’s solar energy systems asset is available here: solar energy systems.
Accordingly, Tesla’s solar energy systems assets have been declining. As of 1Q 2024, Tesla’s solar energy systems assets decreased to $5.2 billion, down 4% from a year ago or 9% from 2022.
The decrease in Tesla’s solar energy systems assets might indicate a slowdown in the adoption or installation of Tesla’s solar products, such as solar panels and Solar Roof. This could be due to various factors, including increased competition, consumer demand changes, or supply chain and production challenges.
Secondly, it could suggest that Tesla is slowing down or reducing its investment in new solar energy projects. This might be due to a strategic shift within the company, reallocating resources to more profitable or promising areas, such as their electric vehicle segment.
Summary
Tesla, Inc., has experienced remarkable growth in its assets over recent years, reflecting its rapid expansion and increased market presence. This growth can be attributed to several key factors, including increased production capabilities, expansion into new markets, and the development of new technologies.
Tesla’s investment in research and development has significantly contributed to its innovative product line, including electric vehicles, battery storage, and solar energy solutions, which in turn has bolstered its asset base. Furthermore, Tesla’s strategic acquisitions and the construction of Gigafactories worldwide have expanded its manufacturing footprint, driving up the value of its physical assets.
The company’s strong sales performance and rising stock price have also played a crucial role in increasing its financial assets. Overall, Tesla’s asset growth is a testament to its successful strategy and execution in the clean energy and electric vehicle markets, positioning it as a leader in the industry with a robust and growing asset portfolio.
References and Credits
1. All financial figures presented in this article were obtained and referenced from Tesla’s annual and quarterly reports, SEC filings, earnings releases, presentations, investor update letters, earnings calls, etc., which are available in this link: Tesla Earnings Releases.
2. Featured images in this article are used under Creative Commons license and are obtained from the following links: Neeta Lind 1 and Neeta Lind 2.
Disclosure
References and examples such as tables, charts, and diagrams are constantly reviewed to avoid errors, but we cannot warrant the total correctness of all content.
The content in this article is for informational purposes only and is neither a recommendation nor a piece of financial advice to purchase a stock.
If you find the information in this article helpful, please consider sharing it on social media and also provide a link back to this article from any website so that more articles like this one can be created in the future.
Thank you!

