The Cadillac ATS. Source: Flickr Image.
Back in fiscal 2015, General Motors purchased a significant portion of its common stocks.
In subsequent years, General Motors continued the share buyback but the frequency at which the stock buyback was done had significantly slowed.
In fiscal 2020, GM suspended its share buyback program, due primarily to the COVID-19 disruptions.
At the end of 2022, the stock buyback suspension was lifted, and share repurchase has continued.
Overall, GM had bought back quite a number of shares and the buyback program had greatly reduced the company’s share count.
This article explores General Motors’ share buyback history and how the buyback program affects the company’s shares outstanding.
Other than the historical shares outstanding, we also look at other metrics, including the number of shares repurchased, the dollar amount spent on shares repurchases and stock-based compensation expenses.
Table Of Contents
Shares Outstanding
A1. Shares Outstanding By Quarter
Stock Buyback
B1. Stock Buyback History
B2. Cumulative Stock Buyback
How Much Money Spent
C1. Dollar Spent On Stock Repurchase
C2. Cumulative Dollar Spent On Stock Repurchase
Stock-Based Compensation Expenses
D1. Stock-Based Compensation Expenses By Year
Conclusion And Reference
S1. Conclusion
S2. References and Credits
S3. Disclosure
Shares Outstanding By Quarter
GM’s common stock outstanding
(click image to expand)
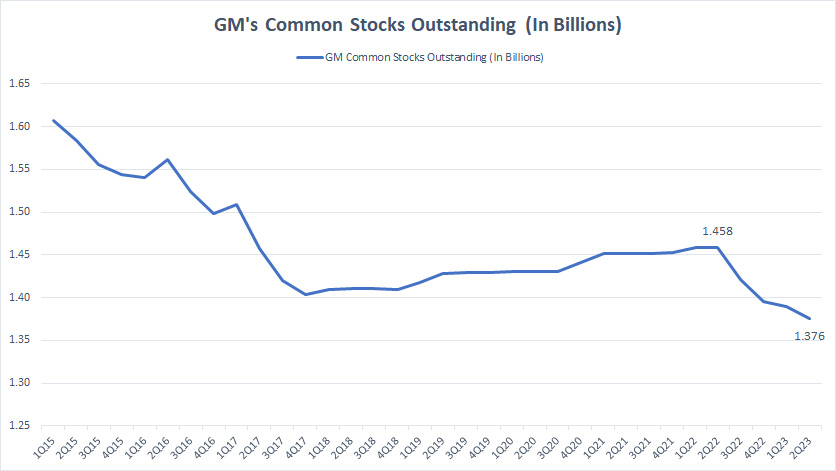
The fall of the plot was sharp before 2018, indicating the steep decline of GM’s common stock outstanding.
Between 2018 and 2022, GM’s common stock outstanding increased modestly as share buyback was only done intermittently.
However, at the end of 2022, GM resumed its share repurchase program, once again driving the common stock outstanding to fall.
As of 2Q 2023, GM’s common stock outstanding was estimated at 1.38 billion.
Stock Buyback History
GM’s stock buyback history
(click image to expand)
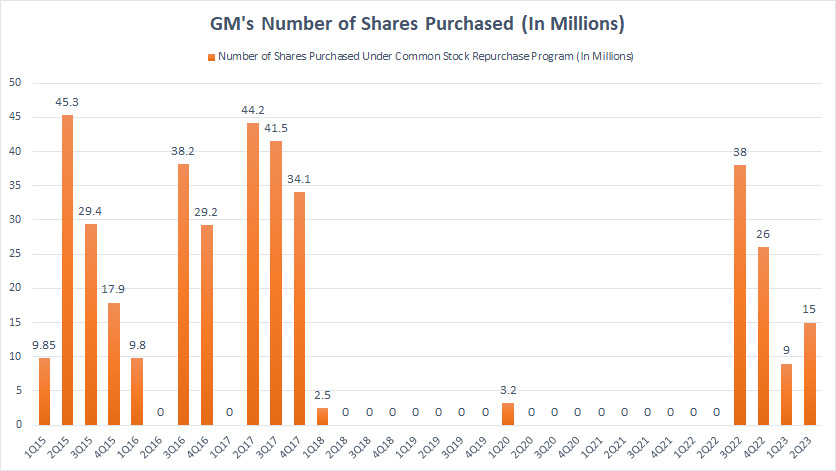
The majority of GM’s share buyback occurred in the early years between fiscal 2015 and 2017, with 2017 having the biggest share repurchase at roughly 120 million units.
However, from 2018 onward, GM’s share repurchase effort was reduced considerably and the number of shares being bought back was estimated at 5.5 million shares.
In fiscal 2022, GM suspended its share repurchase program, due mainly to the COVID-19 disruption.
Not only did GM suspend its share repurchase program, but the company was forced to suspend its cash dividend when one of its credit facilities exceeded $5.0 billion under existing borrowings.
At the end of fiscal 2022, GM resumed its stock repurchase program after paying back most of the debt borrowed during the COVID crisis.
As shown in the chart above, GM’s number of shares repurchased from 3Q22 to 2Q23 totaled 88 million units, quiate a significant number by historical measures.
Cumulative Stock Buyback
GM’s cumulative stock buyback
(click image to expand)
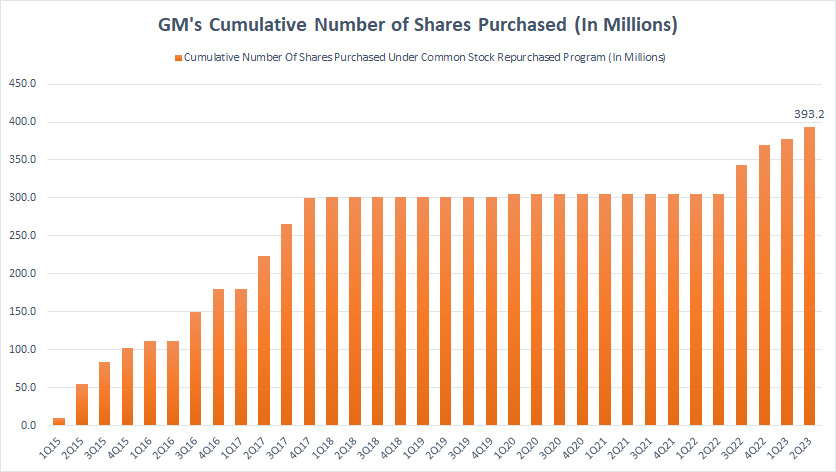
On a cumulative basis, GM’s number of shares being purchased grew the most between fiscal 2015 and 2017.
You can see from the plot above that the curve was the steepest in those periods.
Thereafter, GM’s number of common stock repurchases was sort of flat and it went on until the end of fiscal 2022 when the curve started to rise again.
As of 2Q 2023, GM had purchased roughly 393 million shares on a cumulative basis since fiscal 2015.
Dollar Spent On Stock Repurchase
GM’s dollar spent on stock buyback
(click image to expand)
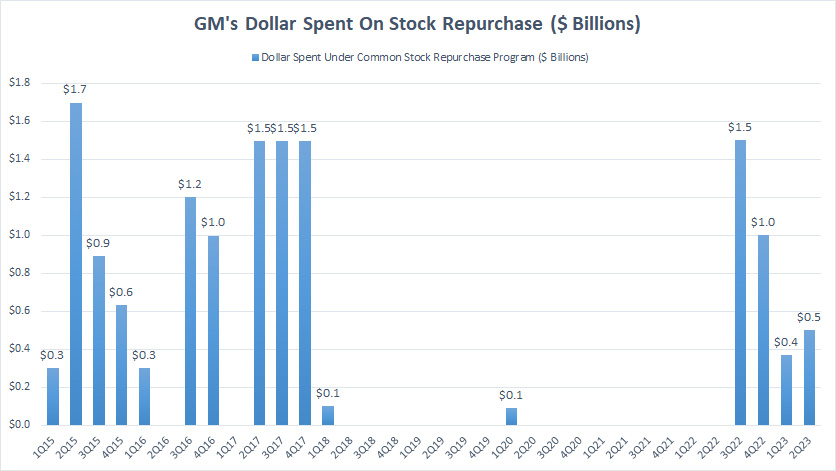
GM’s dollars spent on share repurchase range from $100 million to as much as $1.7 billion over the 9 years.
GM spent the most money on share repurchases in the early years, for example, between fiscal 2015 and 2017.
Back in those days, GM’s share price was trading at USD 30~$40 per share, quite a premium in those days.
GM should have bought back its shares during the COVID period when its share price crashed to less than $5 in 2020.
Instead, GM suspended its share buyback during the crash when the share price was at its lowest.
Similarly, since the end of fiscal 2022, GM has been buying back its stocks when the share price is traded between $30 and $40.
Therefore, GM is again buying back its shares at a premium price and has spent $3.4 billion on stock buyback since the end of fiscal 2022.
In short, GM has badly timed its stock buyback.
Cumulative Dollar Spent On Stock Repurchase
GM’s cumulative dollar spent on stock buyback
(click image to expand)
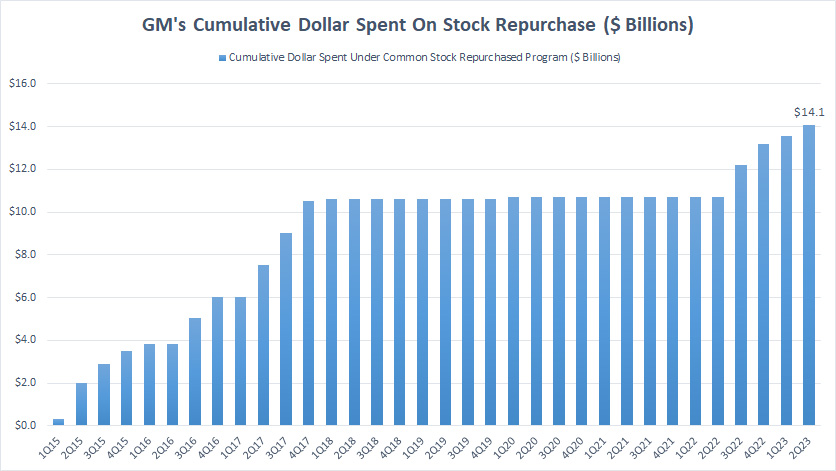
Cumulatively, GM’s dollar spent on share repurchases reached $14 billion as of fiscal 2Q 2023.
GM’s dollar spent on share repurchases was flat at $11 billion between 2018 and 2022 when the effort was significantly reduced.
Stock-Based Compensation Expenses By Year
GM’s stock-based compensation expenses
(click image to expand)
GM’s common share outstanding still increased steadily even after the company stopped the share buyback.
Why is that?
The answer lies in GM’s stock-based compensation.
Stock-based compensation is a form of stock incentive granted to employees for their services.
Under GM’s stock incentive awards, the stocks granted can be in the form of RSUs, RSAs, PSUs, and stock options.
During the process, new stocks are issued and given to employees, and the issuance costs are treated as an expense in the company’s income statements.
Additionally, the new stocks issued will dilute the existing share count.
Therefore, GM has been adding more shares under its stock-based compensation program all these years.
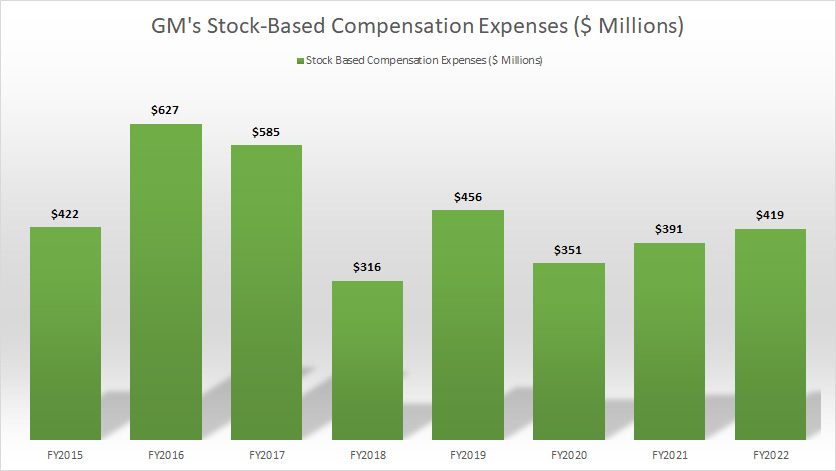
As shown in the chart above, GM’s stock-based compensation expense hovered between $300 million and $600 million per year.
The most recent one in fiscal 2022 totaled as much as $419 million.
Since fiscal 2015, GM has incurred a total of $3.6 billion in stock-based compensation expenses.
This amount represents as much as 27% of GM’s total stock buyback budget from fiscal 2015 to 2022.
That was quite a huge amount considering that the expense took up nearly a quarter of the company’s buyback budget.
Conclusion
In conclusion, GM has badly timed its share buyback.
In this aspect, GM bought back its share when it was traded at a premium and stopped the share repurchases when it crashed to a few dollars.
Therefore, has the $14 billion spent on share repurchases provided any value to shareholders?
References and Credits
1. All financial figures presented in this article were obtained and referenced from GM’s SEC filings, earnings reports, news releases, shareholder presentations, quarterly and annual reports, etc., which are available in GM SEC Filings.
2. Featured images are used under Creative Common Licenses and obtained from raymondclarkeimages and Jason Mrachina.
Disclosure
References and examples such as tables, charts, and diagrams are constantly reviewed to avoid errors, but we cannot warrant the full correctness of all content.
The content in this article is for informational purposes only and is neither a recommendation nor a piece of financial advice to purchase a stock.
If you find the information in this article helpful, please consider sharing it on social media and also provide a link back to this article from any website so that more articles like this one can be created in the future.
Thank you!

