

Within the “Basic Materials” sector, there lies a tiny gem. This tiny gem is little known, has few analyst coverage and zero stock options. This tiny gem is Friedman Industry Incorporated (FRD). Friedman Industry is a company that is involved in steel processing, pipe manufacturing and distribution in the United States. The company purchases hot-rolled steel coils, processes the coils into flat, finished sheet and plate and sells these products on a wholesale basis as well as processes customer owned coils on a fee basis.
Friedman Industry is a long-term dividend paying company. It has been paying dividend continuously for the past 10 years. Based on the dividend analysis by the Stock Dividend Screener spreadsheet as of September 3rd, 2013, Friedman Industry or FRD is giving a reasonably decent trailing and forward dividend yield of 4.75% and 3.2% respectively. The five year average dividend yield for this small cap company is astoundingly 5%!
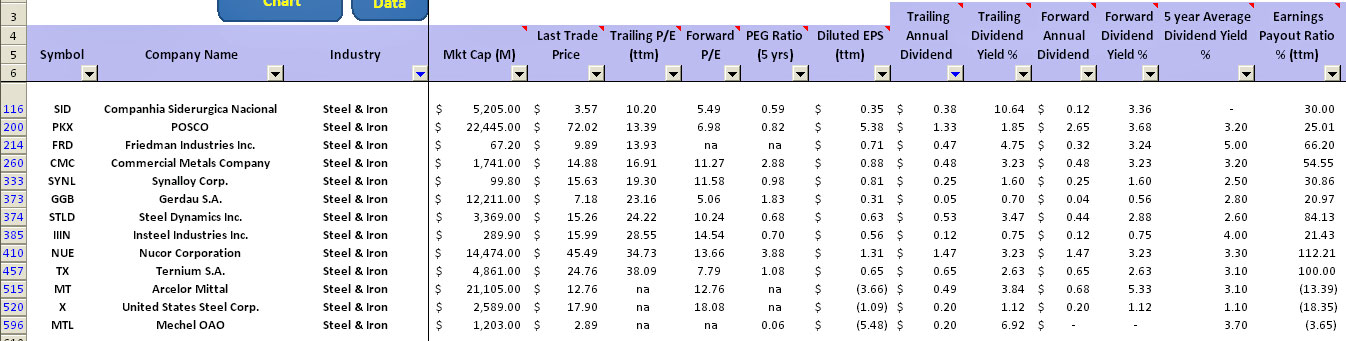
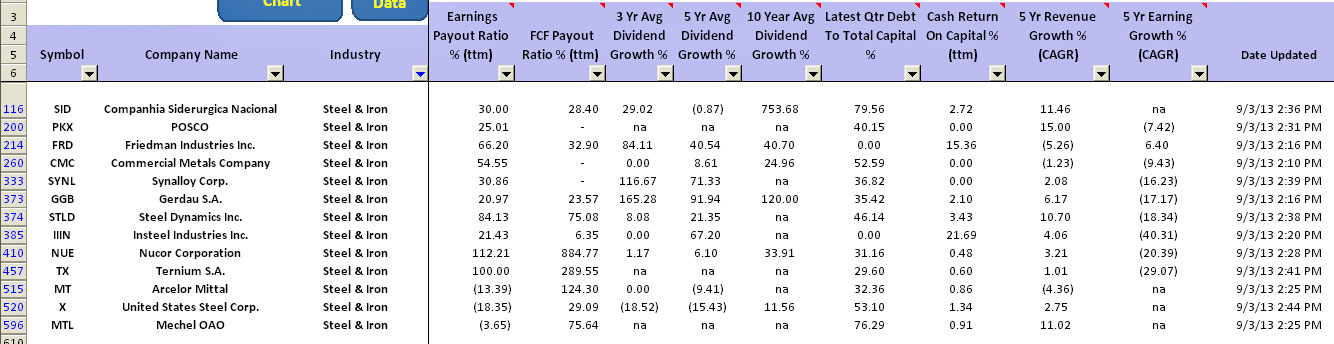
From the table above, the company is a small player in the “Steel & Iron” industry with only $67 million market cap. Even though FRD is a small company by market capitalization, it’s a cash cow. Based on the metric “Cash Return On Capital %” shown in the table above, Friedman is able to generate an impressive number of 15%. This metric is a measure of free cash flow generated based on the total capital (stock holder equity + long and short term debt) employed. What it means here is that for every dollar invested as capital, Friedman churns out $0.15 as free cash flow.
From the table above, you can see that Friedman Industry is sitting at the top in terms of generating free cash flow. In dividend investing, cash is king. When doing analysis on a dividend paying company, the first question you need to ask is how much cash the company is generating. Without cash, the dividend payment won’t be sustainable. Without cash, the company will need to find other means such as selling asset or borrowing to sustain the dividend payment.
Other metrics that you need to look at when analyzing a dividend paying company are the earnings and free cash flow payout ratio. For FRD, the table above shows that there is room left for this company to increase the dividend payout in the future. FRD has been increasing dividend payout for the past 3, 5 and 10 years. Looking at the metrics “Avg Dividend Growth” in above table, the dividend payout increment is at a rate of 84%, 40% and 40% for the 3, 5 and 10 year period respectively.
Lastly, people often miss out on the debt a company is carrying when analyzing a dividend paying company. For Stock Dividend Screener spreadsheet, there is a metric called “Debt to Total Capital Ratio” which measures the amount of debt with respect to total capital. As of the latest quarter, FRD is having zero debt as the metric is zero in the table above. Having little debt is essential in ensuring that a dividend paying company is able to continuously pay out dividend even during economic downturn.
In terms of valuation, FRD is ranked below average within the “Steel & Iron” industry when compared among its dividend paying peers. It may well be undervalued judging from its trailing PE of just 13 since FRD is performing exceptionally well in generating cash flow for the past 12 months.
In conclusion, FRD is definitely a cash machine which is able to churn out decent amount of free cash flow. For long term investor who is interested in FRD, it’s definitely a safe bet in view of its low free cash flow payout ratio and zero debt in its balance sheet.