


General Mills (GIS) produces and markets branded consumer foods in the United States and internationally. It’s one of the few solid companies that have been paying dividends continuously for the past 10 years. The screening for GIS was done on 3rd of September by using the Stock Dividend Screener spreadsheet. As of 3rd of September 2013, the stock is paying an estimated forward dividend yield of 3.1% and a trailing annual dividend yield of 2.7%.


Looking at some of the metrics in the above table, some numbers look quite impressive. Take the 3, 5 and 10 years of average annual dividend growth % metrics, GIS has been continuously increasing the dividend payout at an astounding annual rate of over 10% every year.
Besides, the debt for GIS is still at manageable level at around 54% of total capital as of the latest quarter. The 15% cash return on total capital for the past 12 months is equally impressive considering that a company with a value above 10% is considered a cash cow.
In addition, to check whether the dividends from GIS is sustainable or not, we look at both the dividends to earning and free cash flow payout ratio. The company is in a good position since both numbers stood at 47% and 38% respectively. Judging from these numbers, GIS should be able to increase the dividend payout in the future.
In terms of valuation with respect its peers within the same industry, I sorted all the stocks within the “Processed & Packaged Goods” industry based on the “Trailing P/E (ttm)” metric to see where GIS stands. Surprisingly, General Mills was ranked at the bottom in terms of trailing PE compared to its peers. A solid dividend paying company like General Mills should probably deserve better valuation.
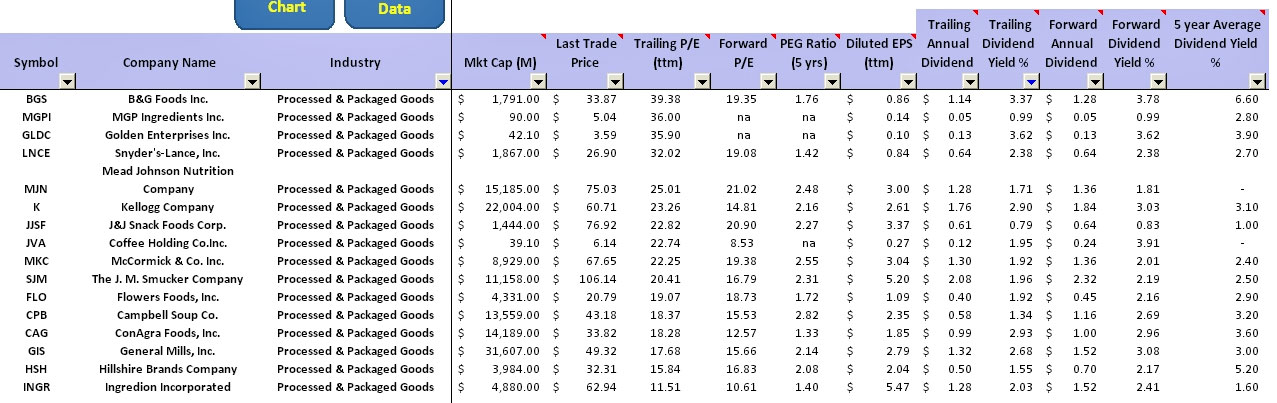
Yes, there are better companies within the industry with better revenue and earnings growth, but GIS isn’t lacking so far behind. If you look at the above table again, both the revenue and earnings growth for the past 5 years are 5% and 8% respectively.
To dig deeper into the past performance of GIS, I used the “Launch Chart” capability in the Stock Dividend Screener tool to get an idea of how GIS performed in the past. Here is the result I got.
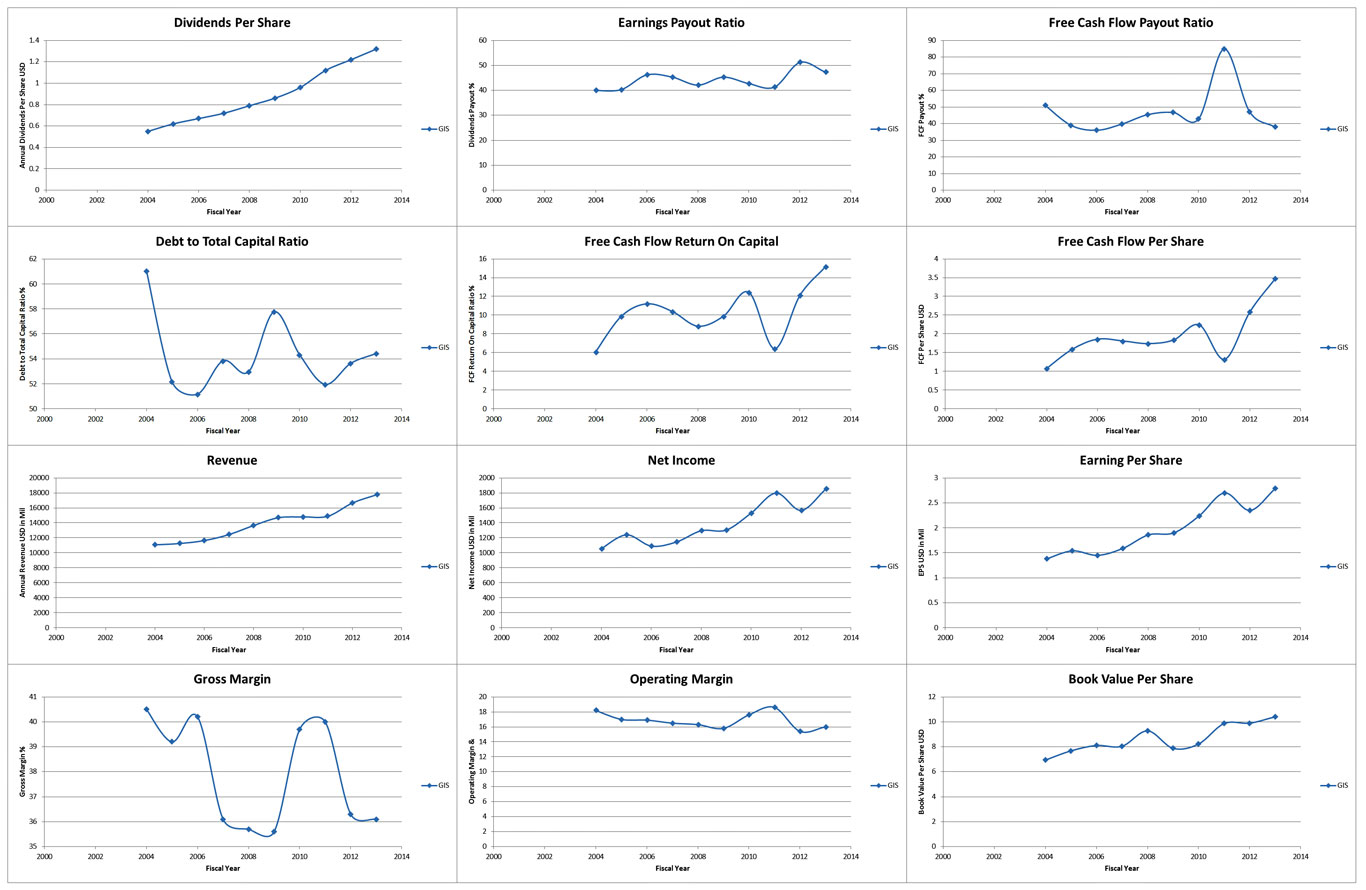
The dividend payout for the past 10 years has been impressively consistent and you can see that the payout is actually increasing every year from the plot. Most importantly, the dividend to free cash flow payout ratio had been quite consistent for the past 10 years. This number stayed within the range of 30% to 50% except in 2011 when the payout ratio shoot up to 80%. In 2011, the free cash flow of GIS actually dropped if you looked at the “Free Cash Flow Per Share” plot. This is the reason which had caused the payout ratio to shoot up. You might want to dig deeper to find out what happen in 2011.
In short, based on the result of the free cash flow payout ratio and cash return on capital, GIS has been able to generate tones of free cash flow for the past 10 years. This can be seen from the increasing dividend payout year over year while maintaining a low free cash flow payout ratio and a consistently high cash return on capital ratio. General Mills is no doubt a solid dividend paying company worth getting your attention.