

We are going to analyze Gentex Corporation (GNTX) in terms of its dividend payout and the sustainability of its dividend payment in the long run. Here is a little bit information about the company. Gentex Corporation designs, develops, manufactures, and markets electro-optical products for the automotive, commercial building, and aircraft industries primarily in the United States, Germany, and Japan.
After I ran the ticker through the Stock Dividend Screener spreadsheet on September 3rd, 2013, the company has got some decent results. At first glance, even though the 3-year and 5-year average annual dividend growth rate is a mere 5%, the company managed to achieve double-digit growth (18%) in dividend over the course of 10-year period.
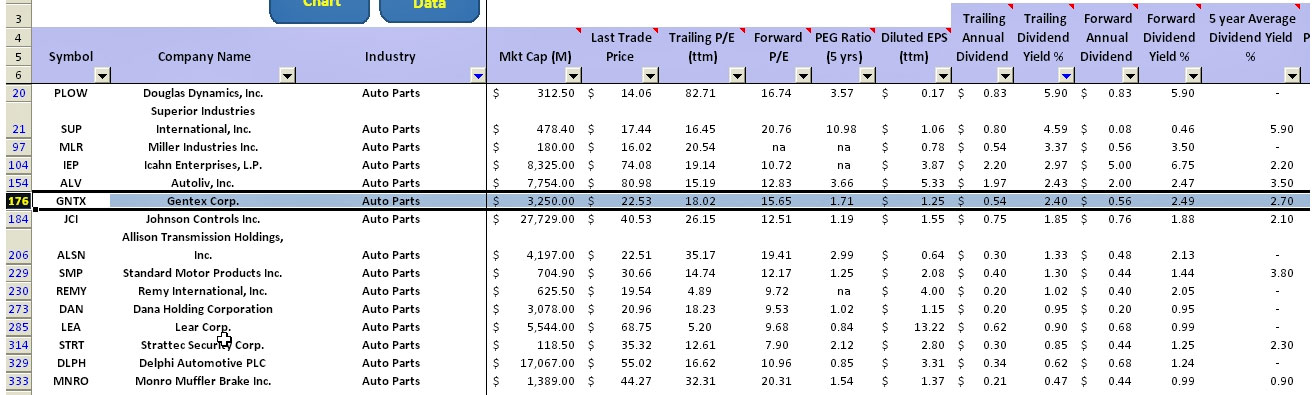
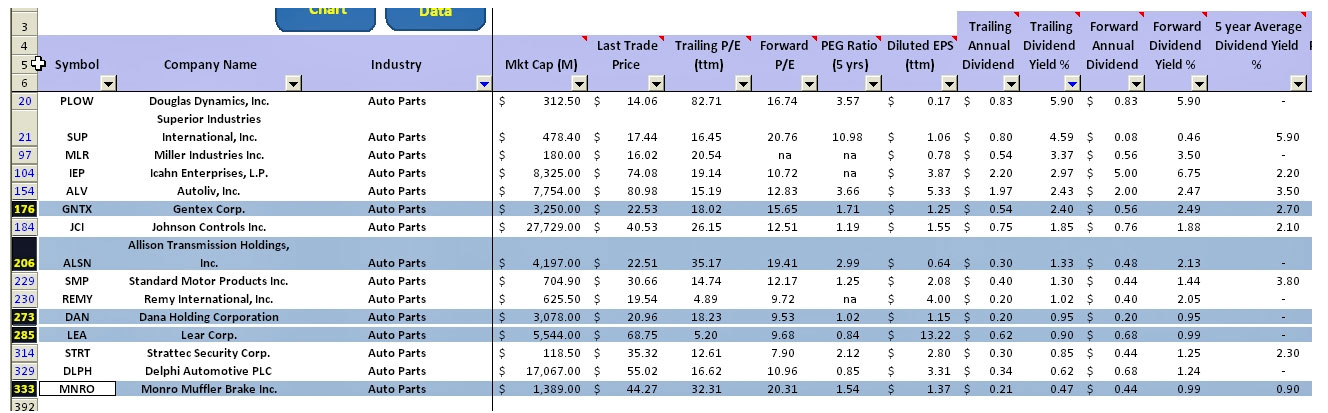
Here is the preliminary screening result for GNTX:
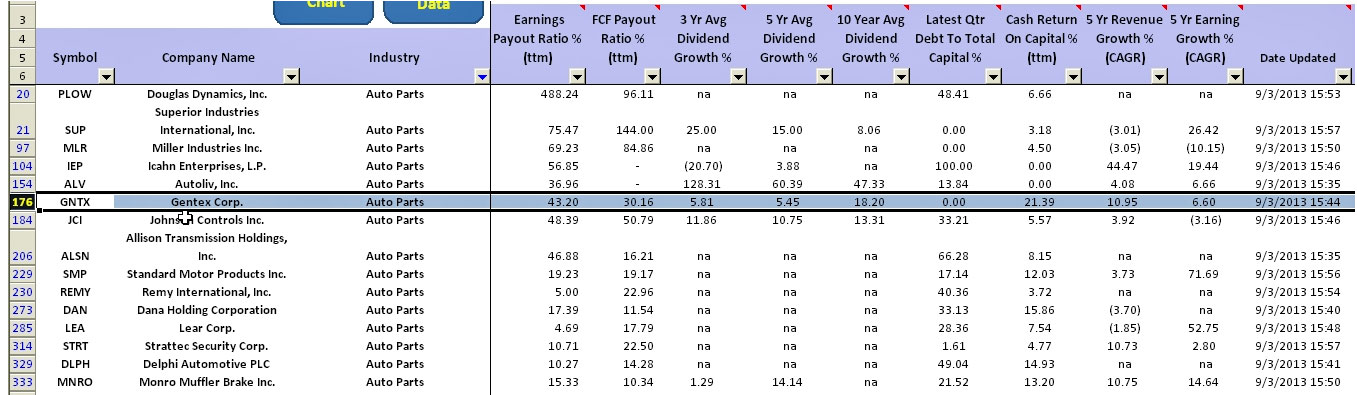
In terms of earnings and free cash flow payout ratio for the past 12 months, the numbers looked quite impressive at 43% and 30% respectively. Besides, the company has no debt and the free cash flow return on total capital for the past 12 months is at a staggering rate of 21%. This number shows that the company managed to generate a lot of free cash flow for the past 12 months by using its total capital. The impressive result of the cash return on capital that we are seeing here is consistent with the low ratio of the dividend to free cash flow as well as earnings payout. This consistency further reinforced the capability of the company in cash flow generation.
In dividend investing, cash is king. If a company manages to generate free cash flow, the dividend will be able to sustain in the long run. Also GNTX managed to achieve a decent sales growth of 11% and earnings growth of 6.6% for the past 5 years.
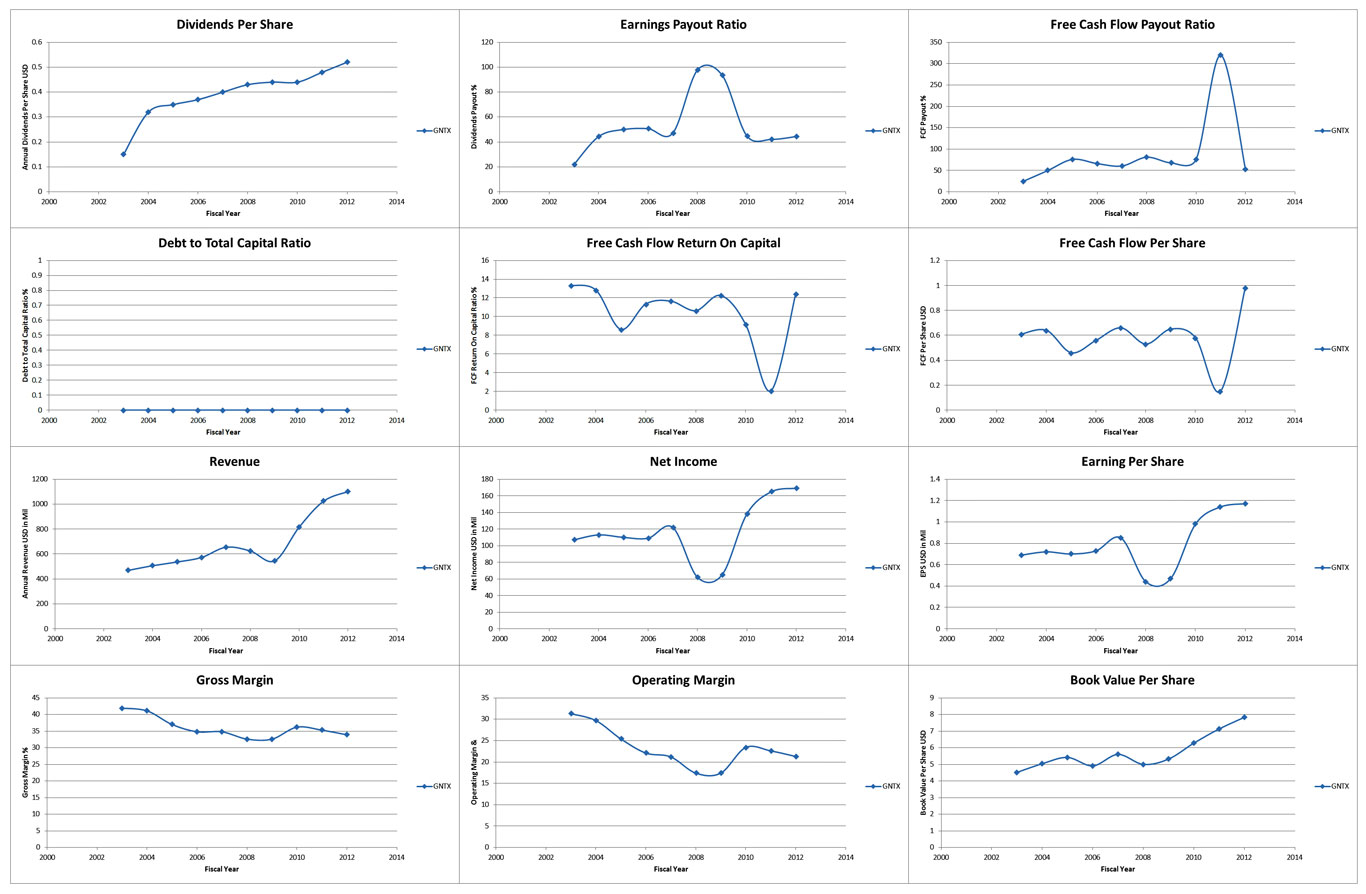
When I tried to dig deeper into its past performance by bringing up the plots, GNTX has certainly outperformed most of its peers. In terms of the gross margin and operating margin, I compared GNTX with other companies in the same industry that are having the same market capitalization. The following plots show the results:
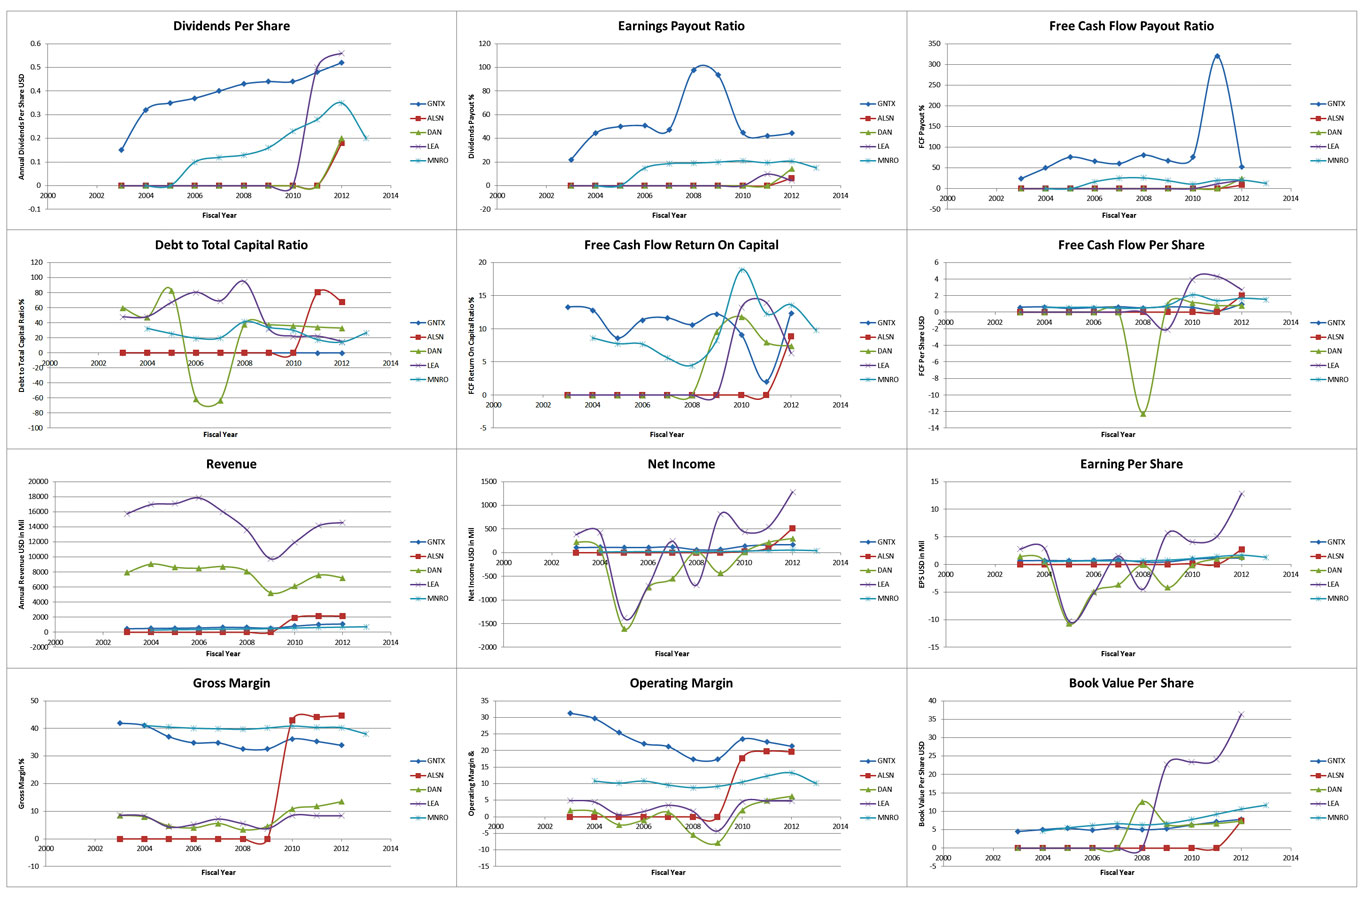
As you can see from the plots above, Gentex Corporation has outperformed most of its peers in terms of gross and operating margin during the 10 year period except that in the gross margin plot where MNRO has managed to achieved better efficiency in turning sales to profit. But if you looked at the debt plot, Gentex carried no debt over the course of 10-year period whereas MNRO has some level of debt.
If you have noticed that in the revenue plot, even though the ticker LEA and DAN have much higher sales compared to Gentex, they are not much far off to each other when it comes to net income and earnings per share. This clearly indicates the better efficiency of Gentex in turning its sales into profits.
In terms of dividend payout, GNTX is clearly the winner. The dividend graph shows that Gentex has distinctly outperformed its peers in dividend growth. One area of concern that I would like to point out is that if you looked at the plots of earnings and free cash flow payout ratio, GNTX is among the highest. This indicates than GNTX has paid out most of its earnings and free cash flow as dividend to shareholders. This may not be bad after all since this may indicates that the management of Gentex is closely sided with shareholders.
In terms of valuation, GNTX is fairly valued compared to its peers with a trailing PE of 18 as of September 3rd, 2013. There are other companies in the same industry which are having better trailing and forward dividend yield.
In conclusion, there is no doubt that GNTX stands out in dividend growth and the management may be closely in line with shareholders judging from its relatively high earnings and free cash flow payout ratio. The ability of Gentex in generating cash flow can be seen from its consistency in maintaining a relatively high free cash flow return on total capital ratio over the course of 10-year period.