Big data analytics. Pexels Images.
Palantir Technologies specializes in big data analytics and is known for developing software platforms that integrate, manage, and secure data.
Palantir’s platforms are used by government agencies, financial institutions, and various other sectors to analyze complex data and solve difficult problems.
This article looks at Palantir’s consolidated profit and profit breakdown by segment. Apart from the profitability, we also explore Plantir’s profit margin.
Palantir’s business divisions consist of two units: Government and Commercial.
Let’s check out the details!
Investors looking for other statistics of Palantir may find more resources on these pages:
Revenue
Profit Margin Comparison
R&D Comparison
Please use the table of contents to navigate this page.
Table Of Contents
Definitions And Overview
Consolidated Results
A1. Profitability
A2. Profit Margin
Profit By Segment
B1. Profit from Government and Commercial Segments
B2. Profit from Government and Commercial Segments In Percentage
Profit Growth By Segment
B3. Profit Growth from Government and Commercial Segments
Profit Margin By Segment
C1. Profit Margin from Government and Commercial Segments
Summary And Reference
S1. Insight
S2. References and Credits
S3. Disclosure
Definitions Of Segments
To help readers understand the content better, the following terms and glossaries have been provided.
Government: Palantir’s Government division refers to its business operations involving contracts and services provided to government agencies, primarily in the United States. Here are some key points:
Contracts and Services: Palantir provides a range of services, including data analytics, artificial intelligence (AI) platforms, and software solutions for military and defense purposes.
For example, Palantir recently won a $100 million contract from the U.S. Department of Defense for AI tools that identify targets for air strikes.
AI Platform: Palantir’s Artificial Intelligence Platform (AIP) is a key product in this segment, enabling government agencies to analyze vast amounts of data and derive actionable insights.
Commercial: Palantir’s Commercial segment focuses on providing data analytics and artificial intelligence (AI) solutions to businesses and organizations outside of the government sector. Here are some key points:
Product Offerings: Palantir’s commercial clients benefit from its Artificial Intelligence Platform (AIP), which helps organizations analyze large datasets and derive actionable insights.
Customer Base: The Commercial segment includes a diverse range of clients across various industries, such as finance, healthcare, manufacturing, and technology.
Contribution & Contribution Margin: The contribution and contribution margin is a non-GAAP measure provided by Palandir Technologies in its annual and quarterly reports.
Palantir defines the contribution and contribution margin as revenue less cost of revenue and sales and marketing expenses, excluding stock-based compensation, divided by revenue in the case of the contribution margin.
The purpose of the contribution and contribution margin is to capture how much the firm has earned from customers after accounting for the costs associated with deploying and operating its software, as well as any sales and marketing expenses involved in acquiring and expanding the firm’s partnerships with those customers, including allocated overhead.
In addition, Palantir excludes stock-based compensation during the measurement of the contribution and contribution margin, as it is a non-cash expense.
Palantir believes that the contribution and contribution margin provides an important measure of the efficiency of operations over time. The non-GAAP metric is a key measure used by the firm’s management to evaluate performance, and also provides useful information to investors and others in understanding and evaluating operating results in the same manner as the management team.
Moreover, according to Palandir, the contribution and contribution margin should not be considered in isolation from, or as a substitute for, financial information prepared in accordance with GAAP.
Profitability
Palantir-consolidated-profit
(click image to expand)
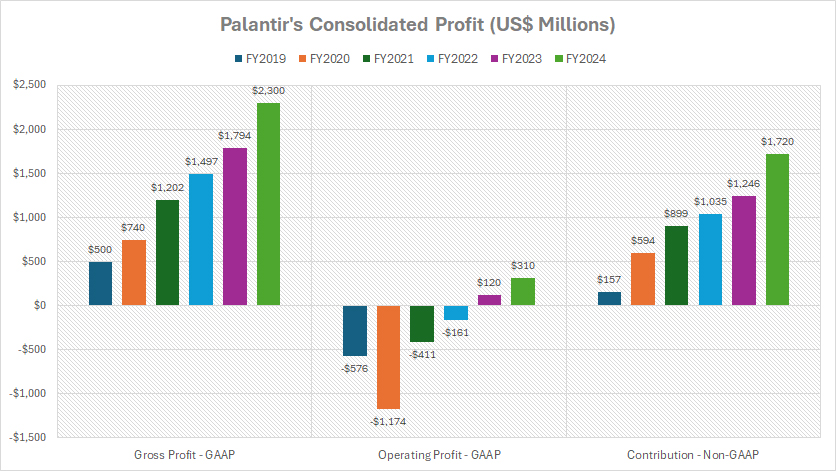
The contribution metric presented in the chart above is a profitability measure introduced by Palandir Technologies in its quarterly and annual reports.
It is a non-GAAP measure specifically created to evaluate performance, and also provides useful information to investors and others in understanding and evaluating operating results in the same manner as the management team.
The definition of the contribution and contribution margin is available here: contribution & contribution margin
From the perspective of the consolidated profitability, Palantir generates significant gross profits, as shown in the chart above. For example, Palantir’s gross profit has experienced significant growth, more than quadrupling from $500 million in fiscal year 2019 to $2.3 billion in fiscal year 2024.
For operating profit, Palantir has turned around from unprofitable to profitable, as shown in the graph above. Before 2023, Palantir consistently faced operating losses. Nevertheless, the company achieved an operating profit in fiscal year 2024 for the second time in over six years. As seen, Palantir managed to generate $310 million in operating profit in fiscal year 2024, the highest in the history of the company.
For profit from contribution, Palantir has been able to generate consistent profitability since fiscal year 2019. As of fiscal year 2024, Palantir’s profit from contribution reached a record figure of $1.7 billion, a significant rise from the $157 million reported in 2019.
Profit Margin
Palantir-consolidated-profit-margin
(click image to expand)
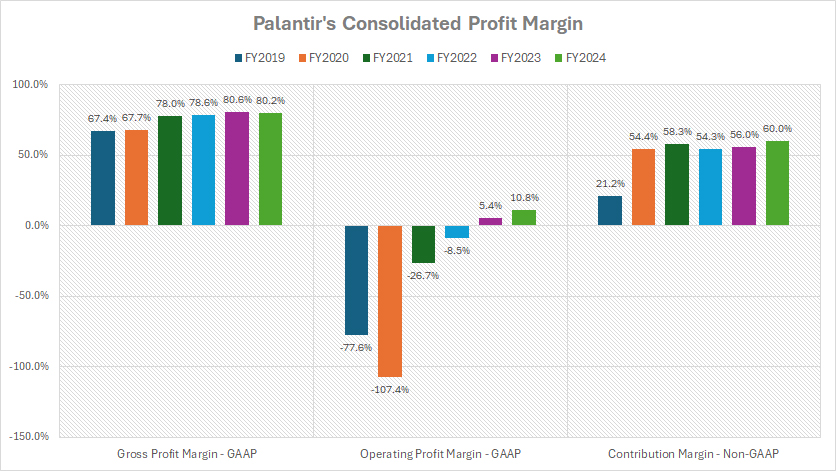
The contribution metric presented in the chart above is a profitability measure introduced by Palandir Technologies in its quarterly and annual reports.
It is a non-GAAP measure specifically created to evaluate performance, and also provides useful information to investors and others in understanding and evaluating operating results in the same manner as the management team.
The definition of the contribution and contribution margin is available here: contribution & contribution margin
Palantir’s gross profit margin reached 80.2% in fiscal year 2024, roughly inline with the 80.6% in 2023, but a significant increase from 67.4% reported in 2019.
On the other hand, Palantir only managed to produced an operating profit margin of 10.8% in fiscal year 2024, a far cry from the 80% gross margin produced in the same fiscal year.
However, Palantir had operated at a loss before 2023. In fiscal year 2023, it produced an operating profit for the firs time in the company’s history. Therefore, the positive result in fiscal year 2023 and 2024 marked a significant step forward for the company.
Meanwhile, Palantir’s contribution margin has been consistently strong since fiscal year 2019, averaging around 57% over the last three years. In fiscal year 2024, Palantir produced a contribution margin of 60%, a much higher figure than the three-year average.
Profit from Government and Commercial Segments
Palantir-profit-by-segment
(click image to expand)
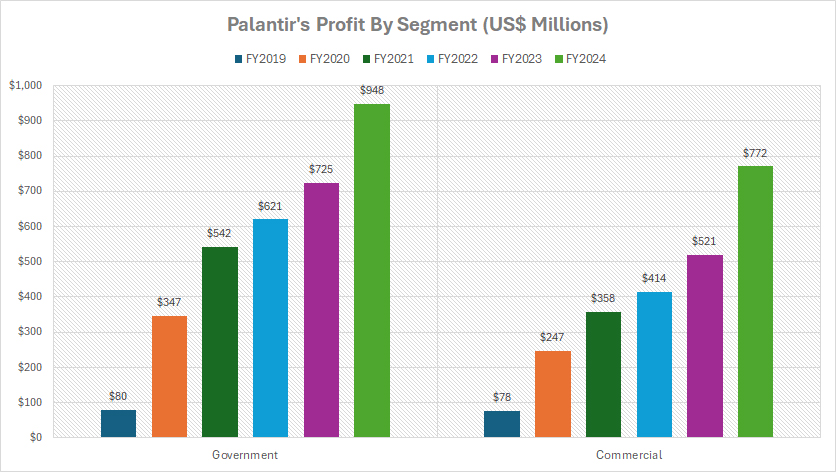
The profits from Government and Commercial segments are evaluated based on the contribution profit.
For your information, the contribution metric presented in the chart above is a profitability measure introduced by Palandir Technologies in its quarterly and annual reports.
It is a non-GAAP measure specifically created to evaluate performance, and also provides useful information to investors and others in understanding and evaluating operating results in the same manner as the management team.
The definition of the contribution and contribution margin is available here: contribution & contribution margin
Palantir’s Government sector generates significantly higher profits compared to the Commercial division, as shown in the graph above.
In fiscal year 2024, Palantir achieved a remarkable $948 million in contribution profit from the Government segment, while the contribution profit from the Commercial sector was slightly lower at $772 million.
On average, Palantir’s contribution profit from the Government division stood at $765 million annually between fiscal year 2022 and 2024. On the other hand, Palantir averaged $569 million per year in contribution profit over the last three years.
In addition, both divisions have achieved significant profit growth since fiscal year 2019. For example, the contribution from the Government segment has risen by 800% since 2019, increasing from $80 million to over $900 million in five years.
Similarly, the Commercial sector has seen its profit rise from just $78 million in fiscal year 2019 to over $700 million in fiscal year 2024.
Profit from Government and Commercial Segments In Percentage
Palantir-profit-by-segment-in-percentage
(click image to expand)
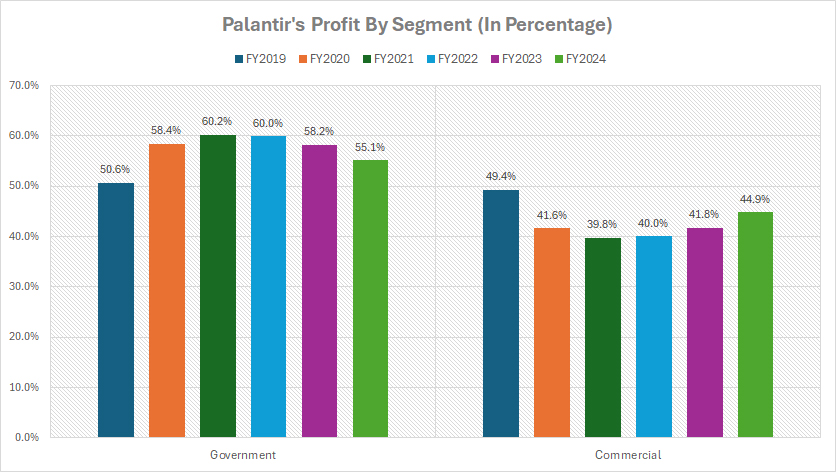
The profits from Government and Commercial segments are evaluated based on the contribution profit. For your information, the contribution metric presented in the chart above is a profitability measure introduced by Palandir Technologies in its quarterly and annual reports.
It is a non-GAAP measure specifically created to evaluate performance, and also provides useful information to investors and others in understanding and evaluating operating results in the same manner as the management team.
The definition of the contribution and contribution margin is available here: contribution & contribution margin
Palantir’s profit from Government accounted for 55.1% of the total in fiscal year 2024, which was much higher than the Commercial sector’s profit share of 44.9%.
Another significant trend is that the profit share of the Government segment has increased from 51% in 2019 to 55% in 2024, while the Commercial sector has dipped from 49% to 45% during the same period.
One notable reason for the much faster profit growth in the Government division is the increase in Government spending on national security and defense in recent years.
These initiatives has driven higher demand for Palantir’s data analytics and AI solutions in the government sector, and thereby the much higher profit growth in this segment.
In short, Palantir’s Government segment generates a much higher profit share and exhibits faster profit growth compared to the Commercial segment.
Profit Growth from Government and Commercial Segments
Palantir-profit-by-segment-growth-rates
(click image to expand)
The profits from Government and Commercial segments are evaluated based on the contribution profit. For your information, the contribution metric presented in the chart above is a profitability measure introduced by Palandir Technologies in its quarterly and annual reports.
It is a non-GAAP measure specifically created to evaluate performance, and also provides useful information to investors and others in understanding and evaluating operating results in the same manner as the management team.
The definition of the contribution and contribution margin is available here: contribution & contribution margin
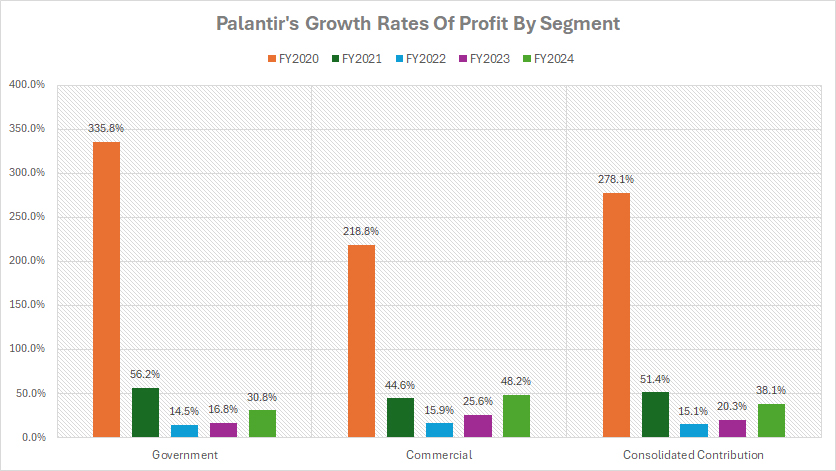
Palantir’s Commercial segment has experienced a slightly higher profit growth than the Goverment segment since fiscal year 2022.
Between fiscal year 2022 and 2024, the average annual growth rate of the profit of Palantir’s Commercial segment was 30%, while the figure came in at 21% for the Goverment division during the same period.
In fiscal year 2024, Palantir’s Commercial segment saw a significant profit growth than the Government sector, notably at 48.2% versus 30.8%.
On a consolidated basis, Palantir’s profit growth averaged 24.5% annually over the last three years.
A key observation is that Palantir’s profit growth accelerated again in fiscal year 2024 across all segments after experiencing slowdoen in prior years.
Profit Margin From Government And Commercial Segments
Palantir-profit-margin-by-segment
(click image to expand)
The profits from Government and Commercial segments are evaluated based on the contribution profit. For your information, the contribution metric presented in the chart above is a profitability measure introduced by Palandir Technologies in its quarterly and annual reports.
It is a non-GAAP measure specifically created to evaluate performance, and also provides useful information to investors and others in understanding and evaluating operating results in the same manner as the management team.
The definition of the contribution and contribution margin is available here: contribution & contribution margin
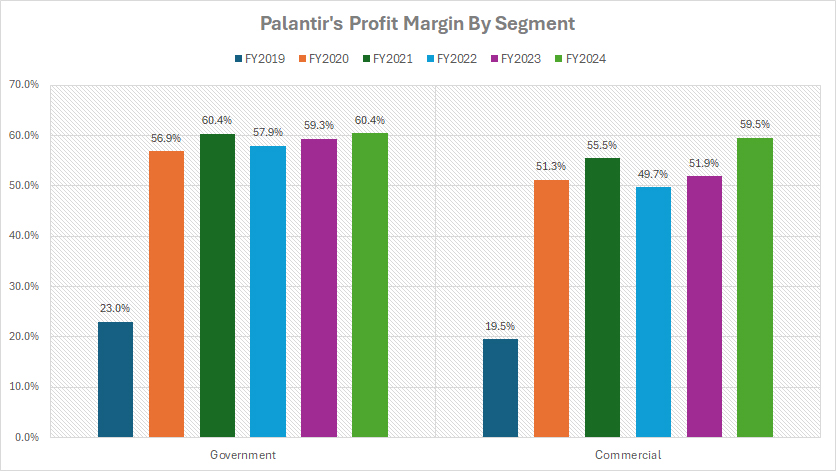
Palantir’s Government segment generates significantly higher profit margins than the Commercial segment, as shown in the chart above. In other words, Palantir’s Government division is slightly more profitable than the Commercial sector per every dollar of revenue earned.
In fiscal year 2024, Palantir produced a profit margin of 60.4% within the Government sector, while the profit margin of the Commercial sector was slightly lower at 59.5%.
On average, Palantir’s profit margin was 59% within the Government sector versus 54% within the Commercial sector over the last three years spanning fiscal year 2022 to 2024.
A notable explanation for the higher profit margin of Palantir’s Government division is its significantly greater pricing power in this business segment.
In general, Palantir’s Government segment can command higher prices due to the critical nature of the services provided, such as national security and defense. This higher pricing power contributes to better margins.
In addition, the Goverment sector tends to offer lower customer acquisition costs. Acquiring government clients typically involves lower marketing and sales expenses compared to the Commercial segment, where more effort and resources are needed to win new business.
Insight
Palantir Technologies has successfully transitioned from a period of operating losses to profitability, highlighting its strong revenue growth and efficiency improvements. The company’s financial transformation is largely driven by its Government segment, which continues to generate higher profits compared to its Commercial division.
Overall, Palantir’s strategic positioning in AI and big data analytics, particularly in national security applications, has solidified its financial strength. If its Commercial segment continues to expand, the company could further diversify its revenue streams and improve overall profitability
References and Credits
1. All financial figures presented were obtained and referenced from Palantir’s annual reports published on the company’s investor relations page: PLTR Financial Reports.
2. Pexels Images.
Disclosure
We may use artificial intelligence (AI) tools to assist us in writing some of the text in this article. However, the data is directly obtained from original sources and meticulously cross-checked by our editors multiple times to ensure its accuracy and reliability.
If you find the information in this article helpful, please consider sharing it on social media. Additionally, providing a link back to this article from any website can help us create more content like this in the future.
Thank you for your support and engagement! Your involvement helps us continue to provide high-quality, reliable content.

