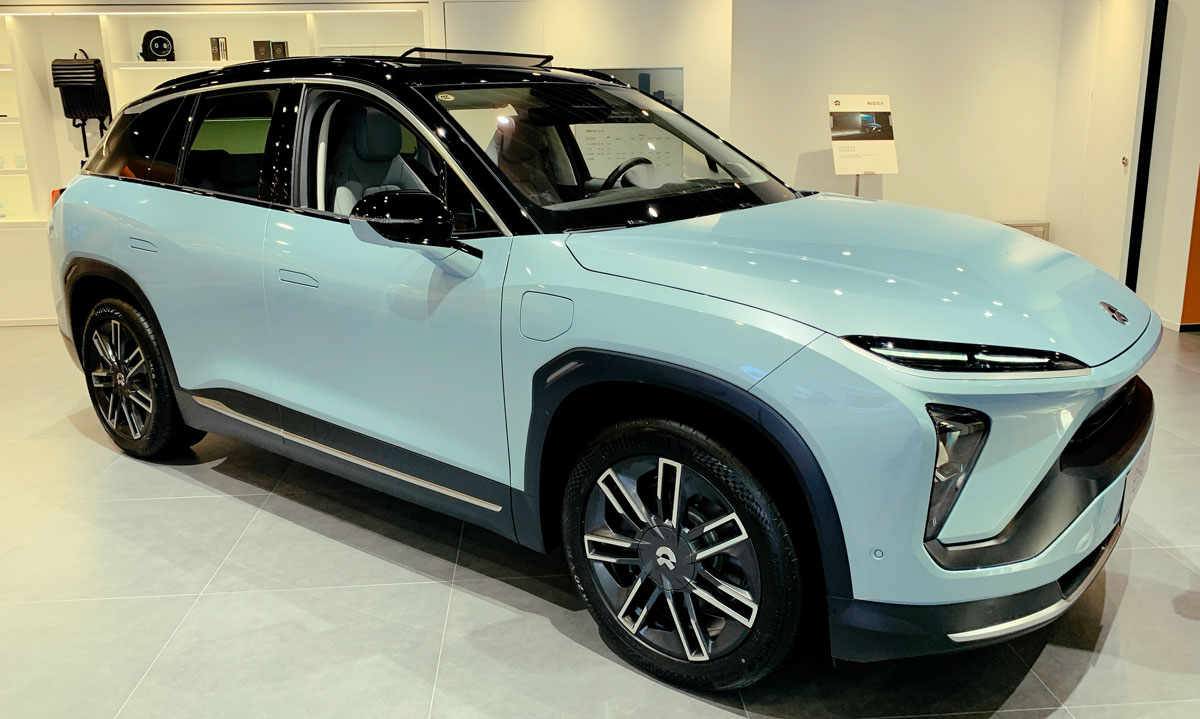
NIO ES6. Flickr Image.
Chinese electric vehicle (EV) companies have been making waves in the global automotive industry over the past few years. With a focus on innovation, technology, and sustainability, these companies have been challenging established players and disrupting traditional business models.
From established giants like BYD and Geely to newer startups like NIO and Xpeng, Chinese EV companies are gaining momentum and capturing a growing share of the global EV market.
In this article, we’ll look closely at some key statistics of Chinese EV makers such as Nio, Xpeng, and Li Auto. These include vehicle sales, revenue per car delivered, market valuation per vehicle, and growth rates.
We will use Tesla as a reference to see how far the Chinese EV makers have gone.
Let’s get started!
Please use the table of contents to navigate this page.
Table Of Contents
Definitions And Overview
O2. Chinese EV Makers Business Strategy
Worldwide Vehicle Sales
A1. Vehicle Deliveries By Year
A2. Vehicle Deliveries By Quarter
A3. Vehicle Deliveries By TTM
Growth Rates
B1. Worldwide Vehicle Sales YoY Growth Rates
Revenue Per Car
Valuation Per Car
D1. Latest Market Cap Per Vehicle
D2. Historical Market Cap Per Vehicle
Conclusion And Reference
S1. Conclusion
S2. References and Credits
S3. Disclosure
Definitions
To help readers understand the content better, the following terms and glossaries have been provided.
Revenue Per Vehicle: Revenue per vehicle is defined as:
Revenue Per Vehicle = Automotive Sales / Total Vehicles Delivered
Market Cap Per Vehicle: Market cap per vehicle is defined as:
Market Cap Per Vehicle = Market Cap / Total Vehicles Delivered
Chinese EV Makers Business Strategy
Chinese EV companies have adopted a business strategy focusing on innovation, technology, and sustainability. They aim to challenge established players in the global automotive industry by leveraging their expertise in electric vehicle technology and producing high-quality vehicles at competitive prices.
To achieve this, they invest heavily in research and development, build partnerships with technology companies, and expand their global reach through strategic alliances and acquisitions.
They are also investing in infrastructure, such as charging stations, to support the growth of the electric vehicle market. Overall, their goal is to disrupt traditional business models and capture a growing share of the global EV market.
Vehicle Deliveries By Year
worldwide-EV-deliveries-by-year
(click image to expand)
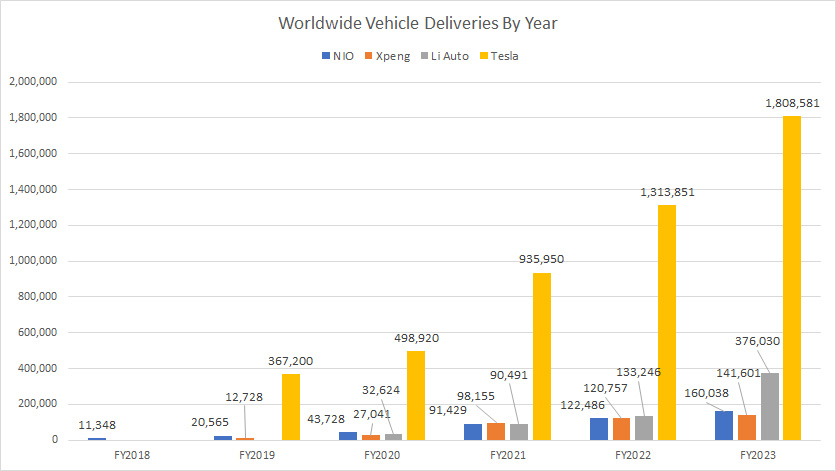
Tesla leads the pack when it comes to the sales of EVs. Chinese EV makers like Nio, Xpeng, and Li Auto still lag considerably behind Tesla.
While Li Auto’s EV deliveries have significantly increased over the years, its latest deliveries of 376,000 in 2023 were only about one-fifth of what Tesla delivered in the same year.
Similarly, vehicle deliveries of Nio and Xpeng lag further behind. They sold only 160,000 and 141,600 vehicles in 2023, much smaller than what Tesla sold in the same year.
Investors interested in Tesla’s vehicle sales may find more information on this page: Tesla Car Production And Sales By Models.
Vehicle Deliveries By Quarter
worldwide-EV-deliveries-by-quarter
(click image to expand)
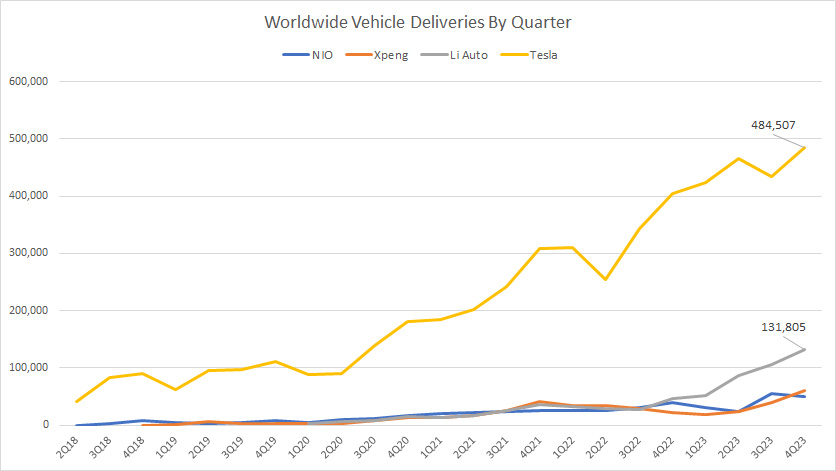
From a quarterly perspective, the gap between Tesla and Chinese EV companies such as Nio, XPeng, and Li Auto is still extremely wide.
For example, Tesla is on the cusp of delivering half a million vehicles per quarter, while most Chinese EV makers deliver less than 100,000 units.
An exception is Li Auto, whose sales have significantly improved in recent years, as shown in the chart above.
As seen, Li Auto’s vehicle sales have increased dramatically in the last several quarters and topped nearly 132,000 as of 4Q 2023.
Vehicle Deliveries By TTM
worldwide-EV-deliveries-by-ttm
(click image to expand)
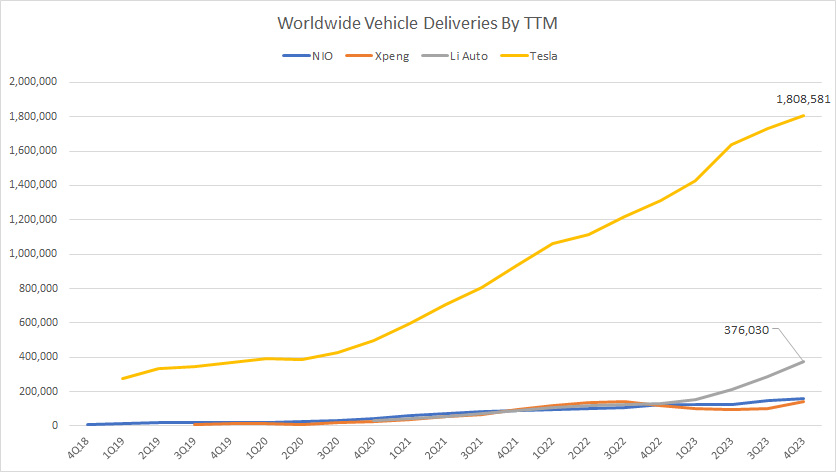
From a TTM perspective, Tesla leads the pack with a wide margin for worldwide EV sales.
Tesla’s TTM EV deliveries are closing in on the 2 million mark, while most Chinese EV companies in comparison are not even near 200,000 units.
However, Li Auto’s sales have significantly improved and are on the cusp of reaching 400,000 units on a TTM basis, about one-fifth of Tesla’s result.
Worldwide Vehicle Sales YoY Growth Rates
worldwide-EV-sales-YoY-growth-rates
(click image to expand)
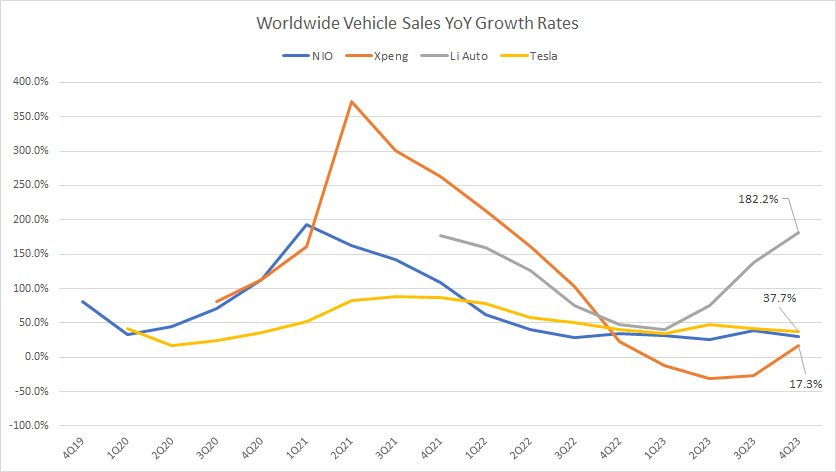
While Tesla leads most Chinese EV makers in vehicle sales, it is only secondary when it comes to growth rates.
For example, Li Auto beats Tesla and the rest of the Chinese EV makers in terms of EV sales growth.
Li Auto’s sales growth tops the chart at 182.2% and has significantly increased over the last several quarters.
On the other hand, Tesla’s global EV sales growth has declined to a record low of 37.7% as of 3Q 2023. Nio And Xpeng registered even slower growth than Tesla in the same quarter.
Among all EV companies in comparison, Li Auto is the only one that has registered an increase in sales growth in the past several quarters, while the rest, including Tesla, has been experiencing a decline in growth rates.
Revenue Per Vehicle
revenue-per-vehicle
(click image to expand)
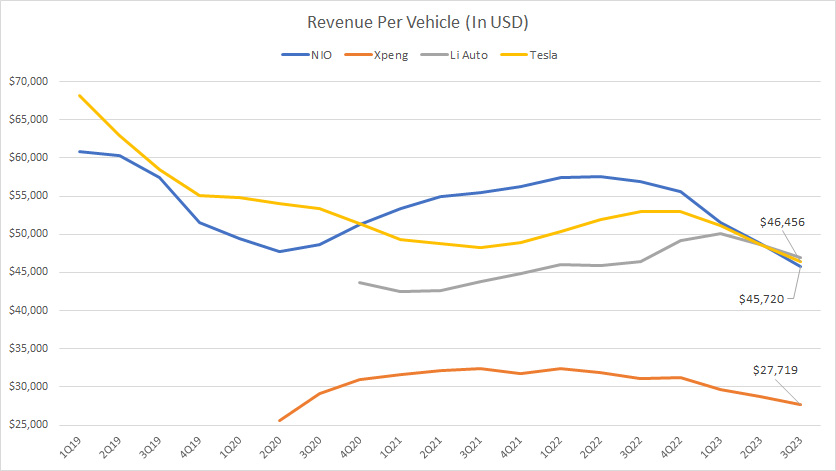
Tesla’s revenue per vehicle has significantly decreased over the years and was comparable to Chinese EV companies’ figures as of 3Q 2023.
As of 3Q 2023, Tesla’s revenue per vehicle came in at about US$46,000, roughly in line with Nio and Li Auto’s figures.
Xpeng registers the lowest revenue per vehicle among all EV companies in comparison. As of 3Q 2023, Xpeng’s revenue per vehicle reached a record low of US$27,700, about 40% lower than Tesla’s figure.
Investors interested in Tesla’s revenue per vehicle and revenue per employee may find more information on this page: Tesla Revenue Per Employee And Per Car.
Latest Market Cap Per Vehicle
| As Of Jan 2024 | |||
|---|---|---|---|
| Market Cap ($ Millions) | TTM Vehicles Delivered | Market Cap Per Vehicle Delivered ($ USD) | |
| EV Makers | |||
| Nio | $13,000 | 160,038 | $81,231 |
| Xpeng | $9,000 | 141,601 | $63,559 |
| Li Auto | $29,000 | 376,030 | $77,122 |
| Tesla | $600,000 | 1,808,581 | $331,752 |
Among all EV companies in comparison, Tesla commands the highest valuation at about US$332,000 per car delivered.
On the other hand, Xpeng’s market capitalization per car delivered was among the lowest at US$63,500, only about one-fifth of Tesla’s figure.
Each vehicle delivered for Li Auto and Nio contributes to about US$77,000 and US$81,000 in market capitalization, respectively.
Although Tesla’s market cap has significantly declined in recent quarters, it was still one of the highest-valued EV companies on a per-vehicle basis compared to Nio, Xpeng, and Li Auto.
Investors interested in Tesla’s price target and valuation vs. peers may find more information on this page: Tesla Price Target And Valuation Vs. Peers.
Historical Market Cap Per Vehicle
Historical market valuation per TTM vehicle delivered
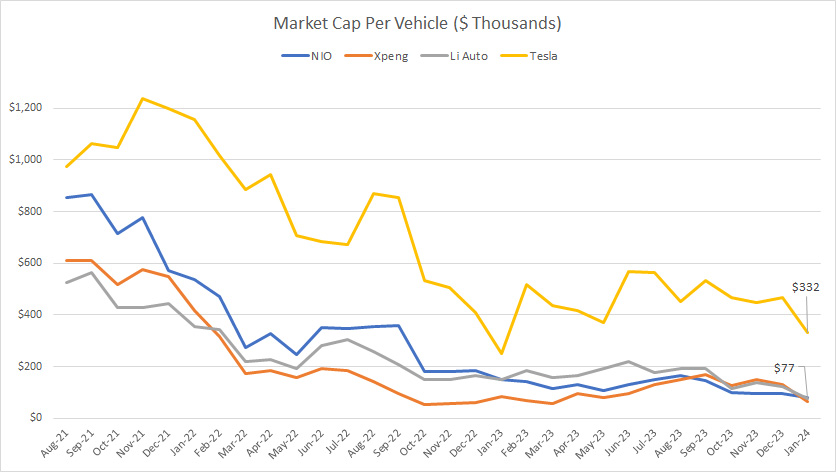
Since 2021, the market valuation per car for all EV makers in comparison has significantly decreased and reached a record low in 2024.
Tesla’s valuation per car has probably plunged the most, from a massive US$1,200 per vehicle sold in 2021 to US$332,000 per vehicle sold as of 2024.
Also, the market valuation per vehicle delivered for Nio, Xpeng, and Li Auto is nearly at the same level as of 2024 despite having a significantly significant market cap difference.
Conclusion
Tesla is still the leader in worldwide EV sales compared to Nio, Xpeng, and Li Auto.
No, Xpeng and Li Auto are still way behind Tesla.
However, Li Auto’s EV deliveries have been extremely impressive in recent years. The latest figure shows that Li Auto delivered nearly 400,000 vehicles on a TTM basis as of 4Q 2023.
In addition, most EV makers have reduced their selling prices, driving down their revenue per car sold. Tesla, Nio, Xpeng, and Li Auto have seen their revenue per vehicle decrease significantly over the years.
Tesla is the most valuable EV company compared to Nio, Xpeng, and Li Auto, with a market cap per vehicle sold reaching US$332,000 in 2024, about 4X higher than the numbers of Nio, Xpeng, and Li Auto.
References and Credits
1. All financial figures presented above were obtained and referenced from the respective quarterly and annual reports, SEC filings, investor letters, presentations, press releases, etc., which are available in the following links:
a) TeslaInvestor Relations
b) NIO Investor Relations
c) Xpeng Investor Relations
d) Li Auto Investors Overview
2. Featured images are used under Creative Common Licenses and obtained from NIO ES6 and NIO ES8 interior.
Disclosure
References and examples such as tables, charts, and diagrams are constantly reviewed to avoid errors, but we cannot warrant the total correctness of all content.
The content in this article is for informational purposes only and is neither a recommendation nor a piece of financial advice to purchase a stock.
If you find the information in this article helpful, please consider sharing it on social media and provide a link to this article from any website so that more articles like this can be created.
Thank you!

