Solar and wind power. Source: Flickr
Cash is king when it comes to doing business.
Cash keeps the business running by taking care of all the expenses and costs of doing business.
It is no exception for Chinese EV makers such as Li Auto, Nio and Xpeng.
In fact, cash is even more important for these asset-heavy companies where a short of liquidity may immediately spell trouble for their operations.
In this article, we are going to dive into the cash flow of the Chinese EV makers, including that of Tesla.
In this aspect, we will look at several cash metrics which include the operating cash flow, free cash flow, cash conversion ratio and net cash from operations.
From the cash metrics, we also will do a comparison among all Chinese EV companies with that of Tesla to find out which EV maker is the most efficient when it comes to producing and utilizing cash.
Let’s do it!
Tesla, Nio, Xpeng and Li Auto’s Cash Flow Topics
1. Operating Cash Flow
2. Cash Conversion Ratio
3. Free Cash Flow
4. Net Cash From Financing Activities
5. TTM Cash Metrics
6. Conclusion
Operating Cash Flow
| Net Cash From Operating Activities (US$ Millions) | ||||
|---|---|---|---|---|
| Fiscal Year | Tesla | Nio | Xpeng | Li Auto |
| 2018 | $2,099 | -$1,151 | NA | NA |
| 2019 | $2,405 | -$1,253 | NA | NA |
| 2020 | $5,943 | $299 | -$21 | $481 |
Let’s first look at the net cash from operating activities for all EV companies which are shown in the table above.
For your information, net cash from operating activities for EV companies involves only cash flow generated from business operations such as the design, manufacturing, distribution and selling of automotive products.
In Tesla’s case, its operating activities involve more than just automotive products as the company also has other core operations such as the energy sector.
That said, according to the table above, Tesla is at the top of the ranking when it comes to the amount of net cash from operating activities being generated.
In fiscal 2020 alone, Tesla’s net cash from operations reaches almost $6 billion USD which is double the amount reported in the prior year.
In addition, Tesla’s operating cash flow has not only been positive but also on the rise between fiscal 2018 and 2020.
In contrast, most Chinese EV makers are still burning cash as reflected by the negative figures in the chart.
However, the negative cash flow scenario has changed substantially in fiscal 2020 for most Chinese EV companies except for Xpeng whose net cash from operations was still in the red.
In fiscal 2020, Nio has managed to generate positive net cash from operations at $299 million USD while Li Auto’s figure has reached $481 million USD.
Although most Chinese EV makers’ operating cash flow is still far smaller than that of Tesla, they have progressed tremendously, especially for Nio.
Additionally, Li Auto also has made quite an impressive cash flow in fiscal 2020 at nearly half a billion USD.
That said, Li Auto is the best among all Chinese EV companies in terms of the amount of net cash from operating activities being produced.
Cash Conversion Ratio
| Cash Conversion Ratio (%) | ||||
|---|---|---|---|---|
| Fiscal Year | Tesla | Nio | Xpeng | Li Auto |
| 2018 | 9.8% | 0.0% | NA | NA |
| 2019 | 9.8% | 0.0% | NA | NA |
| 2020 | 18.8% | 12.0% | 0.0% | 33.2% |
In terms of cash conversion ratio, Tesla is again at the top of the ranking with at least 10% of its revenue being converted to operating net cash.
And, Tesla converted even more revenue to operating net cash at 19% in fiscal 2020, more than double the ratio reported in 2019.
Among all Chinese EV makers, Li Auto is the best at 33% while Nio’s figure clocked in at 12%.
Xpeng ranks at the bottom because it was still producing negative operating net cash in fiscal 2020.
In short, Li Auto is the most efficient EV company, even exceeded that of Tesla, in terms of cash conversion ratio.
Free Cash Flow
| Free Cash Flow (US$ Millions) | ||||
|---|---|---|---|---|
| Fiscal Year | Tesla | Nio | Xpeng | Li Auto |
| 2018 | -$2 | -$1,536 | NA | NA |
| 2019 | $1,078 | -$1,498 | NA | NA |
| 2020 | $2,786 | $126 | -$145 | $378 |
A discussion of the cash flow will be incomplete without including free cash flow.
Free cash flow is the cash leftover from operating net cash after accounting for capital expenditures.
Additionally, free cash flow is an important indicator of the underlying financial health of the business.
A positive free cash flow often means that the company can sustain itself without relying on external capital and hence, less capital raise in the form of debt or equity or both.
That said, based on the table above, Tesla is the leading EV automaker with free cash flow totaling as much as $2.8 billion USD in fiscal 2020.
For Chinese EV automakers, Li Auto produced as much as $378 million USD of free cash flow while Nio’s figure came to about $126 million USD in fiscal 2020.
Prior to 2020, Nio’s free cash flow had been mainly negative and totaled more than -$1 billion, indicating that the company had burned more cash than it had generated.
Despite being a small number at only $126 million USD, Nio’s positive free cash flow reported in fiscal 2020 represents a gigantic milestone for the company as it was the first positive figure in the history of the company.
In contrast, Xpeng was still burning as much as $145 million USD of free cash flow in 2020.
In short, Li Auto is among the best company in generating free cash flow despite being a newcomer in the EV space.
Net Cash From Financing Activities
| Net Cash From Financing Activities (US$ Millions) | ||||
|---|---|---|---|---|
| Fiscal Year | Tesla | Nio | Xpeng | Li Auto |
| 2018 | $574 | $1,688 | NA | NA |
| 2019 | $1,529 | $445 | NA | NA |
| 2020 | $9,973 | $6,338 | $5,261 | $3,787 |
The net cash from financing activities is a cash metric that measures whether the EV companies have taken any form of capital raise in any fiscal year.
The capital raise can be in the form of debt offerings or equity issuing or both.
However, I did not go into detail as to which capital raise method the EV companies have taken.
That said, the numbers in the table above just show the net amount of cash obtained from financing activities.
In this case, a positive number means that the company has basically obtained a cash injection whereas a negative number indicates a cash outflow that often goes into debt repayments.
Since all EV companies have not been paying cash dividends and executing stock buybacks, this scenario is true for all EV players for the last 3 years.
Based on the chart above, all EV companies, including Tesla, have obtained cash injections in the last 3 years as the net cash from financing activities has been positive since fiscal 2018.
In Tesla’s case, the company obtained a capital raise that totaled nearly $10 billion USD in fiscal 2020, more than 3X the amount of its free cash flow generated in the same fiscal year.
Similarly, Nio also has been getting external cash injections in the last 3 years but the amounts are slightly lower than that of Tesla at $6.3 billion USD reported in fiscal 2020.
Xpeng also obtained a boost in its cash at $5.3 billion USD in fiscal 2020.
Of all EV companies, Li Auto obtained the least amount of cash injection at only $3.4 billion USD in fiscal 2020.
TTM Cash Metrics
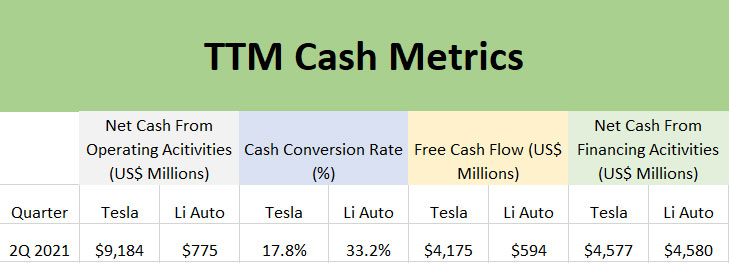
Tesla and Li Auto’s TTM cash metrics
The table above shows the TTM cash metrics of only Tesla and Li Auto.
Other EV makers such as Nio and Xpeng do not report their quarterly cash flow, and hence, their TTM cash metrics are missing in the table above.
That said, according to the table above, Tesla and Li Auto’s TTM cash metrics are nearly similar to that of the yearly metrics.
For example, Tesla and Li Auto’s cash conversion ratios clocked in at 18% and 33%, respectively, as of 2Q 2021 on a TTM basis.
These TTM figures are nearly the same as that of the yearly figures, illustrating their superior cash conversion capabilities.
Other than that, Tesla and Li Auto’s free cash flow has greatly improved as of 2Q 2021 on a TTM basis compared to the yearly figures.
For example, Tesla’s free cash flow totaled more than $4 billion USD while Li Auto’s figure reaches $600 million USD as of 2Q 2021, representing an increase of more than 50% for both companies.
Similarly, both companies’ net cash from operating activities has also greatly improved as of 2Q 2021 compared to the figures reported in 4Q 2020.
In short, Tesla and Li Auto are leading the packs in terms of cash flow generation while Nio and Xpeng are falling behind considerably and they did not even publish their quarterly cash flow.
Conclusion
Again, cash is king in the world of businesses.
Without cash, businesses will not last a single day.
Cash is even more important for companies such as EV makers as their liquidity needs are considerably higher given the nature of their businesses.
Therefore, if I have to choose one company to invest in among the Chinese EV makers, Li Auto will definitely be my first choice.
The reason is simple.
Li Auto is among the best Chinese company when it comes to producing and utilizing cash.
In addition, Li Auto also has been free cash flow positive from the day that it started trading its stock on the NYSE.
References and Credits
1. Financial figures for all companies discussed above were obtained and referenced from their respective financial statements which can be obtained from the following links:
a) Tesla Investor Relations
b) NIO Investor Relations
c) Xpeng Investor Relations
d) Li Auto Investors Overview
2. Featured images in this article are used under creative commons license and sourced from the following websites: AET Program Fall 2012 and green energy.
Top Statistics For Other Companies
Disclosure
The content in this article is for informational purposes only and is neither a recommendation nor a piece of financial advice to purchase a stock.
If you find the information in this article helpful, please consider sharing it on social media and also provide a link back to this article from any website so that more articles like this one can be created in the future. Thank you!

