General Motors. Pixabay Image
This article presents General Motors’ global sales and market share. GM’s global sales encompasses the company’s retail volumes, fleet sales, and vehicles used by dealers in their businesses.
More information about GM’s vehicle sales is available here: GM’s total vehicle sales. GM’s method of calculating its market share is shown here: GM’s market share calculation.
Let’s take a look.
For other sales statistics of General Motors, you may find more information on these pages:
Global Sales & Market Share
Wholesale
U.S. Sales
China Statistics
Please use the table of contents to navigate this page.
Table Of Contents
Definitions And Overview
O2. General Motors Business Strategy
O3. How Does General Motors Distribute Its Vehicles
Vehicle Sales
A1. Worldwide Vehicle Sales
A2. Growth Rates Of Worldwide Vehicle Sales
Market Share
A3. Worldwide Market Share
A4. Market Share Excluding Europe
Conclusion And Reference
S1. Conclusion
S2. References and Credits
S3. Disclosure
Definitions
To help readers understand the content better, the following terms and glossaries have been provided.
Total Vehicle Sales: General Motors defines its total vehicle sales as:
- retail sales (i.e., sales to consumers who purchase new vehicles from dealers or distributors);
- fleet sales (i.e., sales to large and small businesses, governments and daily rental car companies); and
- certain vehicles used by dealers in their business.
Total vehicle sales data includes all sales by joint ventures on a total vehicle basis, not based on the percentage ownership interest in the joint venture. Certain joint venture agreements in China allow for the contractual right to report vehicle sales of non-GM trademarked vehicles by those joint ventures, which are included in the total vehicle sales it reports for China.
While total vehicle sales data does not correlate directly to the revenue it recognizes during a particular period, GM believes it is indicative of the underlying demand for its vehicles.
Total vehicle sales data represents management’s good faith estimate based on sales reported by dealers, distributors and joint ventures; commercially available data sources such as registration and insurance data; and internal estimates and forecasts when other data is unavailable.
Market Share: General Motors defines its market share as the ratio of GM’s total vehicle sales to industry volume. The equation is as follow:
\[\text{Market Share} = ( \frac{\text{Total Vehicle Sales}}{\text{Industry Volume}} ) \times 100\%\]
General Motors Business Strategy
General Motors’ business strategy focuses on innovation, sustainability, and customer satisfaction. The company aims to be a leader in the automotive industry by developing and producing high-quality vehicles that meet customers’ evolving needs and preferences.
GM’s strategy also involves investing in new technologies, such as electric and autonomous vehicles, and collaborating with other companies to advance the industry.
Additionally, the company is committed to reducing its environmental footprint by implementing sustainable practices throughout its operations.
Overall, GM’s business strategy focuses on delivering value to its customers while driving long-term growth and profitability.
How Does General Motors Distribute Its Vehicles
General Motors distributes its vehicles through a network of dealerships located throughout the United States and around the world.
These dealerships are independently owned and operated, but they work closely with General Motors to ensure that customers have access to the latest models and technologies.
This article, GM competitive advantage , provides extensive coverage of General Motors’ network of dealerships.
General Motors also sells its vehicles online through its website, allowing customers to research, customize, and purchase vehicles from the comfort of their homes.
Additionally, General Motors offers leasing and financing options to help customers get behind the wheel of their dream car.
Worldwide Vehicle Sales
general-motors-worldwide-vehicle-sales
(click image to expand)
More information about how GM measures its vehicle sales is available here: total vehicle sales.
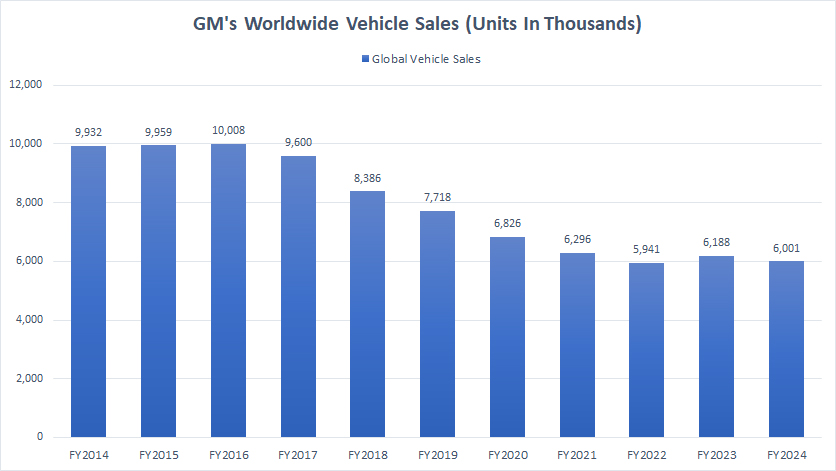
General Motors (GM) reported global vehicle sales of 6.0 million units for fiscal year 2024, representing a 3% decline compared to the 6.2 million vehicles sold in 2023. This latest figure is, however, relatively consistent with GM’s sales performance in 2022.
Interestingly, the fiscal year 2024 result marked a slight increase compared to the company’s performance in 2022 — a small yet notable break in the downward trend that GM has faced for several years.
Since reaching its peak vehicle sales of 10 million units in 2016, GM’s worldwide sales have been steadily declining. Historically, the company had enjoyed the distinction of selling approximately 10 million vehicles annually, a significant benchmark for any automotive giant.
However, fiscal year 2024 reflects a substantial reduction in sales volume, with the company delivering only 6 million vehicles — a sharp contrast to its high point just eight years earlier.
This persistent decline underscores the challenges GM faces in a competitive automotive landscape, marked by shifting consumer preferences, increased competition from both established manufacturers and new entrants, and the accelerating shift toward electric and sustainable mobility solutions.
It remains to be seen whether GM can stabilize or reverse this downward trend in the coming years as it navigates industry transformations.
Growth Rates Of Worldwide Vehicle Sales
general-motors-worldwide-vehicle-sales-growth-rates
(click image to expand)
More information about how GM measures its vehicle sales is available here: total vehicle sales.
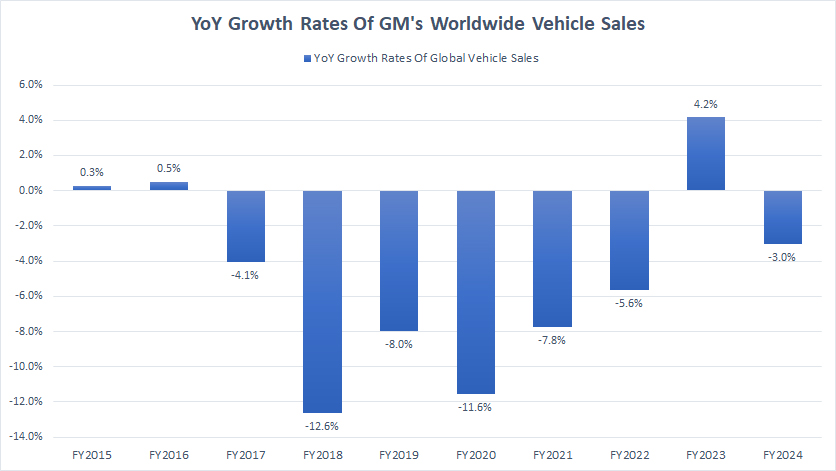
The growth rate plot above highlights GM’s stagnant performance in global vehicle sales, with the company struggling to achieve consistent growth in recent years.
From a broader perspective, the majority of fiscal years during this period reflect a downward trajectory in GM’s worldwide vehicle sales. The lone exception was 2023, which stands out as a year of modest recovery.
In 2023, GM recorded a sales increase of 4.2%, marking the first instance of positive growth since 2017. This uptick, though encouraging, was not sufficient to reverse the ongoing challenges faced by the company.
On average, GM’s global vehicle sales declined by approximately 4% annually between fiscal year 2020 and 2024 (5-year period).
This steady decline underscores the hurdles GM continues to face within an intensely competitive automotive landscape, where evolving consumer preferences, technological disruption, and the transition to electric vehicles are reshaping the industry dynamics.
The downward trend also highlights the need for strategic adjustments if GM aims to stabilize or reignite its sales growth in the years ahead.
Worldwide Market Share
general-motors-worldwide-market-share
(click image to expand)
More information about how GM measures its market share is available here: market share.
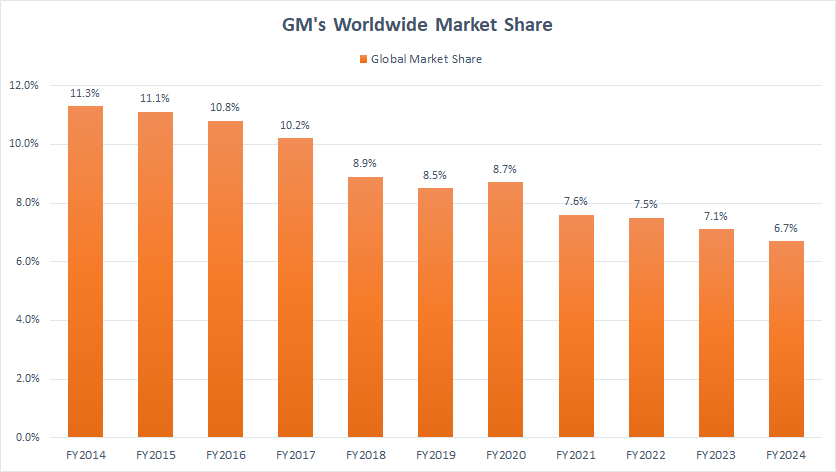
On a global scale, GM’s market share dropped to 6.7% as of fiscal year 2024, a modest decline from the 7.1% recorded in 2023, and the lowest level ever reported over the past decade. This downward movement aligns with a broader trend that has plagued GM’s market share over the years.
One critical observation is the stark contraction of GM’s global market share since 2014, when it stood at a robust 11.3%. Over the past decade, GM has faced consistent erosion in its market position, culminating in the record low of 6.7% reported in the latest fiscal year.
This decline is indicative of a challenging competitive landscape and reflects a persistent struggle to maintain its foothold amid changing industry dynamics, evolving consumer preferences, and intensifying competition from both legacy automakers and emerging electric vehicle manufacturers.
The downward trajectory appears relentless, with no immediate signs of stabilization or reversal. GM’s market share has been steadily shrinking, underscoring the urgency for strategic initiatives to regain momentum.
Whether through innovative product offerings, increased focus on electrification, or bolstering its global presence, GM will need to address these challenges decisively to halt the ongoing slide. Without substantial changes, GM risks further erosion of its competitive edge in an industry undergoing rapid transformation.
Market Share Excluding Europe
general-motors-worldwide-market-share-excluding-europe
(click image to expand)
More information about how GM measures its market share is available here: market share.
For decades, GM maintained a strong presence in Europe through well-established brands like Opel, Vauxhall, and Chevrolet, which were widely sold across the region. However, in a strategic shift in 2017, General Motors exited the European market by divesting its European subsidiary. This marked a significant turning point, fundamentally altering GM’s global footprint.
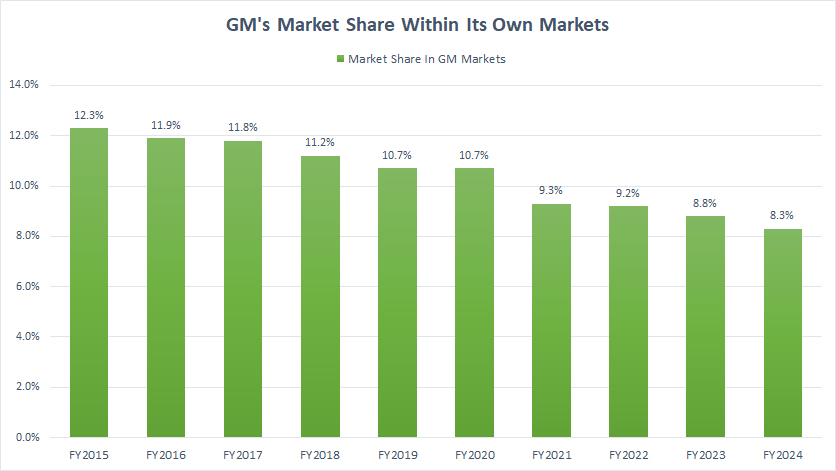
As a direct consequence of this exit, GM’s market share in Europe essentially evaporated. Meanwhile, on a global scale — excluding Europe —GM’s market share continued to decline, reaching 8.3% in fiscal year 2024. This figure reflects a decrease from the 8.8% reported in 2023 and is the lowest level of global market share the company has recorded over the past decade.
Historically, GM’s market share outside of Europe consistently exceeded the 10% threshold. For instance, in 2014, it reached a formidable 12.3%, one of the highest levels ever achieved by the company. This strong performance underscored GM’s dominant position in key global markets. However, since that peak in 2014, the company’s market share has been on a steady downward trajectory, culminating in the record low reported in 2024.
This sustained decline highlights the challenges GM faces in maintaining its competitiveness amid evolving market dynamics. Factors such as intensifying competition from global rivals, the rapid adoption of electric vehicles, and the emergence of new market players have likely compounded this trend. Unless GM successfully addresses these challenges with robust strategies and innovation, its global market share may continue to erode further in the years ahead.
Conclusion
In summary, GM’s recent performance underscores a critical juncture for the company. The combination of declining sales, shrinking market share, and challenges in a transforming industry paints a picture of a legacy automaker in need of reinvention. Without bold strategic moves, GM risks falling further behind in an increasingly competitive and electrified automotive landscape.
Credits and References
1. All sales and market share figures presented were obtained and referenced from General Motors’ annual reports published on the company’s investor relations page: GM Sec Filings.
2. Flickr Images.
Disclosure
We may use artificial intelligence (AI) tools to assist us in writing some of the text in this article. However, the data is directly obtained from original sources and meticulously cross-checked by our editors multiple times to ensure its accuracy and reliability.
If you find the information in this article helpful, please consider sharing it on social media. Additionally, providing a link back to this article from any website can help us create more content like this in the future.
Thank you for your support and engagement! Your involvement helps us continue to provide high-quality, reliable content.


Thanks for these great graphs and analysis! America is losing and in retreat on every front, it seems!
Superb! The article on General Motors’ vehicle sales and market share offers a comprehensive and insightful analysis of the company’s global performance.