Ford Mustang. Pixabay Image
Ford Motors (NYSE: F) presents two types of vehicle sale numbers:
(2) vehicle retail sales.
This article presents only Ford’s vehicle wholesale.
Investors interested in Ford Motor’s retail sales may find more information on this page: Ford global sales and market share.
Let’s take a look at Ford’s vehicle wholesale.
Please use the table of contents to navigate this page.
Table Of Contents
Definitions And Overview
O2. How Does Ford Distribute Its Vehicles?
Consolidated Results
B1. Vehicle Wholesale By Year
B2. Vehicle Wholesale By Quarter
B3. Vehicle Wholesale By TTM
Global Vehicle Sales Growth
B4. Growth Rates Of Vehicle Wholesale By TTM
Revenue Per Vehicle Sold
B5. Vehicle Average Selling Price
Results By Segment
C1. Ford Blue, Ford Model e, And Ford Pro Sales By Year
C2. Ford Blue, Ford Model e, And Ford Pro Sales By Year In Percentage
C3. Growth Rates Of Ford Blue, Ford Model e, And Ford Pro Sales
Results By Region
D1. North America, South America, Europe, And China Vehicle Sales
D2. North America, South America, Europe, And China Vehicle Sales In Percentage
Results By Country
D3. U.S., China, Canada, U.K., Germany, Turkey, Italy, And France Vehicle Sales
D4. U.S., China, Canada, U.K., Germany, Turkey, Italy, And France Vehicle Sales In Percentage
Worldwide Electric Vehicle Sales Results
E1. EV Sales By Year
E2. EV Sales By Year In Percentage
E3. Growth Rates Of Global EV Sales
U.S. Only Results
G1. Trucks, SUVs, And Cars Sales
G2. Trucks, SUVs, And Cars Sales In Percentage
G3. EV, Hybrid, And ICE Vehicle Sales
G4. EV, Hybrid, And ICE Vehicle Sales In Percentage
Conclusion And Reference
S1. Conclusion
S2. References and Credits
S3. Disclosure
Definitions
To help readers understand the content better, the following terms and glossaries have been provided.
Vehicle Wholesale: Wholesale unit volumes include sales of medium and heavy trucks. Wholesale unit volumes also include all Ford and Lincoln badged units (whether produced by Ford or by an unconsolidated affiliate) that are sold to dealerships or others, units manufactured by Ford that are sold to other manufacturers, units distributed by Ford for other manufacturers, local brand units produced by its unconsolidated Chinese joint venture Jiangling Motors Corporation, Ltd. (“JMC”) that are sold to dealerships or others, and from the second quarter of 2021, Ford badged vehicles produced in Taiwan by Lio Ho Group.
Vehicles sold to daily rental car companies that are subject to a guaranteed repurchase option (i.e., rental repurchase), as well as other sales of finished vehicles for which the recognition of revenue is deferred (e.g., consignments), are also included in wholesale unit volumes.
Revenue from certain vehicles in wholesale unit volumes (specifically, Ford badged vehicles produced and distributed by its unconsolidated affiliates, as well as JMC brand vehicles) are not included in Ford’s revenue.
Ford Blue: Starting in fiscal 2023, Ford has reorganized its reportable segments into new segments which include the Ford Blue.
In simple terms, Ford Blue is Ford’s legacy business responsible for developing and selling Ford and Lincoln internal combustion engines (“ICE”) and hybrid vehicles. Besides developing and selling new vehicles, Ford Blue also produces and sells service parts, accessories, and digital services to retail customers.
Iconic gas and hybrid vehicles developed under Ford Blue include the F-150, Bronco, and Mustang.
Ford Model e: Ford Model e is another new segment created in fiscal 2023 and is responsible for the development and sale of electric vehicles (EV).
Apart from EVs, Ford Model e also designs and creates digital vehicle technologies, which include embedded software as well as all of Ford’s electric architecture.
Ford Model e operates in North America, Europe, and China.
Ford Pro: Ford Pro is responsible for the sale of Ford and Lincoln ICE, hybrid, and electric vehicles, service parts, accessories, and services to commercial, government, and rental customers.
In other words, Ford Pro focuses mainly on fleet sales to customers with large orders, such as those from commercial sectors, government, and rental companies.
Ford Pro’s vehicles sold in North America include the Super Duty and the Transit range of vans. In Europe, Ford Pro’s flagship vehicles include the Ranger. Ford Pro operates primarily in North America and Europe.
Revenue Per Vehicle: Revenue per vehicle is a financial metric that represents the amount of money a dealership or auto manufacturer earns for each vehicle it sells. It is calculated by dividing the total revenue generated from vehicle sales by the total number of vehicles sold during a specific period.
Companies often use this metric to assess their profitability and make decisions related to pricing, inventory management, and sales strategies. A high revenue per vehicle sold indicates that a company generates more revenue from each sale and is more profitable.
How Does Ford Distribute Its Vehicles?
Ford distributes its vehicles, parts, and accessories through distributors and dealers (collectively, “dealerships”), most of which are independently owned.
At December 31, the approximate number of dealerships worldwide distributing Ford’s vehicle brands was as follows:
Ford’s number of dealerships worldwide as at Dec 31.
| Brands | Dealerships Worldwide | |
|---|---|---|
| 2022 | 2023 | |
| Ford | 8,596 | 8,639 |
| Ford-Lincoln Combined | 607 | 503 |
| Lincoln | 408 | 385 |
| Total | 9,611 | 9,527 |
Vehicle Wholesale By Year
ford-vehicle-wholesale-by-year
(click image to expand)
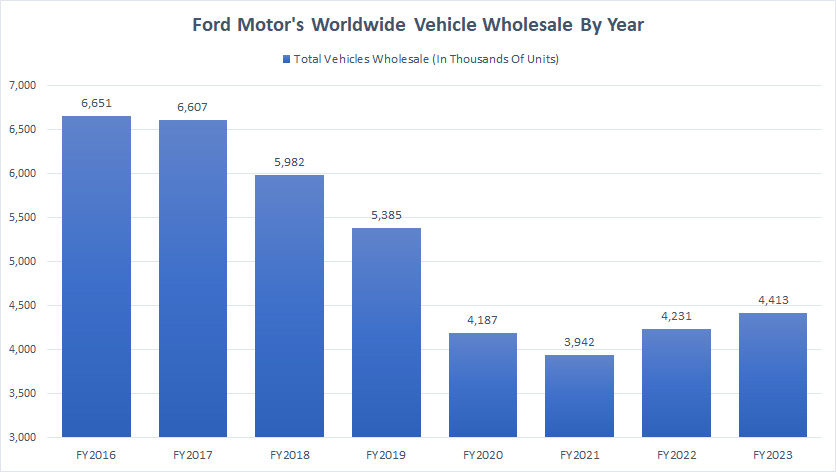
You can find the definition of Ford’s vehicle wholesale here: vehicle wholesale. Ford delivered 4.4 million vehicles worldwide in fiscal 2023, up 4% over 2022 or 12% over 2021.
Ford’s vehicle wholesale has significantly recovered since hitting the bottom in 2021 at 3.9 million deliveries.
Despite the significant recovery in post-COVID periods, Ford’s global vehicle sales were still relatively low compared to historical highs.
For example, Ford used to deliver over 6 million vehicles per annum in fiscal 2016 and 2017.
Vehicle Wholesale By Quarter
ford-vehicle-wholesale-by-quarter
(click image to expand)
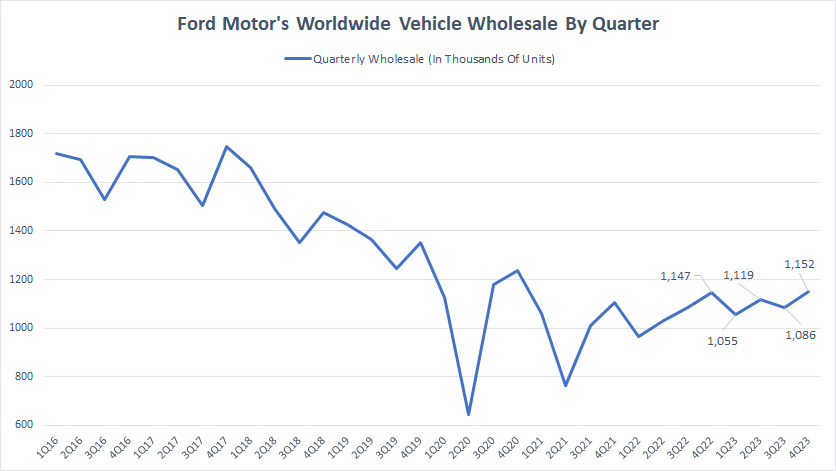
You can find the definition of Ford’s vehicle wholesale here: vehicle wholesale. Ford delivered 1.15 million, 1.09 million, and 1.12 million vehicles globally in fiscal 4Q, 3Q, and 2Q 2023, respectively.
The quarterly vehicle wholesale of 1.15 million units in 4Q 2023 represents a rise of 0.4% over the same quarter a year ago.
Vehicle Wholesale By TTM
ford-vehicle-wholesale-by-ttm
(click image to expand)
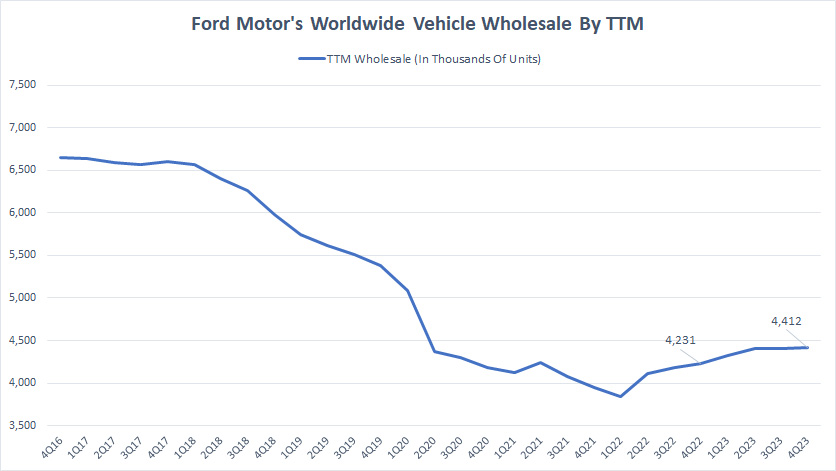
You can find the definition of Ford’s vehicle wholesale here: vehicle wholesale. Ford’s vehicle wholesale has recovered in post-COVID time, reaching 4.4 million vehicles as of 4Q 2023 on a TTM basis, up 4% from a year ago.
Before the COVID period, Ford Motor hardly had any sales growth.
Growth Rates Of Vehicle Wholesale By TTM
ford-vehicle-wholesale-by-ttm-growth-rates
(click image to expand)
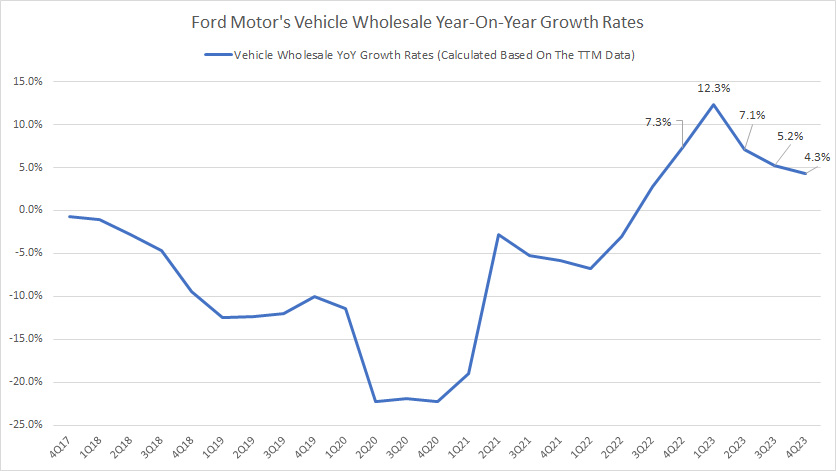
Ford’s vehicle sales growth has significantly recovered after the pandemic since 2020.
Before 2020, Ford hardly had any sales growth, as most figures were negative.
Although vehicle wholesale growth rates have recovered post-pandemic, they are mainly in the single digits. Ford’s vehicle wholesale growth rates averaged only 7% for the past four quarters.
Vehicle Average Selling Price
Ford vehicle average selling price
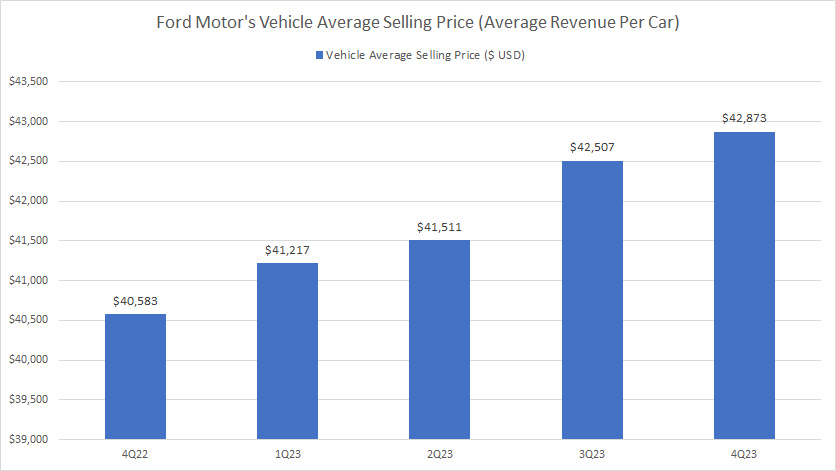
The average selling price or ASP depicts Ford’s vehicles’ average revenue or sale price. The definition of revenue per vehicle is available here: revenue per vehicle.
Ford’s vehicle average sale price has significantly increased since fiscal 4Q 2022. As of 4Q 2023, Ford’s vehicle average sale price landed at nearly US$43,000 per car, up 6% from a year ago.
For your information, Ford’s vehicle ASP is roughly in line with GM’s vehicle average sales price, which arrived at US$40,000 per vehicle as of 2022.
Compared to Tesla’s ASP, Ford’s ASP is much lower, as depicted in this article – Tesla Revenue Per Vehicle.
Ford Blue, Ford Model e, And Ford Pro Sales By Year
ford-vehicle-wholesale-by-segment
(click image to expand)
You can find the definition of Ford Blue, Ford Model e, and Ford Pro here: Ford Blue, Ford Model e, and Ford Pro.
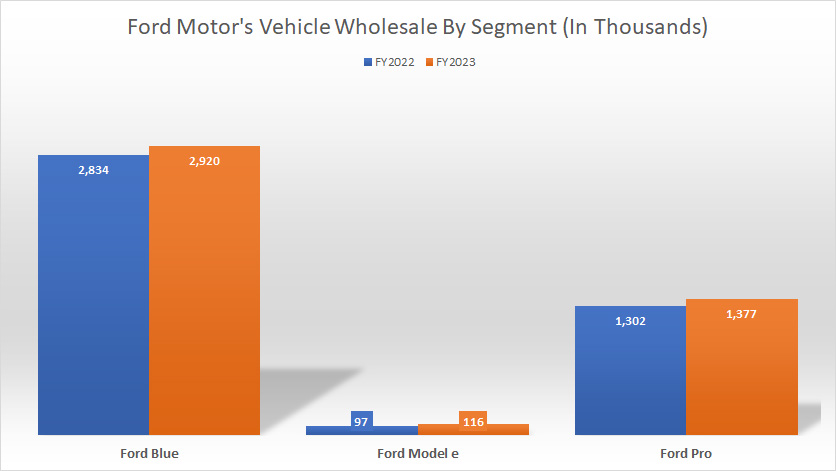
For your information, Ford Blue, Ford Model e, and Ford Pro are new segments created in 2023. Therefore, the 2022 wholesale results are a recast.
That said, Ford Blue delivered 2.9 million and 2.8 million vehicles in fiscal 2023 and 2022, respectively, the largest among all segments.
On the other hand, Ford Model e shipped only 116,000 and 97,000 vehicles in fiscal 2023 and 2022, respectively, the lowest among all segments.
Ford Pro’s sales landed at nearly 1.4 million vehicles in fiscal 2023, up 6% over 2022.
Ford Blue, Ford Model e, And Ford Pro Sales By Year In Percentage
ford-vehicle-wholesale-by-segment-in-percentage
(click image to expand)
You can find the definition of Ford Blue, Ford Model e, and Ford Pro here: Ford Blue, Ford Model e, and Ford Pro.
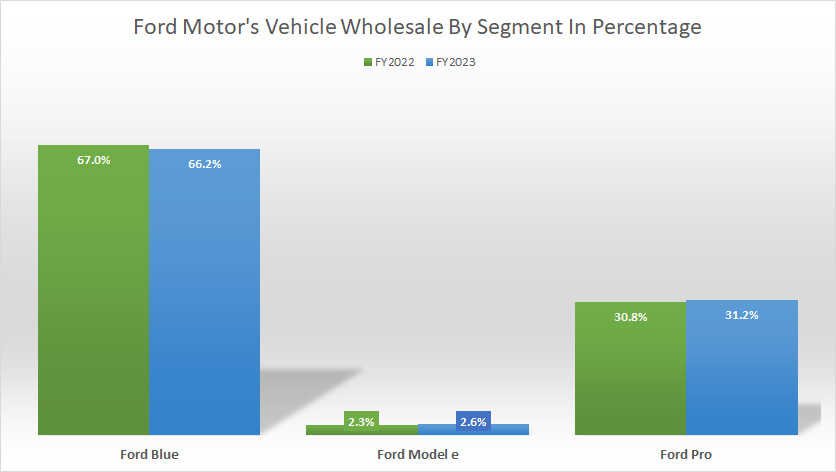
From a percentage perspective, Ford Blue’s vehicle wholesale in fiscal 2023 accounted for roughly 66% of the company’s total volume, the highest among all segments.
On the other hand, Ford Pro, which deals primarily with fleet sales for commercial customers, contributed over 31% of sales volume in fiscal 2023.
Ford Model e’s vehicle wholesale in fiscal 2023 formed only 2.6% of Ford’s total sales volume, up slightly over 2022.
Growth Rates Of Ford Blue, Ford Model e, And Ford Pro Sales
ford-vehicle-wholesale-by-segment-in-ttm-growth-rates
(click image to expand)
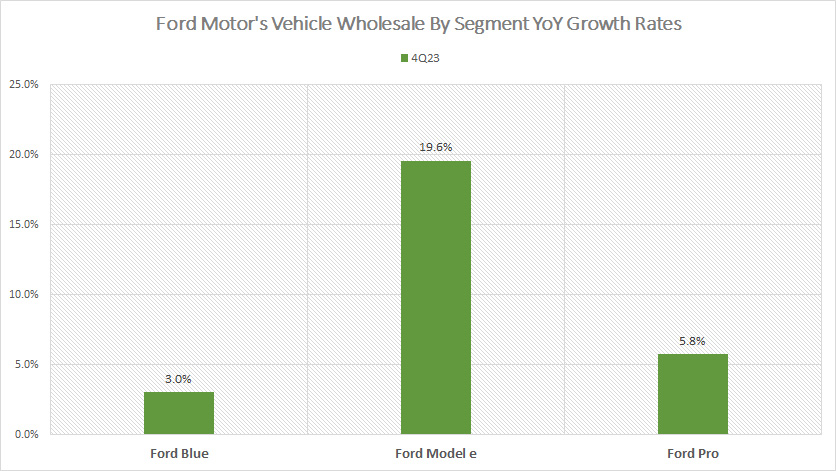
Among all segments, Ford Model e’s vehicle sales grew the most as of fiscal 4Q 2023, remarkably at 19.6% year-on-year while other segments registered low single-digit growth.
Ford Blue’s vehicle sales growth came in at 3% year-on-year in fiscal 2023, while Ford Pro delivered sales growth of 5.8% in the same year.
North America, South America, Europe, And China Vehicle Sales
ford-vehicle-wholesale-by-region-and-country
(click image to expand)
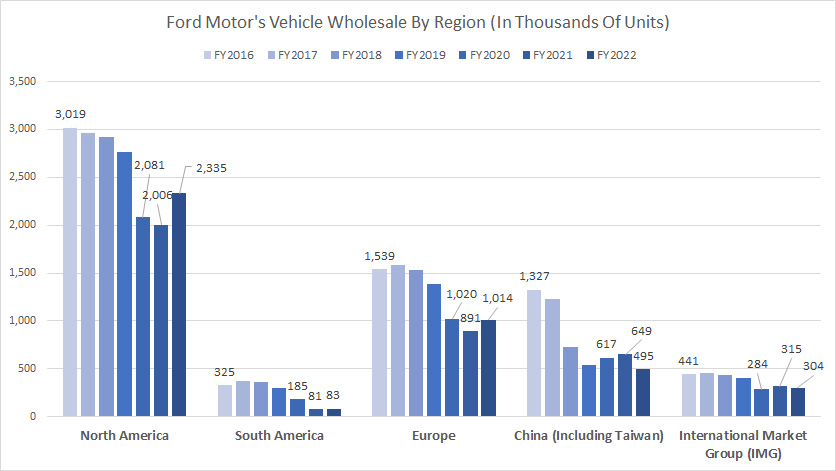
Ford no longer provides vehicle wholesale by region data. The data was last reported in fiscal 2022 and is now considered legacy reporting.
That said, Ford delivers most of its vehicles in North America, with figures coming in at more than 2 million units yearly.
In fiscal 2022, Ford’s North America vehicle wholesale totaled 2.3 million units, up roughly 16% from the previous year but down considerably from fiscal 2016.
Europe is Ford’s second-largest market after North America, with vehicle wholesale clocking at roughly 1 million units per year. In fiscal 2022, Ford sold 1 million vehicles in Europe, up 14% over 2021 but down 34% from 2016.
China is Ford’s third largest market in terms of vehicle wholesale by region. In fiscal 2022, Ford shipped about 500,000 vehicles in China, down considerably from 1.3 million in 2016.
Lastly, Ford delivered fewer vehicles in South America, at less than 100,000 units in fiscal 2022.
A noticeable trend is that Ford’s sales have significantly declined in most regions, particularly in China and South America, whose vehicle sales have been cut by more than half since 2016.
North America, South America, Europe, And China Vehicle Sales In Percentage
ford-vehicle-wholesale-by-region-and-country-in-percentage
(click image to expand)
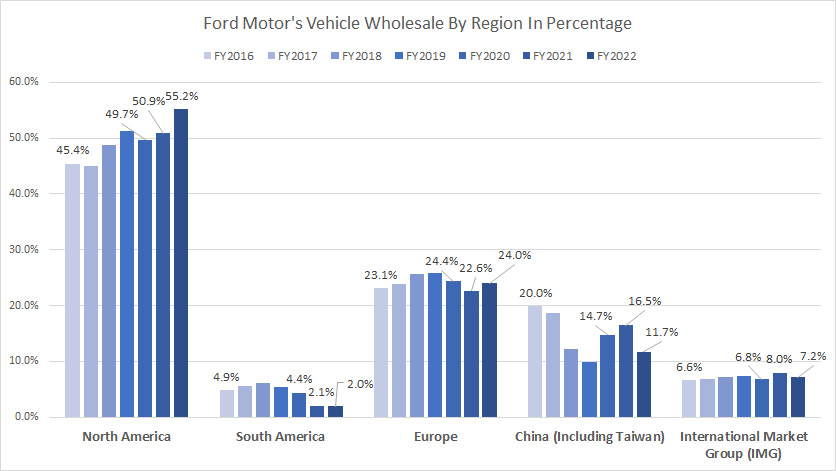
Ford no longer provides vehicle wholesale by region data. The data was last reported in fiscal 2022 and is now considered legacy reporting.
Ford’s vehicle wholesale in North America accounts for the bulk of the company’s wholesale volume, totaling over 55% in fiscal 2022. Since 2016, the ratio has significantly risen from 45% in 2016 to 55% as of 2022.
Ford’s Europe contributed 24% of vehicle volume in fiscal 2022, the second largest after North America. This ratio has remained roughly the same since 2016.
China is Ford’s third biggest market in sales volume by region. It comprised nearly 12% of its total wholesale volume in fiscal 2022.
However, Ford’s wholesale percentage in China decreased from 20% in 2016 to only 12% as of 2022, demonstrating that the decline in sales in this region has been much worse than in other regions.
Lastly, Ford’s South America contributed just 2% of sales to the company’s total volume in 2022, the smallest among all regions.
International Market Group, or IMG, made up about 7% of Ford’s global wholesale volume in 2022.
U.S., China, Canada, U.K., Germany, Turkey, Italy, And France Vehicle Sales
ford-vehicle-wholesale-by-country
(click image to expand)
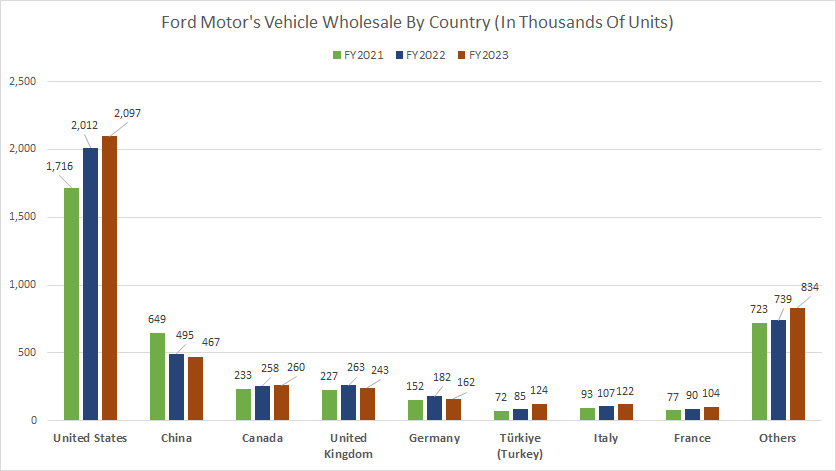
Ford still provides vehicle wholesale by country data, as presented in the chart above.
That said, Ford delivered 2 million vehicles in the U.S. in fiscal 2023, up 4% over 2022 and 22% over 2021. The U.S. is Ford Motor’s largest market by sales volume.
China is Ford’s second-largest market in terms of vehicle wholesale by country. In fiscal 2023, Ford shipped 467,000 vehicles in China, down 6% over 2022 and 28% over 2021.
Ford shipped about 260,000 and 243,000 vehicles in Canada and the United Kingdom, respectively, in fiscal 2023. Ford’s vehicle wholesale in Germany reached 162,000 units as of 2023, while the volume in Turkey landed at 124,000 in the same period, nearly double the figure in 2021.
Ford’s wholesales in Italy and France have significantly improved since 2021, reaching 122,000 and 104,000 vehicles, respectively, as of 2023.
A noticeable trend is that Ford’s vehicle wholesale for major European countries has greatly recovered over the past three years, while its results in China have deteriorated during the same period.
Moreover, Ford’s sales in the U.S. and Canada have also significantly increased since fiscal year 2021.
U.S., China, Canada, U.K., Germany, Turkey, Italy, And France Vehicle Sales In Percentage
ford-vehicle-wholesale-by-country-in-percentage
(click image to expand)
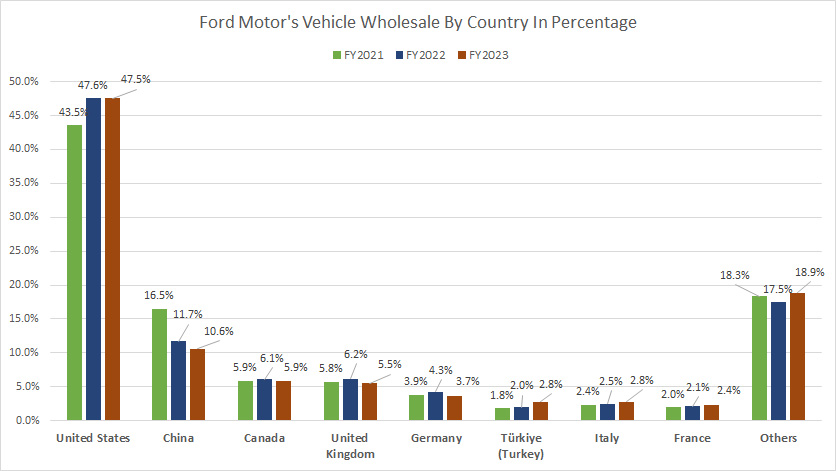
From a percentage perspective, Ford’s sales in the U.S. made up 47.5% of its total wholesale volume in fiscal 2023, up significantly from 43.5% in 2021 but in line with 2022’s result.
Ford’s ratio in China declined to 10.6% as of 2023, down considerably from 16.5% in 2021.
For most European countries, the percentage figures have remained relatively flat, while the results in Turkey have increased from 1.8% in 2021 to 2.8% in 2023.
EV Sales By Year
ford-electric-vehicle-wholesale-by-year
(click image to expand)
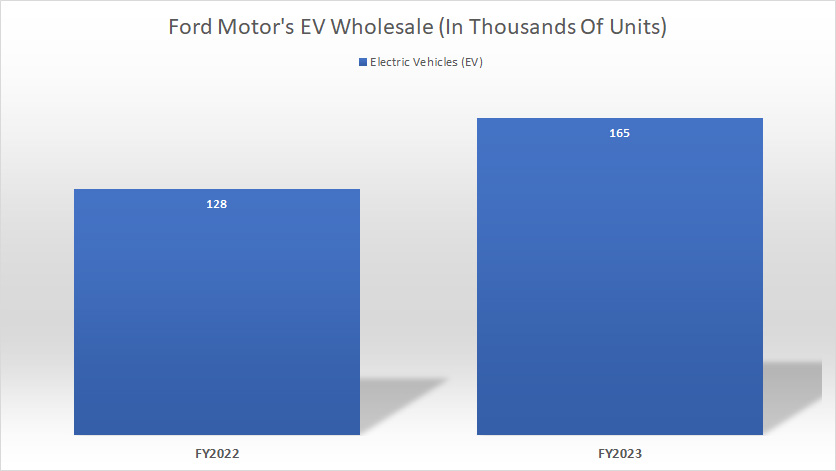
Ford only started breaking down its EV wholesale data in fiscal 2023, with 2022 data being a recast.
Ford sold 165,000 electric vehicles globally in fiscal 2023, up significantly from 128,000 EVs in 2022. Ford’s global EV wholesale comprises the EVs from Ford Model e and Ford Pro. The definitions of Ford Model e and Ford Pro are available here: Ford Model e and Ford Pro.
Investors interested in Ford’s EV sales by car models may find more information on this page: Ford’s EV sales by model.
EV Sales By Year In Percentage
ford-electric-vehicle-wholesale-by-year-in-percentage
(click image to expand)
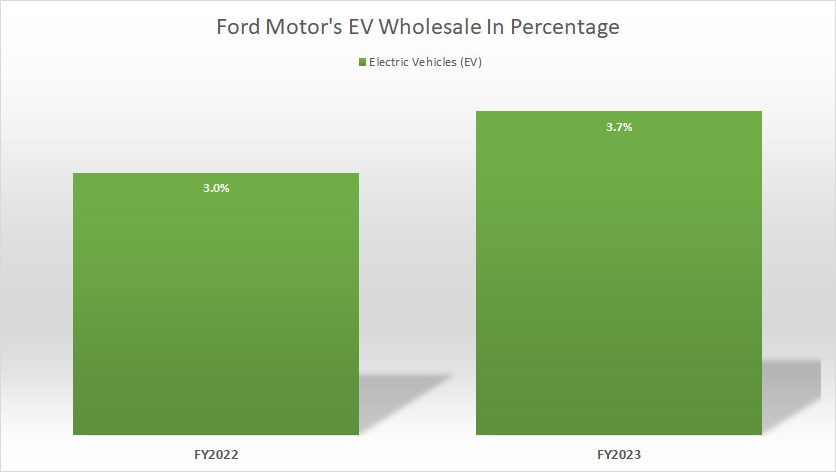
From the percentage perspective, Ford’s worldwide electric vehicle sales in fiscal 2023 accounted for only 3.7% of the company’s total wholesale volume, up from 3.0% in 2022.
Growth Rates Of Global EV Sales
ford-electric-vehicle-wholesale-by-ttm-growth-rates
(click image to expand)
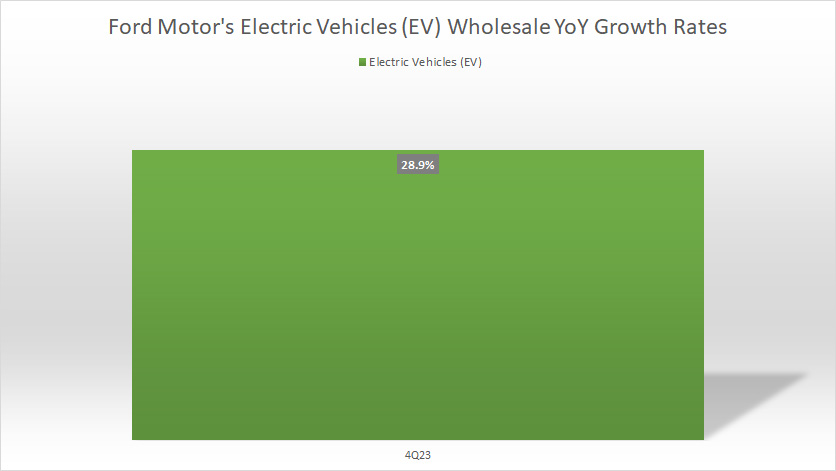
Ford’s 2023 electric vehicle wholesale grew 29% year-over-year, a much higher growth compared to the growth of the company’s global vehicle volume, which came in at only 4% as of 4Q 2023, as presented in this section: global sales growth.
Trucks, SUVs, And Cars Sales
ford-vehicle-wholesale-in-the-u.s.-by-type
(click image to expand)
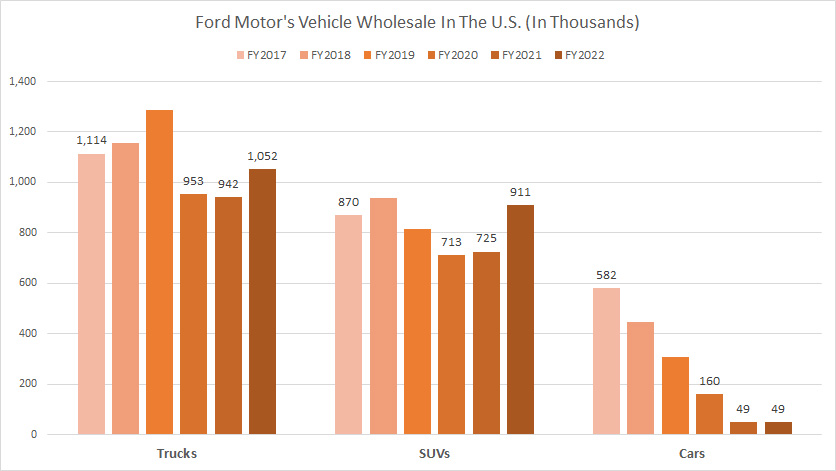
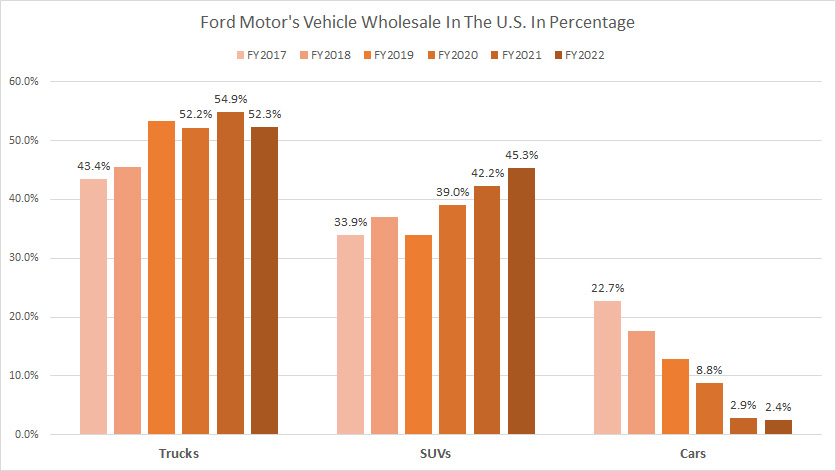
Ford’s U.S. wholesale by vehicle type is a legacy reporting and has ended since fiscal 2022. Starting in fiscal 2023, Ford has replaced the vehicle wholesale by type with vehicle wholesale by powertrain, which we will discuss in the following discussions.
That said, Ford’s truck sales account for the majority of the company’s total wholesale volume in the U.S. In fiscal 2022, Ford sold roughly 1 million trucks in the U.S. alone, up 12% over 2021 but roughly in line with 2017’s result.
Ford’s SUV wholesale in the U.S. logged 911,000 vehicles in fiscal 2022, slightly behind its truck’s result.
On the other hand, Ford’s car sales in the U.S. have declined by more than 90% since fiscal 2017. The latest number shows that Ford delivered only 49,000 cars, the lowest result among all vehicle types.
In short, Ford sells significantly more trucks and SUVs than cars in the U.S.
Trucks, SUVs, And Cars Sales In Percentage
ford-vehicle-wholesale-in-the-u.s.-by-type-in-percentage
(click image to expand)
Ford’s U.S. wholesale by vehicle type is a legacy reporting and has ended since fiscal 2022. Starting in fiscal 2023, Ford has replaced the vehicle wholesale by type with vehicle wholesale by powertrain, which we will discuss in the following discussions.
Ford’s U.S. truck wholesale in fiscal 2022 comprised roughly 52% of the company’s U.S. total volume. This ratio has increased from 43% in 2017 to 52% in 2022, illustrating the growing dominance of trucks in Ford’s vehicle lineup.
Similarly, Ford’s SUV wholesale in the U.S. has increased from 34% in 2017 to 45% of the company’s total volume in the U.S. as of 2022.
In contrast, Ford’s car wholesale in the U.S. has declined from 23% in 2017 to just 2.4% of its U.S. volume as of 2022.
Collectively, Ford’s sales of trucks and SUVs made up nearly 98% of the company’s total U.S. volume in fiscal 2022. This figure was 77% in 2017. Therefore, large vehicles such as trucks and SUVs have increasingly become critical to Ford’s success in the U.S. market.
EV, Hybrid, And ICE Vehicle Sales
ford-vehicle-wholesale-in-the-u.s.-by-powertrain
(click image to expand)
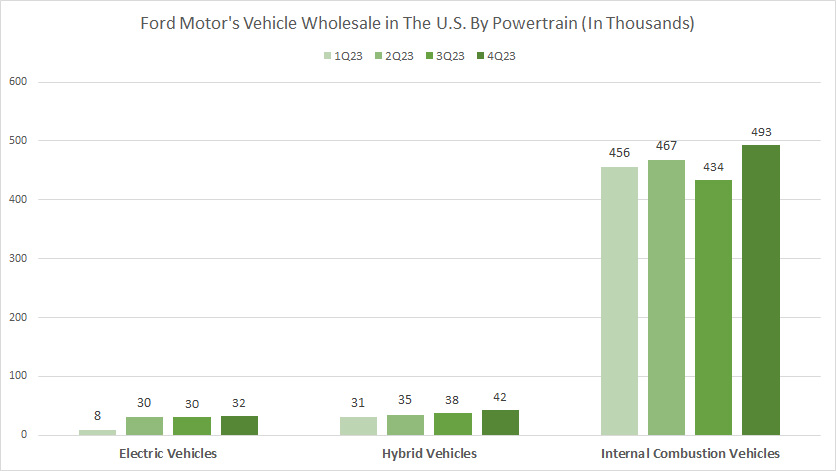
Ford has introduced a new reporting format for U.S. wholesale by powertrain in fiscal 2023, replacing U.S. wholesale by vehicle type.
That said, the chart above shows that most of Ford’s vehicle wholesale in the U.S. is still made up of internal combustion vehicles. However, the company has committed to going all-electric.
As of fiscal 4Q 2023, Ford’s wholesale of internal combustion vehicles topped nearly 500,000 units per quarter, significantly higher than the numbers of electric vehicles and hybrid cars.
By the end of fiscal 2023, Ford delivered nearly 1.9 million internal combustion vehicles compared to just 100,000 electric vehicles and 146,000 hybrid cars.
In short, Ford still relies significantly on internal combustion engine vehicles for most of its vehicle sales.
EV, Hybrid, And ICE Vehicle Sales In Percentage
ford-vehicle-wholesale-in-the-u.s.-by-powertrain-in-percentage
(click image to expand)
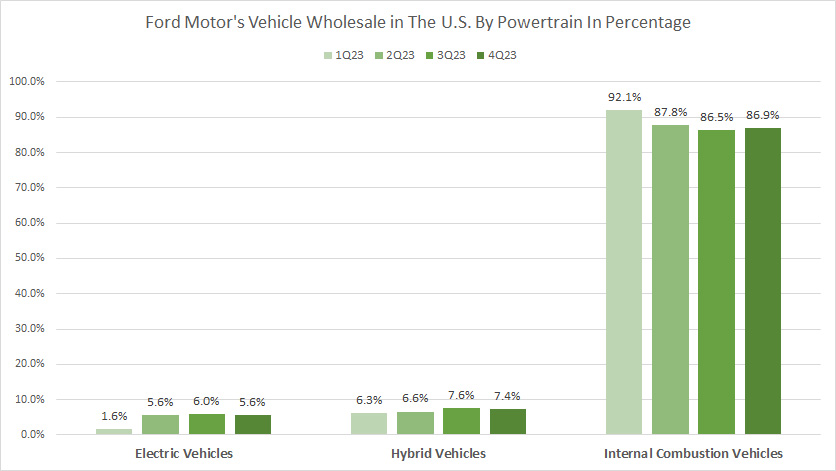
Ford has introduced a new reporting format for U.S. wholesale by powertrain in fiscal 2023, replacing U.S. wholesale by vehicle type.
From the percentage perspective, Ford’s ICE vehicles account for the majority of its total wholesale volume in the U.S. This ratio reached 87% in 4Q 2023, down considerably from 92% in 1Q 2023.
On the other hand, Ford’s hybrid vehicles in the U.S. made up only 7.4% of the company’s U.S. total volume in fiscal 4Q 2023, while EVs gained 5.6%. Together, they formed 13% of Ford’s total wholesale volume in the U.S.
Ford has made considerable progress in EV sales as the percentage has risen from just 1.6% in 1Q 2023 to 5.6% as of 4Q 2023.
Conclusion
Ford has considerably recovered in post-pandemic periods in vehicle wholesale globally. Besides, Ford has made significant progress in North America and the U.S. over the past three years.
Ford’s wholesale in Europe also has significantly improved in 2023 over 2022, with most major European countries striking a remarkable comeback as of 2023.
The only downside is Ford’s vehicle wholesale in China. Ford’s sales in China have been reduced by more than half, totalling only 500,000 units as of 2023, the lowest level in the last seven years.
References and Credits
1. All vehicle wholesale data presented in this article were obtained and referenced from Ford’s SEC filings, earnings releases, presentations, quarterly reports, annual reports, etc., which are available at Ford’s Investor Relation.
2. Featured images in this article are used under Creative Commons license and sourced from the following websites: Mike Mozart.
Disclosure
References and examples such as tables, charts, and diagrams are constantly reviewed to avoid errors, but we cannot warrant the total correctness of all content.
The content in this article is for informational purposes only and is neither a recommendation nor a piece of financial advice to purchase a stock.
If you find the information in this article helpful, please consider sharing it on social media and providing a link to it from any website so that more articles like this can be created.
Thank you!

