Architecture. Pixabay image.
Stellantis is a new automotive group formed by the merger of two major car manufacturers, PSA Group and Fiat Chrysler Automobiles (FCA). The merger was completed in January 2021, creating the world’s fourth-largest automaker by volume.
This article presents Stellantis’ worldwide revenue, vehicle shipments, revenue breakdown by type, profits and margins.
Let’s take a look!
For other key statistics of Stellantis, you may find more resources on these pages:
Revenue
- Stellantis revenue and profit segments: America, Europe, Asia, MEA, etc., and
- Stellantis revenue by region: U.S., France, U.K., Germany, Brazil, China, etc.
Sales & Market Share
Other Statistics
Please use the table of contents to navigate this page.
Table Of Contents
Definitions And Overview
- Vehicle Shipments
- Joint Venture
- Revenue From Vehicle Shipments & Sales Of Other Goods
- Other Services
- Construction Contract Revenue
- Leasing Revenue With Buyback Commitment
- Interest Income
O2. What Does Stellantis Do?
O3. How Does Stellantis Generate Revenue?
Worldwide Sales
Worldwide Revenue
A2. Global Revenue
Consolidated Profits And Margins
Revenue By Type
C1. Revenue From Vehicle Shipments & Sales Of Other Goods
C2. Revenue From Services, Construction Contract, Leasing, and Interest Income
Revenue Share By Type
C3. Percentege Of Revenue From Vehicle Shipments & Sales Of Other Goods, Services, etc.
Conclusion And Reference
S1. Insight
S2. References and Credits
S3. Disclosure
Definitions
To help readers understand the content better, the following terms and glossaries have been provided.
Vehicle Shipments: Vehicle shipments correspond to vehicles shipped to dealers, distributors, fleet customers or directly to retail customers in some cases.
Keep in mind that vehicle shipment is different from retail sales where vehicles are sold directly to consumers.
Revenue is recognized when control of vehicles, services or parts has been transferred, and Stellantis’ performance obligations to customers have been satisfied.
Transfer of control, and therefore revenue recognition, generally corresponds to the date when the vehicles or service parts were made available to the customer or when the vehicles or service parts were released to the carrier responsible for transporting them to the customer.
Joint Venture: A joint venture refers to a business arrangement where two or more parties agree to pool their resources and expertise to carry out a specific project or business activity.
Each party contributes capital, assets, skills, and knowledge to the joint venture and shares in the risks and rewards of the venture in proportion to their respective ownership interests.
The joint venture is treated as a separate entity for accounting purposes, and financial statements are prepared to reflect its operations and performance.
The accounting treatment of a joint venture depends on the nature and structure of the venture and may involve consolidation, equity method, or proportionate consolidation.
Revenue From Vehicle Shipments & Sales Of Other Goods: Revenue from vehicle shipments refers to the income generated by a company by selling vehicles to customers and dealerships. This can include cars, trucks, buses, and other types of vehicles.
On the other hand, sales of other goods refer to the income generated by a company through the sale of non-vehicle products and services, such as automotive parts, accessories, financing services, and maintenance and repair services.
Both revenue streams are important for automotive companies, as they help to sustain their operations and support innovation and growth in the industry.
Other Services: Revenues from other services provided are primarily comprised of maintenance plans, extended warranties, and connectivity services. These services are either included in the selling price of the vehicle or separately priced.
Construction Contract Revenue: Revenue from construction contracts, which comprised of industrial automation systems, is included within “Other activities”.
Leasing Revenue With Buyback Commitment: Vehicle sales to customers can include a repurchase obligation, whereby Stellantis is required to repurchase the vehicles at a given point in time. Stellantis accounts for such sales as an operating lease.
Interest Income: Interest income is primarily generated by providing dealer and retail financing.
What Does Stellantis Do?
According to the 2024 annual report, Stellantis and its subsidiaries are engaged in the design, engineering, manufacturing, distribution and sale of automobiles and light commercial vehicles, engines, transmission systems, mobility services, metallurgical products and production systems.
In addition, Stellantis is involved in certain other activities, including software and data businesses and financial services activities relating to dealer and customer financing.
How Does Stellantis Generate Revenue?
Stellantis generates its revenue primarily through the sale of vehicles. The company produces a wide range of cars, trucks, and SUVs under various brand names, including Jeep, Ram, Chrysler, Dodge, Fiat, Peugeot, Citroën, Opel, and Vauxhall.
Stellantis also generates revenue by financing vehicle purchases, providing maintenance and repair services, and selling automotive parts and accessories.
Additionally, the company has partnerships with other companies in the automotive industry to develop new technologies and expand its reach in different markets.
Global Vehicle Shipments
Stellantis-vehicle-shipments-global
(click image to expand)
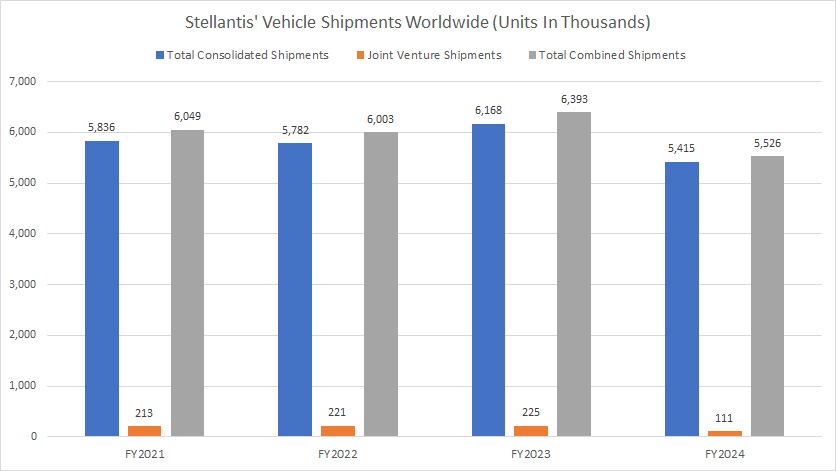
A definition of Stellantis’ vehicle shipments is available here: vehicle shipments. Basically, Stellantis’ vehicle shipments refer to vehicle wholesale the company ships to dealerships for resale. This number determines the company’s revenue, which is recognized when the vehicles are delivered to dealers.
Stellantis sold an average of 6.0 million vehicles globally each year since 2022. This sale figure consists of consolidated shipments and shipments by joint ventures. A definition of Stellantis’ joint venture is available here: joint venture.
Stellantis’ worldwide vehicle shipments reached an all-time high of 6.4 million units in 2023, representing a 6% increase over the previous year.
However, in fiscal year 2024, its gloabl vehicle sales took a significant hit, decreasing to a record low of 5.5 million units, down by 14% from 2023.
Global Revenue
Stellantis-worldwide-revenue
(click image to expand)
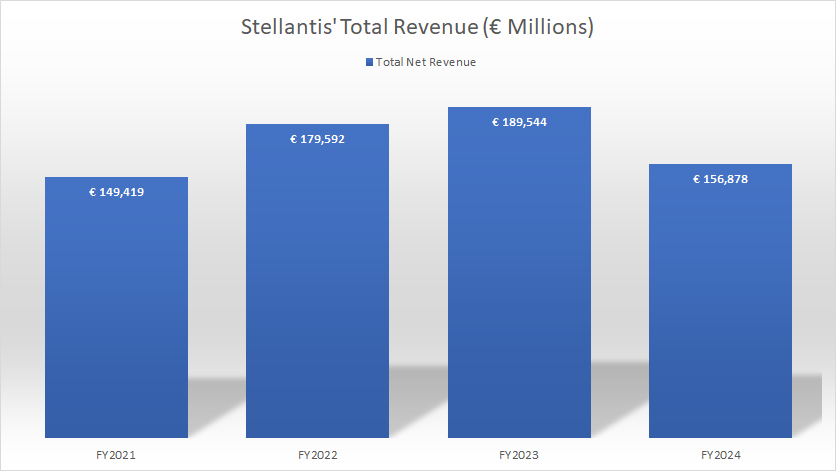
Stellantis’ worldwide revenue decreased to €156.9 billion in fiscal year 2024 from €189.5 billion in 2023, about 17% lower year-over-year.
Stellantis earned €149.4 billion and €179.6 billion in global revenue in fiscal years 2021 and 2022, respectively. Stellantis generates an average annual global revenue of €175.3 billion from 2022 to 2024.
Profits
Stellantis-consolidated-profits
(click image to expand)
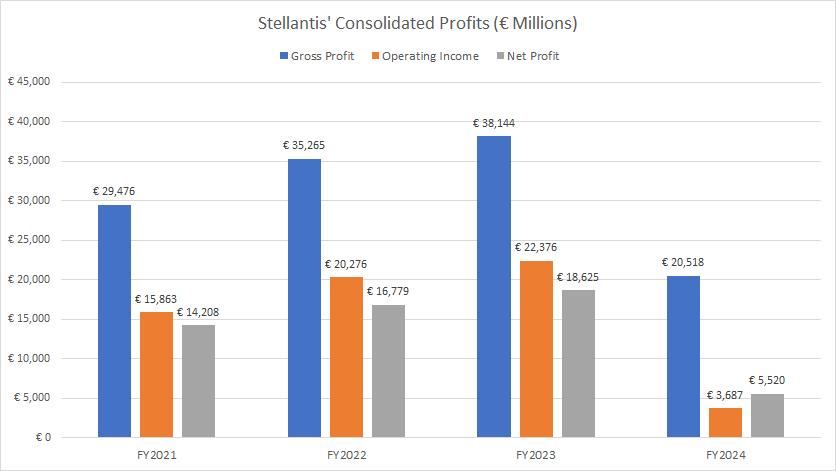
Stellantis has earned billions of euros in profits, with an average yearly gross profit of €31.3 billion and an operating income of €15.4 billion between fiscal year 2022 and 2024. Additionally, its net profit has averaged €13.5 billion annually since 2022.
One noticeable trend that has emerged is the significant rise in profitability for Stellantis from 2021 to 2023. For instance, the gross profit for Stellantis has increased by 29% between 2021 and 2023, while the operating income has gone up by over 40% during the same period. Additionally, the net profit for Stellantis has climbed by more than 30% from 2021 to 2023.
However, in fiscal year 2024, Stallantis’s profitability took a significant hit, plummeting to record lows for all profitability metrics such as gross profit, operating profit and net profit.
In fiscal year 2024, Stellantis’s gross profit tumbled to €20.5 billion, while operating profit dived to a record low of €3.7 billion. Net profit stood at an all-time low of €5.5 billion.
Stellantis’s lower-than-expected 2024 results were primarily driven by lower worldwide vehicle sales, which we saw earlier.
Margins
Stellantis-consolidated-margins
(click image to expand)
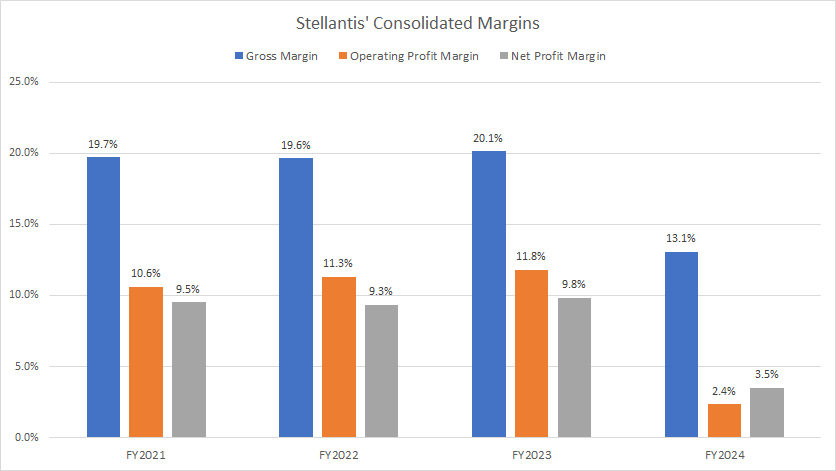
Stellantis has an average gross margin of 18% between fiscal year 2022 and 2024, while the operating profit margin has averaged 9% during the same period. Moreover, Stellantis has an average net profit margin of 8% between 2022 and 2024.
Along with the decline in profitability, Stellantis’ profit margins significantly dived in fiscal year 2024, as shown in the chart above. For example, gross margin stood at only 13%, while operating margin hit a record low of 2.4%. Net margin came in at just 3.5% from 10% in the previous year.
Revenue From Vehicle Shipments & Sales Of Other Goods
Stellantis-revenue-from-vehicle-sales
(click image to expand)
The definitions of Stellantis’ revenue by type are available here: revenue from vehicle shipments & sales of goods.
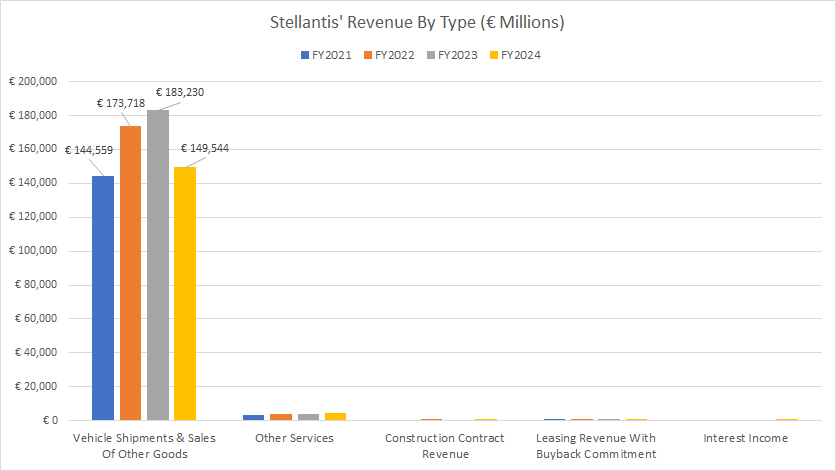
Stellantis generates revenue from multiple streams, the majority of which comes from vehicle shipments and sales of other goods. This portion of revenue totaled €173.7, €183.2 billion, and €149.5 billion in fiscal years 2022, 2023, and 2024, respectively.
Apart from vehicle shipments and sales of goods, Stellantis also earns revenue from other services, primarily comprising maintenance plans, extended warranties, and connectivity services. This portion of revenue is insignificant compared to revenue generated from sales of vehicle shipments.
Stellantis’ construction contract revenue, derived from building industrial automation systems, also look significantly small compared to revenue from vehicle sales.
Stellantis’ other revenue sources, which include leasing and interest income, are some of the smallest contributors.
Revenue From Services, Construction Contract, Leasing, and Interest Income
Stellantis-revenue-from-other-streams
(click image to expand)
The definitions of Stellantis’ revenue by type are available here: services, construction contract revenue, leasing revenue with buyback commitment, and interest income.
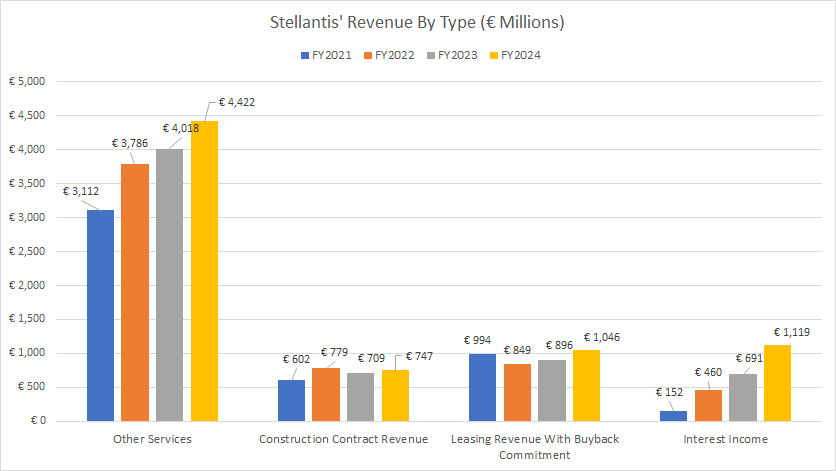
Stellantis’ revenue from other services, primarily comprising maintenance plans, extended warranties, and connectivity services amounted to €3.8 billion, €4.0 billion, and €4.4 billion in fiscal years 2022, 2023, and 2024, respectively.
Stellantis’ construction contract revenue, derived from building industrial automation systems, reached €779 million, €709 million, and €747 million in fiscal years 2022, 2023, and 2024, respectively.
Stellantis’ other revenue sources, which include leasing and interest income, exceeded €1.0 billion each in fiscal year 2024, a record figure for these revenue streams.
Percentage Of Revenue From Vehicle Shipments & Sales Of Other Goods, Services, etc.
Stellantis-revenue-by-type-in-percentage
(click image to expand)
The definitions of Stellantis’ revenue by type are available here: revenue from vehicle shipments & sales of goods, other services, construction contract revenue, leasing revenue with buyback commitment, and interest income.
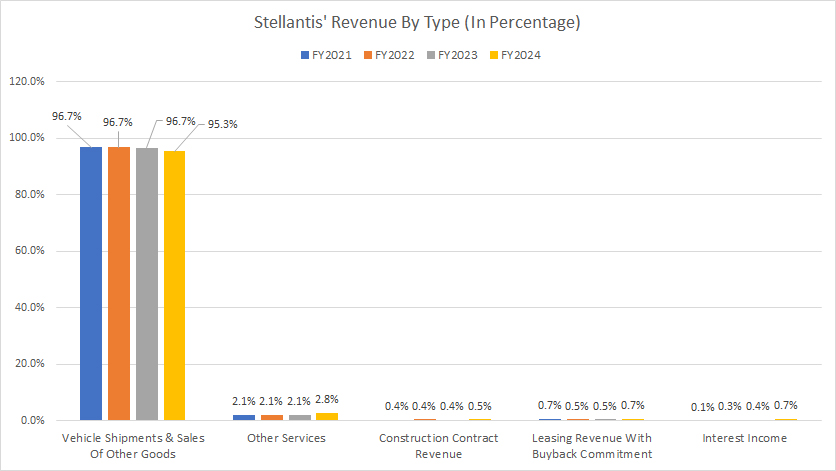
Stellantis’ vehicle shipments and sales of other goods have consistently contributed over 96% of revenue to the company. This sales category made up 95.3% of the company’s total revenue in fiscal year 2024.
On the other hand, Stellantis’ other services contribute only about 2% of revenue to the company. This revenue category accounted for 2.8% of total revenue in fiscal year 2024.
Stellantis’ other revenue sources, which include construction contract revenue, leasing and interest income, make up only a very small percentrage of the company’s total revenue. Together, they accounted for only about 2% of total revenue in 2024.
Insight
Stellantis, despite being one of the world’s largest automakers, faced significant challenges in 2024, marked by a sharp decline in vehicle shipments and financial performance.
Revenue and profitability dipped considerably due to a 14% drop in vehicle shipments compared to 2023. However, the company’s historical data reveals robust performance and profitability growth from 2021 to 2023, suggesting that the 2024 decline was an anomaly rather than a sustained trend.
Stellantis continues to rely heavily on vehicle sales, with over 96% of its revenue generated from this category. In summary, Stellantis’ success is largely tied to its vehicle sales, which makes it vulnerable to fluctuations in this core segment.
References and Credits
1. All financial figures presented were obtained and referenced from Stellantis’ quarterly and annual reports published on the company’s investor relations page: Stellantis Investor Relations.
2. Pixabay images.
Disclosure
We may use artificial intelligence (AI) tools to assist us in writing some of the text in this article. However, the data is directly obtained from original sources and meticulously cross-checked by our editors multiple times to ensure its accuracy and reliability.
If you find the information in this article helpful, please consider sharing it on social media. Additionally, providing a link back to this article from any website can help us create more content like this in the future.
Thank you for your support and engagement! Your involvement helps us continue to provide high-quality, reliable content.

