A hand full of cash money. Flickr Image.
This article delves into the cash flow statistics of prominent social media companies, including Meta, Twitter, Snap, and Pinterest.
It examines key metrics such as operating cash flow, free cash flow, and cash flow margins, providing a comprehensive overview of their financial health and performance.
For the definitions of these cash flow metrics, you may refer to this section: cash flow definitions.
Let’s take a look! You may find related statistic of social media companies on these pages:
Please use the table of contents to navigate this page.
Table Of Contents
Definitions And Overview
O2. Why is Meta generating so much cash?
Operating Cash Flow
A1. Net Cash From Operations (With Meta)
A2. Net Cash From Operations (Without Meta)
Free Cash Flow
B1. Free Cash Flow (With Meta)
B2. Free Cash Flow (Without Meta)
Cash Flow Margins
C1. Operating Cash Flow Margin
C2. Free Cash Flow Margin
Conclusion And Reference
S1. Conclusion
S2. References and Credits
S3. Disclosure
Definitions
To help readers understand the content better, the following terms and glossaries have been provided.
Net Cash From Operations: Net cash from operations, also known as operating cash flow (OCF), is a key metric found in the cash flow statement of a company’s financial statements.
It represents the amount of cash generated or used by a company from its regular business operations over a specific period.
Operating cash flow is derived from the net income and adjusted for changes in working capital, non-cash expenses (such as depreciation and amortization), and other items that affect operating activities.
It provides insight into the company’s ability to generate sufficient cash to maintain and grow its operations, repay debts, and invest in new opportunities without relying on external financing.
A positive operating cash flow indicates that the company is generating more cash from its core business activities than it is spending, which is a good sign of financial health.
Conversely, a negative operating cash flow may signal potential problems in the company’s ability to sustain its operations and meet its financial obligations.
Free cash flow : Free cash flow (FCF) is a key financial metric representing the amount of cash generated by a company after accounting for capital expenditures (CAPEX) needed to maintain or expand its asset base.
Essentially, it measures the cash available for the company to distribute to shareholders, repay debt, or reinvest in its operations. Free cash flow is calculated as follows:
\[\text{Free Cash Flow} = \text{Operating Cash Flow – Capital Expenditure (CAPEX)} \]
Operating cash flow is the cash generated from the company’s regular business activities, while capital expenditures are the funds used to purchase or upgrade physical assets such as property, buildings, or equipment.
A positive free cash flow indicates that the company generates more cash than it needs for its capital investments, which is a sign of financial health and flexibility. Conversely, a negative free cash flow may suggest that the company is investing heavily in its future growth or facing challenges in generating sufficient cash from its operations.
Cash Flow Margin: Cash flow margin is a financial metric measuring the percentage of cash generated from a company’s sales.
It indicates how efficiently a company converts its revenue into cash flow. In essence, it shows the proportion of revenue that is converted into actual cash, providing insight into the company’s liquidity and operational efficiency.
Cash flow margin is calculated as follows:
\[\text{Cash Flow Margin} = \left( \frac{\text{OCF or FCF}}{\text{Total Revenue}} \right) \times 100\%\]
Key Points:
- Operating Cash Flow: This is the cash generated from the company’s core business operations.
- Revenue: This is the total income generated from sales before any expenses are deducted.
A higher cash flow margin indicates that the company is efficient at converting sales into cash, which is beneficial for meeting short-term obligations and reinvesting in the business. Conversely, a lower cash flow margin may suggest inefficiencies in operations or challenges in managing cash flow.
Understanding cash flow margin is crucial for investors and stakeholders as it provides a clear picture of a company’s financial health and its ability to generate cash from its operations.
Why is Meta generating so much cash?
Meta generates substantial cash primarily due to its highly profitable advertising business. Here are some key reasons:
- Advertising Revenue: Meta’s primary revenue source is advertising, driven by its vast user base across platforms like Facebook, Instagram, WhatsApp, and Messenger. The company’s ability to target ads effectively to its users results in high advertising revenue.
- User Engagement: Meta has a massive and engaged user base, with billions of daily active users. This high level of engagement attracts advertisers who are willing to pay premium prices to reach Meta’s audience.
- Diversified Revenue Streams: While advertising is the main revenue driver, Meta also generates income from other sources such as virtual reality (VR) and augmented reality (AR) products, although these segments are still in development and not yet major cash generators.
- Efficiency Initiatives: Meta has implemented various cost-saving measures, including layoffs and reduced capital expenditures, which have helped improve its cash flow.
- Market Position: As one of the largest social media companies in the world, Meta holds a dominant market position, allowing it to command higher advertising rates and attract more advertisers.
These factors combined contribute to Meta’s strong cash generation capabilities, making it a significant player in the tech industry.
Net Cash From Operations (With Meta)
Meta, Twitter, Snap and Pinterest’s net cash from operations
(click image to expand)
To help readers understand the content, you may find the definition of net cash from operations here: net cash from operations.
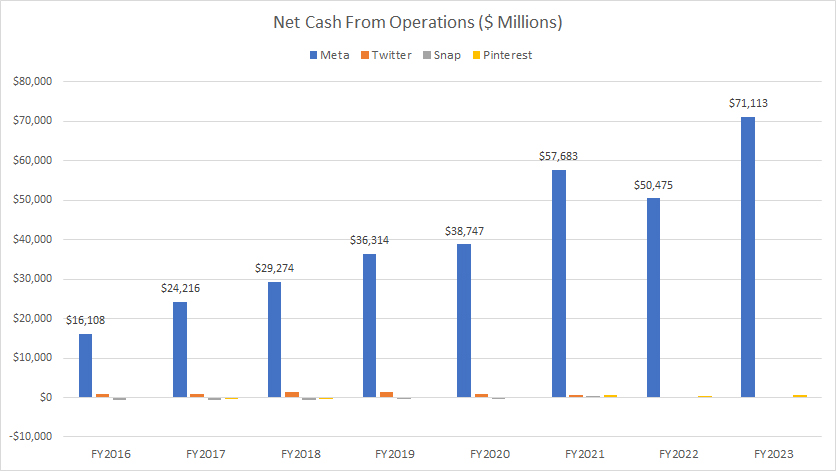
Since fiscal 2016, Meta has consistently been the dominant player, generating tens of billions in net cash from operations. This is significantly higher than the cash flow generated by its peers — Twitter, Pinterest, and Snap.
As of fiscal year 2023, Meta’s net cash from operations surged to a massive $71 billion. This figure dwarfs the cash flow of other social media platforms, highlighting Meta’s strong market position and effective monetization strategies.
From fiscal year 2016 to 2023, Meta achieved an impressive compounded annual growth rate (CAGR) of over 30% in net cash from operations, a growth rate unparalleled by any other social media company.
In contrast, the net cash from operations for Twitter, Snap Inc., and Pinterest remains significantly lower compared to Meta. As of fiscal 2023, none of these companies have surpassed the $5 billion mark in net cash from operations. This stark contrast underscores Meta’s superior ability to generate cash from its advertising business.
Net Cash From Operations (Without Meta)
Twitter, Snap and Pinterest’s net cash from operations
(click image to expand)
To help readers understand the content, you may find the definition of net cash from operations here: net cash from operations.
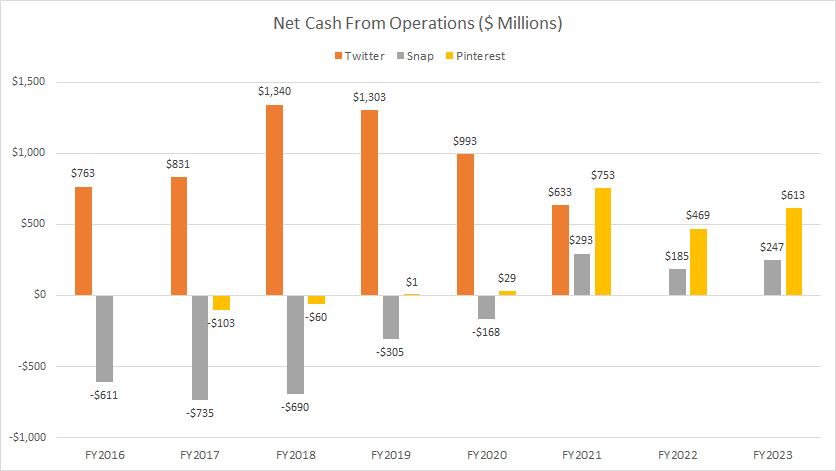
When excluding Meta from the chart, the net cash from operations of Twitter, Snap, and Pinterest become much clearer.
In fiscal year 2021, Twitter generated about $644 million in operating cash flow. Note that this data is up to 2021, as Twitter has been taken private since 2022. On average, Twitter generated about $1 billion in operating cash flow annually between fiscal year 2019 and 2021.
Snap Inc and Pinterest have significantly recovered from negative operating cash flow. Since fiscal year 2021, both social media players have produced positive operating cash flow.
In fiscal year 2023, Snap’s operating cash flow totaled around $247 million, while Pinterest’s figure came in at $613 million. On average, their annual operating cash flow amounted to $242 million and $612 million, respectively.
In short, Twitter has been the standout performer in terms of operating cash flow, although its performance has been declining recently.
Snap and Pinterest, while historically generating negative cash flow, have been showing improvements and increased their cash-generating capabilities, with Pinterest in particular making significant strides.
Free Cash Flow (With Meta)
Meta, Twitter, Snap and Pinterest’s free cash flow
(click image to expand)
To help readers understand the content, you may find the definition of free cash flow here: free cash flow.
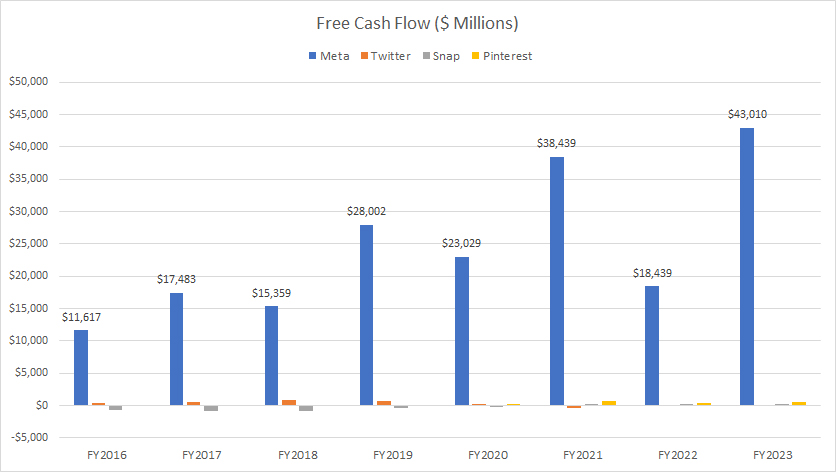
A discussion of cash flow would be incomplete without involving free cash flow (FCF), another crucial financial metric. The chart above shows the free cash flow of prominent social media companies: Meta, Twitter, Snap Inc., and Pinterest.
Meta consistently leads as the top social media company in terms of free cash flow, far exceeding the figures of Twitter, Pinterest, and Snap Inc.
Since fiscal 2016, Meta’s free cash flow has grown at a compounded annual growth rate (CAGR) of over 20%. As of fiscal year 2023, Meta’s free cash flow reached $43 billion, an increase of 140% from the previous year. In short, Meta’s FCF remains significantly higher than its competitors.
In contrast, the free cash flow for Twitter, Pinterest, and Snap appears considerably smaller compared to Meta. Some of these companies, such as Snap and Pinterest, have even reported negative free cash flow at times, primarily due to their inability to generate positive operating cash flow, as discussed earlier.
In short, Meta remains the undisputed leader in free cash flow generation among social media companies. Its robust monetization strategies, vast user base, and effective cost management contribute to its massive free cash flow.
Free Cash Flow (Without Meta)
Twitter, Snap and Pinterest’s free cash flow
(click image to expand)
To help readers understand the content, you may find the definition of free cash flow here: free cash flow.
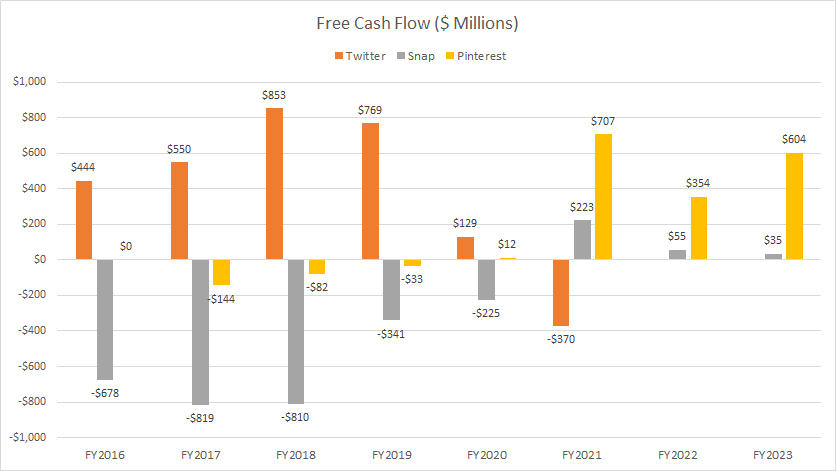
Without Meta in the picture, the free cash flow figures for Twitter, Pinterest, and Snap Inc. become much clearer.
Twitter’s free cash flow peaked at $853 million in fiscal 2018 but has since experienced a dramatic decline. Twitter’s free cash flow averaged around $176 million between fiscal 2019 and 2021. By fiscal 2021, Twitter’s free cash flow tumbled to -$370 million, marking a record low since fiscal year 2016.
On the other hand, Snap and Pinterest have seen improvements in their free cash flow since 2021. In fiscal year 2021, Snap achieved a record high free cash flow of $223 million, although this figure decreased to $55 million in 2022, and it further declined to $35 million in fiscal year 2023.
Pinterest’s free cash flow surged to $707 million in fiscal year 2021, significantly outpacing other social media companies. However, this figure reduced to $354 million in 2022. In fiscal year 2023, Pinterest’s free cash flow increased to $604 million, nearly double the figure in 2022.
In short, Twitter’s performance has been inconsistent, with significant fluctuations in free cash flow over the years. Snapchat has started to generate positive free cash flow, though the figures remain modest.
Pinterest has achieved substantial growth, producing an average of half a billion dollars in free cash flow over the last three years. This milestone marks Pinterest as a new cash cow among social media companies.
Operating Cash Flow Margin
facebook-twitter-pinterest-snap-operating-cash-flow-margin
(click image to expand)
To help readers understand the content, you may find the definition of cash flow margin here: cash flow margin.
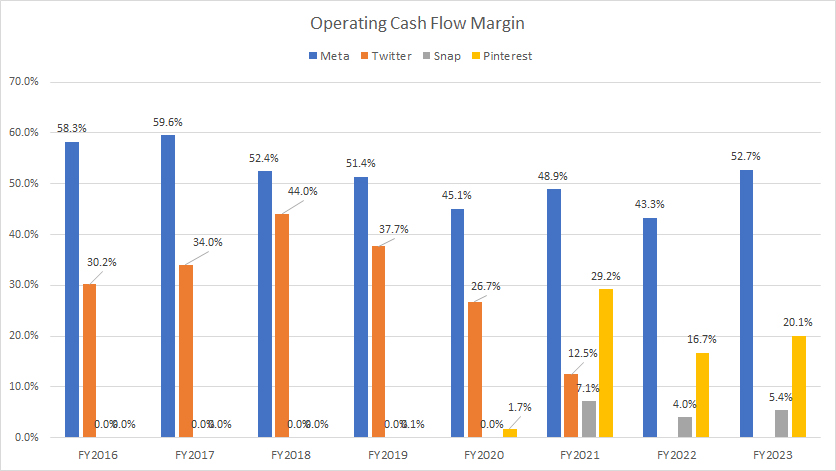
Meta once again holds the crown among all social media platforms in terms of operating cash flow margin. Meta’s operating cash flow conversion ratio, evaluated by the operating cash flow margin, has been the highest since 2016, surpassing all other social media companies by a significant margin.
While Meta’s operating cash flow conversion efficiency remains the best among Twitter, Snap, and Pinterest, the ratio has been on a decline, reaching 43% in fiscal year 2022. This is one of the lowest figures ever recorded for the company. In fiscal year 2023, it grew to 53%, a significant increase from 2022.
In short, Meta’s operating cash flow conversion ratio significantly outperforms Twitter, Snap, and Pinterest by a wide margin.
Twitter has been a strong performer in terms of operating cash flow margin, second only to Meta. Between fiscal years 2019 and 2021, Twitter achieved an average operating cash flow margin of around 26%. This performance is significantly higher than that of Snap and Pinterest, though it still lags behind Meta’s leading figures.
On the contrary, Snap Inc. has been the worst performer in terms of cash conversion efficiency among all social media companies compared. Snap’s operating cash flow margins have been notably negative in all fiscal years and have only turned positive since 2021. In fiscal 2021, Snap’s operating cash flow margin improved to 7%, though it fell to 4% in 2022. In fiscal year 2023, it remained modestly at 5.4%.
Pinterest, on the other hand, has seen a significant rise in its operating cash flow margins, reaching as high as 29% in 2021 and 17% in 2022. In fiscal year 2023, Pinterest’s operating cash flow conversion ratio remained steady at 20%. This improvement positions Pinterest as a notable performer, only after Meta and Twitter in terms of cash conversion efficiency.
Free Cash Flow Margin
facebook-twitter-pinterest-snap-free-cash-flow-margin
(click image to expand)
To help readers understand the content, you may find the definition of cash flow margin here: cash flow margin.
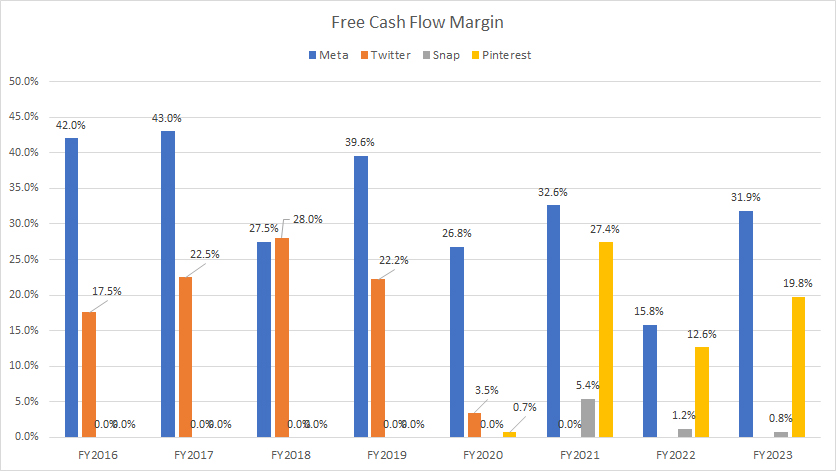
Meta has consistently proven to be the undisputed leader in free cash flow among all social media companies, as depicted in the chart above. This dominance is a result of its robust business model and effective monetization strategies.
In this regard, Meta has remained at the forefront of free cash flow generation, far surpassing other social media companies like Twitter, Snap, and Pinterest. Between fiscal years 2021 and 2023, Meta’s free cash flow margin averaged 27%, the highest among all companies compared.
In fiscal year 2023, Meta’s free cash flow margin surged to 32%, significantly outperforming the results of other social media companies. This impressive margin underscores Meta’s efficiency in converting revenue into free cash flow, maintaining its strong market position.
Twitter, despite being a close contender in terms of cash flow margin, lags behind Meta. With an average free cash flow margin of around 13% between fiscal years 2018 and 2020, Twitter has shown strong performance but lacks the consistency and scale of Meta. However, in fiscal year 2021, Twitter generated negative free cash flow, leading to a free cash flow margin of 0%.
Snap has historically struggled with negative free cash flow margins. However, it has shown improvements, achieving positive free cash flow margin since fiscal year 2021, although still significantly lower than Meta’s figures.
The bad news is that Snapchat’s free cash flow margin has significantly declined since fiscal year 2021. As of fiscal year 2023, the free cash flow margin stood at a mere 0.8%, illustrating a decreasing capability of the social media player in converting revenue into free cash flow. This decline highlights the financial challenges Snapchat faces in maintaining efficient cash conversion.
On the other hand, Pinterest has been on a remarkable growth trajectory, with free cash flow margins improving over the years. As of fiscal year 2023, Pinterest achieved a free cash flow margin of 20%, marking one of its best performances. In fiscal year 2022, Pinterest’s free cash flow margin declined to 13%, a significant drop from the 27% in the previous year.
On average, Pinterest’s free cash flow margin amounted to 20% between fiscal year 2021 and 2023, second only to Meta, and marking significant improvement and efficiency in cash conversion.
In summary, Meta’s superior cash conversion efficiency and free cash flow generation set it apart from other social media companies. With a free cash flow margin averaging 27% between fiscal years 2021 and 2023 and reaching 32% in fiscal year 2023, Meta continues to lead by a wide margin. While Twitter, Snap, and Pinterest have shown varying degrees of success, none have come close to matching Meta’s financial performance and cash-generating capabilities.
Conclusion
In conclusion, Meta remains the dominant force in cash metrics among social media companies, with exceptional net cash from operations, free cash flow, and cash margins. Twitter, while a close contender, shows signs of weakening cash-producing ability.
Snap continues to face challenges, with declining free cash flow margins, while Pinterest’s prudent financial management and improving cash metrics make it a noteworthy performer.
The varying cash flow performances and capital-raising activities of these companies provide valuable insights into their financial health and strategic approaches.
References and Credits
1. All financial figures presented were obtained and referenced from the respective financial statements and reports puiblished on the investor relations pages:
a) Meta Investor Relations
b) Pinterest Investor Relations
c) Twitter Investor Relations
d) Snap Investor Relations
2. Flickr Images.
Disclosure
We may utilize the assistance of artificial intelligence (AI) tools to produce some of the text in this article. However, the data is directly obtained from original sources and meticulously cross-checked by our editors multiple times to ensure its accuracy and reliability.
If you find the information in this article helpful, please consider sharing it on social media. Additionally, providing a link back to this article from any website can help us create more content like this in the future.
Thank you for your support and engagement! Your involvement helps us continue to provide high-quality, reliable content.

