Beer. Source: Flickr
AB InBev (ABI) is one of the world’s largest beverage brewers.
Its beverage products range from alcoholic such as beers to non-alcoholic such as energy as well as soft drinks.
AB InBev’s sales totaled as much as $47 billion USD in FY2020.
Additionally, AB InBev also generates tonnes of free cash flow.
The latest figure was $17 billion in FY2020, after taking into account the company’s net cash from operations and investment.
In this article, we will look at AB InBev’s profitability.
The profitability metrics that we are going to explore include ABI’s gross profit, operating profit and net profit which are measured according to IFRS or International Financial Reporting Standard.
Apart from the IFRS measures, we also will look at some non-IFRS metrics that are given by ABI such as the normalized EBIT and normalized net profit.
These non-IFRS metrics are specifically adjusted by the company to show investors the strength of its core performance.
Therefore, let’s take a look.
AB InBev’s Profitability Topics
1. Gross Profit
2. Normalized EBIT
3. Net Profit Attributable to Stockholders
4. Normalized EBITDA
5. Normalized Net Profit Attributable To Stockholders
6. Conclusion
AB InBev’s Gross Profit
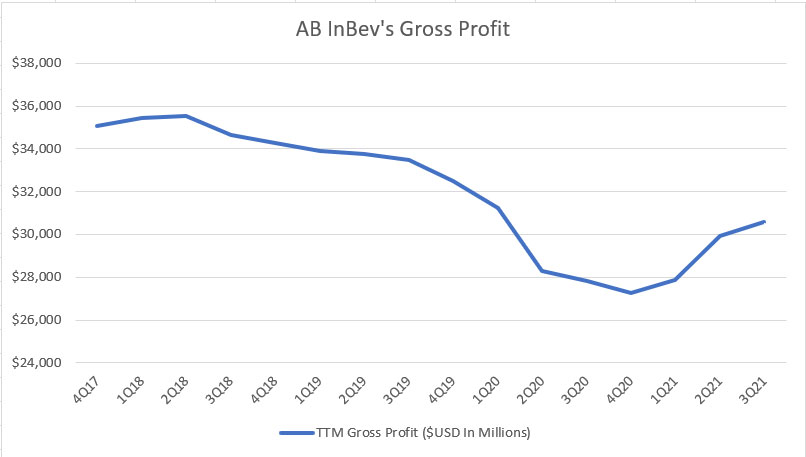
AB InBev’s gross profit
Let’s first look at AB InBev’s gross profit by quarter for the period from FY2016 to FY2021.
According to the chart, AB InBev’s gross profit topped out at roughly $35 billion in fiscal 2018 and began to decline thereafter.
In fiscal 2020, ABI’s gross profit hit $27 billion, the lowest figure ever reported, driven primarily by the adverse impact of the COVID-19 pandemic.
Going into fiscal 2021, AB InBev’s gross profit began to recover and hit $31 billion on a TTM basis as of fiscal 3Q 2021, a new high since 2020.
For your information, AB InBev merged with SABMiller back in 2016 and hence, the significant rise in gross profit from FY2016 to FY2017.
However, competitions from other breweries, craft beers, in particular, have slowly eaten into AB InBev’s profitability and AB InBev’s gross profit was seen steadily declining over the last few years.
What makes matter worse was that the decline in ABI’s gross profit occurred even before the arrival of the COVID-19 outbreak, due primarily to the competition from craft beers.
The arrival of the COVID-19 pandemic has caused ABI’s gross profit to decline further.
Fortunately, ABI’s gross profit recovered slightly in fiscal 2021 from the slump seen during fiscal 2020.
AB InBev’s Normalized Profit From Operations (Normalized EBIT)
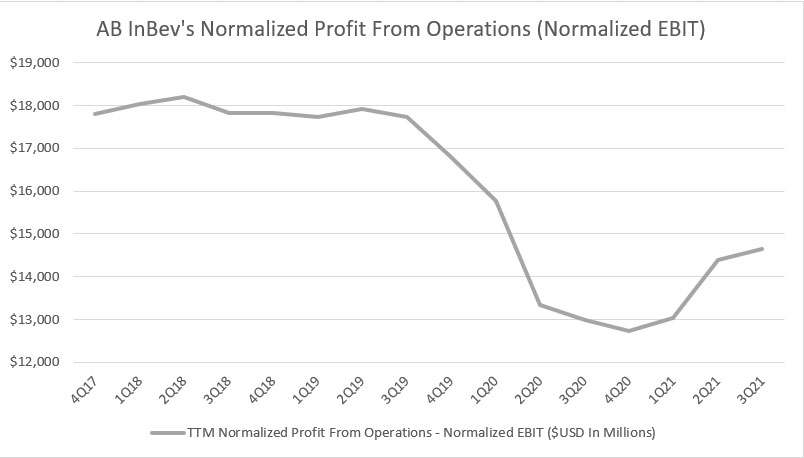
AB InBev’s operating profit before non-recurring items
The normalized profit from operations (normalized EBIT) is a non-IFRS measure and is comparable to the operating profit except that certain items, including impairment charges, COVID-19 related costs, restructuring, etc. are excluded during the adjustment.
According to AB InBev, the normalized profit from operations is meant to provide investors with a proper understanding of the company’s underlying core operation after adjusting for the non-core incomes or expenses.
All told, AB InBev’s normalized profit from operations experienced a similar pattern as the gross profit where the TTM figures topped out in the same fiscal year at roughly $18 billion USD before slowly declining to about $12.7 billion in fiscal 2020, a record low for the company.
Moreover, ABI’s normalized profit from operations declined the most in fiscal 2020 as if it were falling off a cliff.
In fiscal 2021, ABI’s normalized profit from operations recovered slightly and reached about $14.8 billion on a TTM basis as of the 3rd quarter.
AB InBev’s Profit Attributable To Stockholders
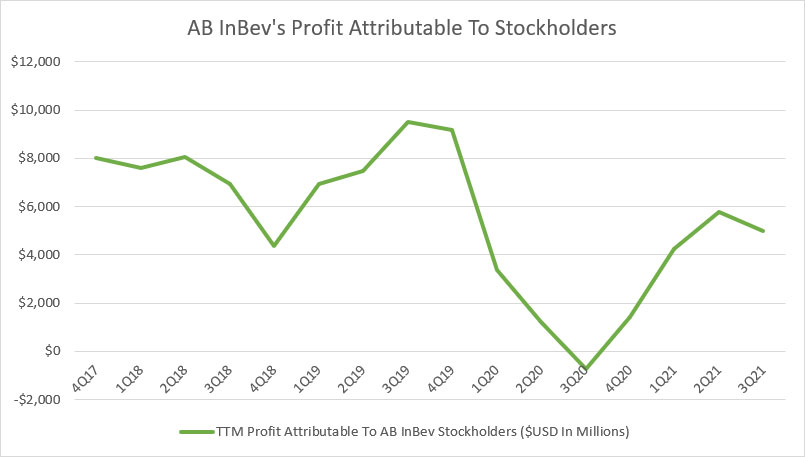
AB InBev’s net profit
AB InBev’s profit attributable to stockholders is also referred to as the net income or net profit available to AB InBev’s stockholders.
This figure is measured after adjusting for taxes incurred and profit attributable to non-controlling interest.
Basically, the profit attributable to stockholders is the final net profit available to common stockholders after accounting for all costs of doing business, including interest expenses and taxes.
That said, AB InBev’s net profit or net income totaled about $5 billion USD on a TTM basis as of fiscal 3Q 2021, a significantly higher figure compared to that reported in fiscal 2020.
One thing worth mentioning is that ABI’s net profit pattern does not look exactly the same as the one seen in gross profit and normalized EBIT.
According to the chart, AB InBev’s net profit declined the most in fiscal 2020 and even reached negative at -$746 million in fiscal Q3 2020, indicating net losses the company had incurred.
ABI’s net profit decline in fiscal 2020 was drastic and brutal.
As a result, the company’s net profit was totally wiped out in fiscal 2020.
Fortunately, AB InBev’s net profit managed to recover in fiscal 2021 as reflected by the growing figures shown in the chart.
AB InBev’s Normalized EBITDA
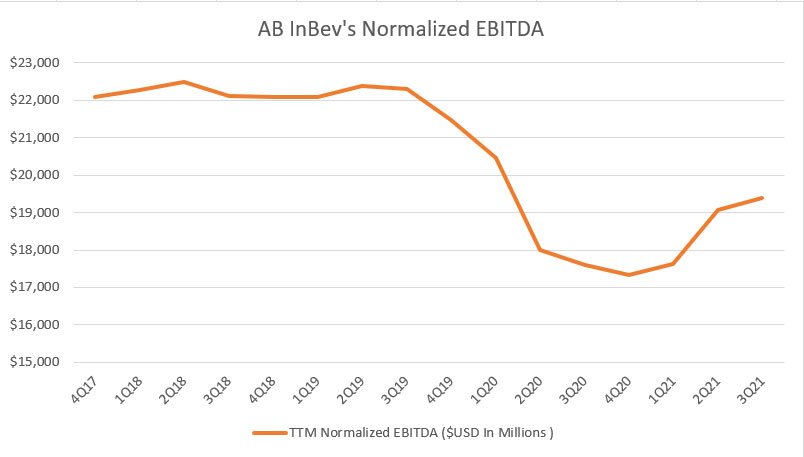
AB InBev’s normalized EBITDA
The normalized EBITDA is similar to the normalized EBIT that we saw earlier in which both are non-IFRS metrics.
The only difference between the normalized EBITDA and EBIT is that the EBIT includes the costs of depreciation and amortization whereas the EBITDA excludes them.
As a result, you can see that the normalized EBITDA is much larger than the normalized EBIT according to the charts.
That said, AB InBev’s normalized EBITDA also follows the same pattern as that of the normalized EBIT in which the figures tumbled the most in fiscal 2020 and recovered thereafter in fiscal 2021.
As of fiscal Q3 2021, ABI’s normalized EBITDA totaled $19 billion USD on a TTM basis, up 10% from a year ago.
Therefore, AB InBev’s core performance has recovered significantly in fiscal 2021 compared to 2020.
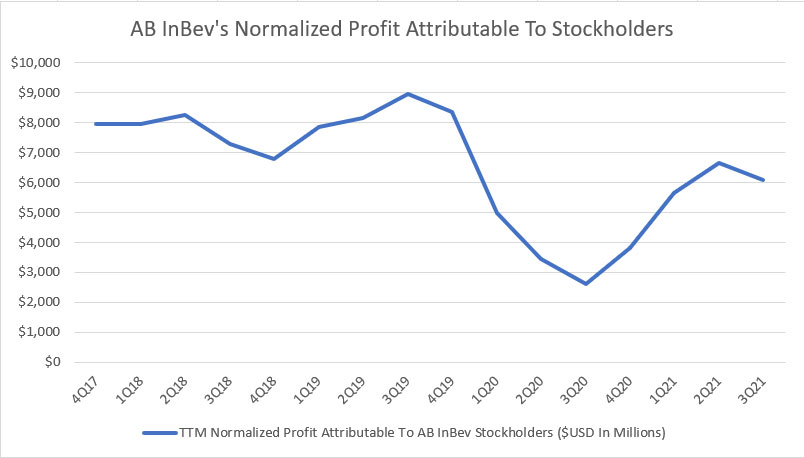
AB InBev’s Normalized Profit Attributable To Stockholders
AB InBev’s normalized net income
The normalized net profit is comparable to the net profit which we saw earlier.
However, the normalized net profit is a non-IFRS measure and is adjusted according to ABI by excluding non-core items.
Therefore, you can see that the normalized net profit is much better than the IFRS-based net profit.
Also, the normalized net profit did not suffer a net loss as seen in the IFRS-based net profit.
As of fiscal Q3 2021, AB InBev’s normalized net profit totaled $6 billion on a TTM basis, nearly double that of the same quarter a year ago.
In short, AB InBev’s profitability has significantly recovered in fiscal 2021 from the 2020 COVID slump but was still down considerably from the historical highs reported in fiscal 2018.
Conclusion
AB InBev is a profitable company and was profitable even during the COVID-19 crisis, albeit at a smaller profit.
However, AB InBev’s profitability has been on a decline and was impacted the most in fiscal 2020 as reflected by the drastic decline of all profitability metrics.
Nevertheless, AB InBev’s profitability recovered significantly in a post-pandemic world in fiscal 2021 but was still considerably lower from historical highs.
As a result, AB InBev’s market valuation as of Jan 2022 was only $100 billion USD, roughly half of the $200 billion market cap reported prior to the COVID period.
This is expected as ABI’s profitability in fiscal 2021 has been reduced by nearly 50%.
Therefore, is ABI’s stock a buy going into fiscal 2022 considering the significant recovery seen in fiscal 2021?
Probably.
AB InBev has guided for a minimum of 10% growth in the normalized EBITDA for fiscal 2021 and the growth momentum is likely to continue into fiscal 2022 based on the trend of the plots.
Let’s see.
References and Credits
1. All financial figures in this article were obtained and referenced from AB InBev’s annual and quarterly statements available in AB InBev Financial Results.
2. Featured image was used under Creative Common Licenses and obtained from N i c o l a and Roger W.
Trending Statistics That You May Find Useful
Disclosure
The content in this article is for informational purposes only and is neither a recommendation nor a piece of financial advice to purchase a stock.
If you find the information in this article helpful, please consider sharing it on social media and also provide a link back to this article from any website so that more articles like this one can be created in the future. Thank you!

