Tobacco. Flickr Image.
Altria Group (NYSE:MO) is widely regarded as one of the best-run companies globally. Altria’s portfolio includes not only cigarettes but also oral tobacco products and wine.
In addition to traditional tobacco products, the company has ventured into non-combustible products like the IQOS and its related consumables through a licensing agreement with Philip Morris International (PMI).
Altria is the licensed distributor of PMI’s IQOS and its consumables in the U.S. The tobacco industry is highly competitive and requires substantial investment and time to build robust brands and a comprehensive distribution network.
Beyond the significant upfront capital requirement, entering the tobacco and cigarette business is challenging due to stringent regulatory environments. This has resulted in Altria having a significant competitive advantage, with few serious competitors.
Consequently, Altria is highly profitable and has consistently generated substantial profits over the years.
With its significant profits, Altria has been able to return large amounts of cash to stockholders through stock buybacks and cash dividends.
This article examines Altria’s profitability on a per-employee basis, analyzing the company’s total workforce, gross profit per employee, operating profit per employee, and net profit per employee.
Let’s grab the details!
Investors looking for other statistics about the company may find more information on these pages: Altria vs Philip Morris International, Altria cash flow analysis, and Altria cigarette sales and market share.
Please use the table of contents to navigate this page.
Table Of Contents
Definitions And Overview
Total Workforce
A1. Number Of Employees Worldwide
Profit Per Employee
B1. Gross Profit Per Employee
B2. Operating Profit Per Employee
B3. Net Profit Per Employee
Conclusion And Reference
S1. Conclusion
S2. References and Credits
S3. Disclosure
Definitions
To help readers understand the content better, the following terms and glossaries have been provided.
Profit Per Employee: Profit per employee is a financial metric used to measure a company’s efficiency in generating profits relative to its workforce size.
It provides insight into how effectively a company uses its human resources to drive profitability. This metric is particularly valuable for comparing companies within the same industry or assessing a company’s performance over time.
Here’s a detailed breakdown:
Calculation
Formula:
\[\text{Profit per Employee} = \left( \frac{\text{Gross Profit | Operating Profit | Net Profit}}{\text{Number of Employees}} \right)\]
Components:
1a. Gross Profit: The gross profit represents the difference between a company’s revenue and the cost of goods sold (COGS). It measures the efficiency of a company in producing and selling its products by highlighting the amount of money left over from revenues after accounting for the direct costs of producing the goods.
1b. Operating Profit: Operating profit, also known as operating income or operating earnings, is a financial metric measuring the profit a company makes from its core business operations, excluding any income or expenses from non-operational activities such as taxes and interest.
1c. Net Profit: This is the company’s total revenue minus all its expenses, taxes, and costs. It represents the final amount of profit the company has earned during a specific period.
2. Number of Employees: This refers to the total number of full-time equivalent (FTE) employees working for the company during the same period.
Importance and Uses
1. Efficiency Indicator: It helps determine how well a company is managing its workforce and whether it is maximizing the productivity and profitability of its employees.
2. Benchmarking: Companies can use this metric to compare their efficiency against peers in the same industry. A higher profit per employee indicates better performance.
3. Performance Tracking: By monitoring changes in profit per employee over time, companies can assess the impact of operational changes, such as new technologies or processes, on their profitability.
Benefits
1. Resource Allocation: Helps in understanding if the company is deploying its human resources effectively.
2. Cost Management: Offers insights into potential areas where the company might reduce costs and improve profitability.
3. Strategic Planning: Assists in making informed decisions about hiring, training, and other HR-related investments.
Limitations
1. Industry Variability: Different industries have varying norms for profit per employee, so comparisons should be industry-specific.
2. Contextual Factors: It does not account for the different roles, responsibilities, and productivity levels of individual employees.
By analyzing profit per employee, companies can gain a clearer understanding of their operational efficiency and make more informed strategic decisions.
Number Of Employees Worldwide
Altria-total-employees-worldwide
(click image to expand)
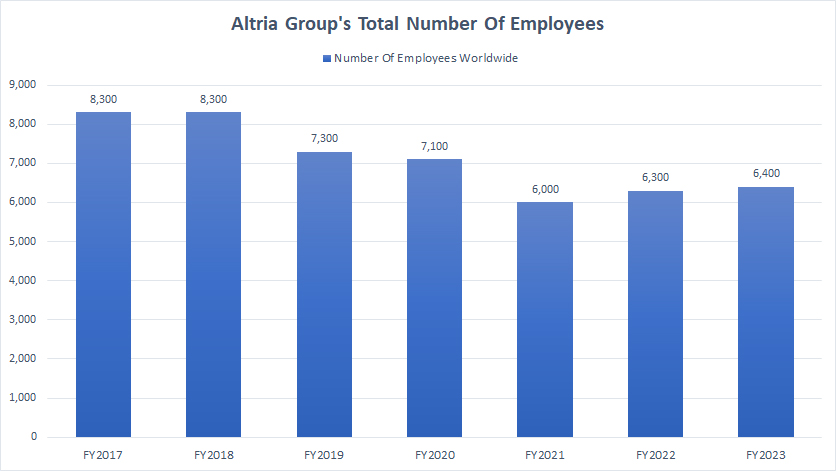
By the end of fiscal year 2023, Altria’s workforce had grown to 6,400 employees globally, a slight increase from 6,300 employees in the prior year.
Although Altria’s workforce has substantially grown since fiscal year 2021, reaching a record 6,400 employees in fiscal year 2023, this figure remains significantly lower than the previous highs of over 8,000 employees recorded in fiscal years 2017 and 2018, as shown in the graph above.
A major factor contributing to the decline in Altria’s total employees over the years is the challenges faced by the tobacco industry. For instance, declining cigarette sales and rising competition from non-combustible alternatives have pressured Altria to adapt and transform its business model.
Gross Profit Per Employee
Altria-gross-profit-per-employee
(click image to expand)
You can find the definition of Altria’s gross profit per employee here: gross profit per employee.
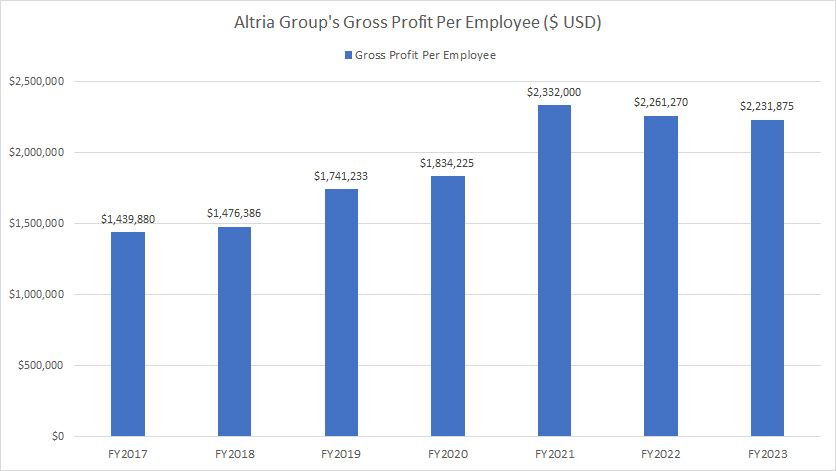
Despite Altria’s plummeting global employees, which we saw in prior discussions, its gross profit per employee has significantly risen, as shown in the picture above.
For example, Altria’s gross profit per employee has increased by 57% since fiscal year 2017, rising from $1.4 million per employee to a staggering $2.2 million in six years. In fiscal year 2023, Altria’s gross profit per employee reached a record figure of $2.2 million, one of the record highs since 2017.
The key factor contributing to the rise in Altria’s profit per employee is the company’s effective cost management. By driving down expenses, Altria has successfully increased its profit margins.
Operating Profit Per Employee
Altria-operating-profit-per-employee
(click image to expand)
You can find the definition of Altria’s operating profit per employee here: operating profit per employee.
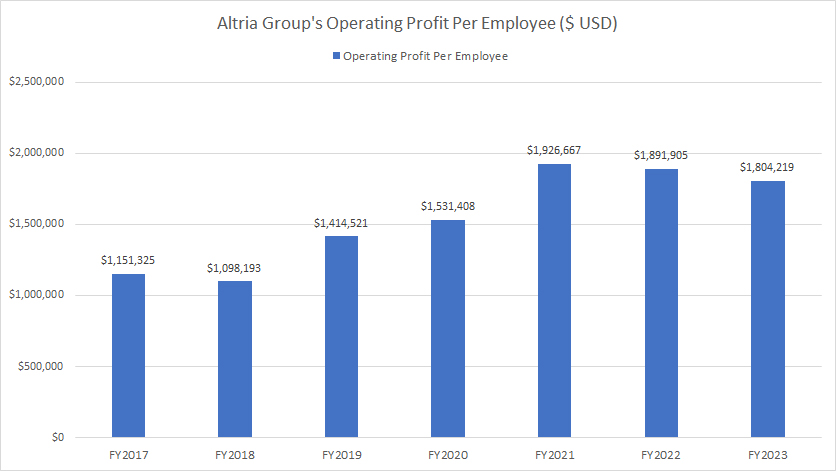
Like gross profit per employee, Altria’s operating profit per employee has also seen a significant increase since fiscal year 2017, reaching a new high of $1.8 million in fiscal year 2023.
Since fiscal year 2017, Altria’s operating profit per employee has increased by 50%, growing from $1.2 million to $1.8 million over a six-year period.
Altria’s increasing operating efficiency has again driven the growth in operating profit per employee. By focusing on enhancing its operational efficiency, Altria has achieved higher profitability while maintaining a relatively stable workforce.
Net Profit Per Employee
Altria-net-profit-per-employee
(click image to expand)
You can find the definition of Altria’s net profit per employee here: net profit per employee.
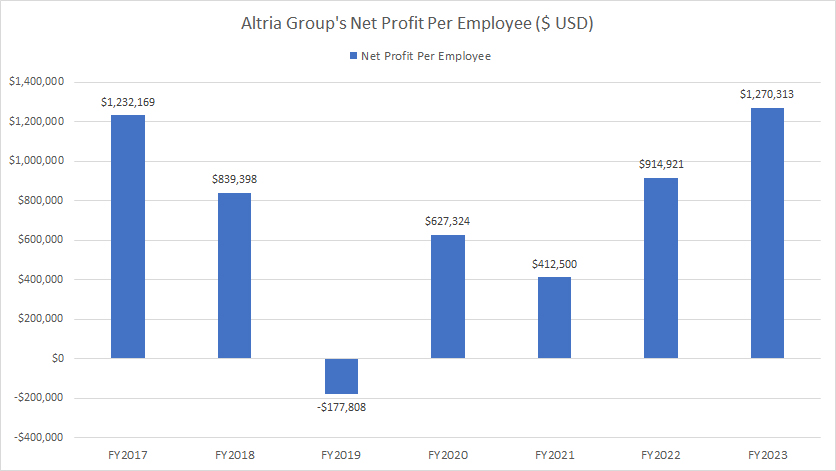
Altria’s net profit per employee has also been increasing in the last several years, as presented in the chart above. In fiscal year 2023, Altria produced $1.3 million in net profit per employee, a record figure since 2017 and up 40% from the prior year.
Additionally, Altria’s net profit per employee has been positive in most fiscal years, with the exception of fiscal year 2019 when the company incurred a loss.
The strong performance of key products like Marlboro and the growth of its oral tobacco products have contributed to higher net profit per employee. For more details, refer to these articles: Altria margins by product category and Altria profit by product category.
Summary
In summary, Altria’s strategic focus on efficiency and product performance has enabled it to achieve substantial profits per employee despite challenges in the tobacco industry.
Credits And References
1. All financial data presented in this article were obtained and referenced from Altria’s annual reports published in the company’s investors relation page: Altria’s SEC Filings.
2. Flickr Images.
Disclosure
References and examples such as tables, charts, and diagrams are constantly reviewed to avoid errors, but we cannot warrant the total correctness of all content.
The content in this article is for informational purposes only and is neither a recommendation nor a piece of financial advice to purchase a stock.
If you find the information in this article helpful, please consider sharing it on social media and provide a link back to this article from any website so that more articles like this can be created.
Thank you!


