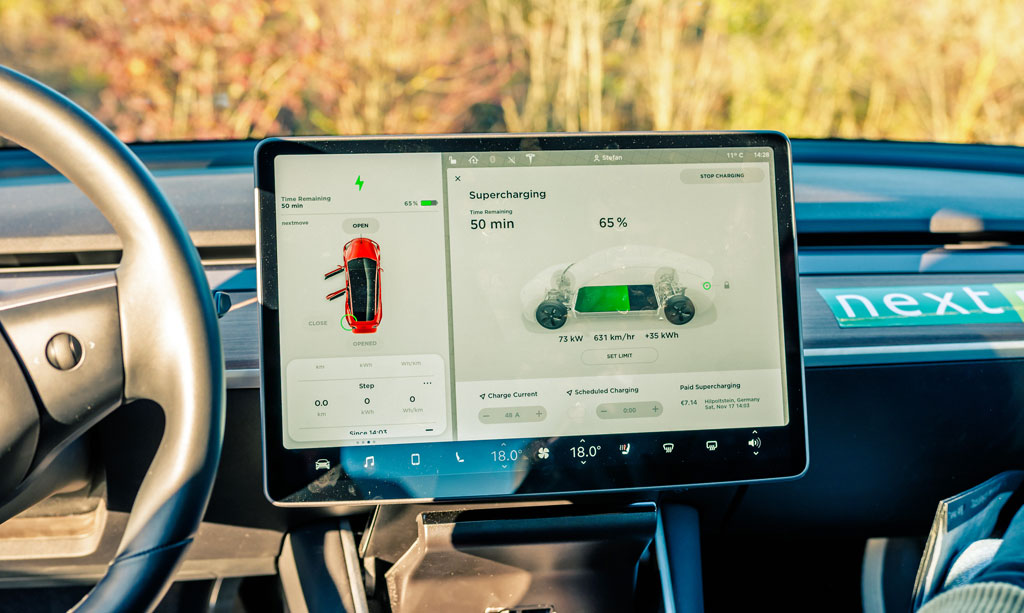
The Interior of a Model 3. Flickr Image.
This article presents Tesla’s car sales revenue excluding the sales from regulatory credits.
Apart from the car revenue figures, we also look at the gross margin, growth rates, and ratio to total revenue.
Let’s take a look!
Please use the table of contents to navigate this page.
Table Of Contents
Overview And Definitions
Automotive Sales Revenue Figures
A1. Car Sales Revenue By Year
A2. Car Sales Revenue By Quarter
A3. Car Sales Revenue By TTM
Automotive Sales Revenue Growth Rates
B1. Car Sales Revenue YoY Growth Rates
Automotive Sales Revenue Gross Margin
As A Percentage Of Total Revenue
D1. Car Sales Revenue To Total Revenue Ratio
Conclusion And Reference
S1. Conclusion
S2. References and Credits
S3. Disclosure
Definitions
To help readers understand the content better, the following terms and glossaries have been provided.
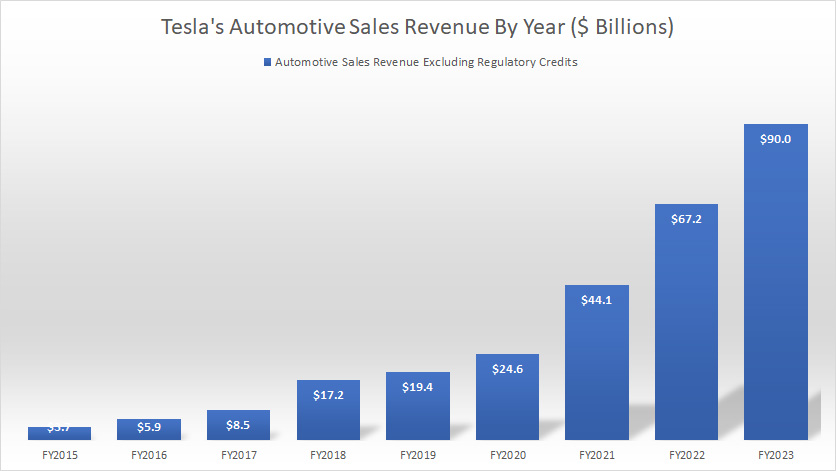
Automotive Sales Revenue: Tesla’s automotive sales revenue or car sales revenue refers to the total amount of money earned by the company through the sale of electric vehicles. As of 2023, Tesla’s car sales revenue is estimated at nearly US$90 billion.
This figure includes the sales of various models, such as the Model S, Model X, Model 3, and Model Y. Tesla has been experiencing steady growth in their car sales revenue over the years as more people are becoming interested in electric vehicles as a sustainable alternative to traditional gasoline-powered cars.
Regulatory Credits: Regulatory credits are a type of financial instrument that companies in the automotive industry earn for producing vehicles with lower carbon emissions than the regulatory requirements set by the government.
These credits can be bought and sold between companies and used to offset the emissions of vehicles that do not meet the regulatory requirements. In the case of Tesla, regulatory credits have been a significant source of revenue as the company has consistently exceeded the emissions standards set by various governments.
Car Sales Revenue By Year
Tesla-car-sales-revenue-by-year
(click image to expand)
Tesla earned US$67.2 billion in fiscal 2022 from the sales of electric vehicles excluding regulatory credits.
Tesla’s car sales revenue is estimated to exceed US$90 billion by the end of fiscal 2023 on the back of 1.8 million to 2.0 million vehicle sales.
Car Sales Revenue By Quarter
Tesla-car-sales-revenue-by-quarter
(click image to expand)
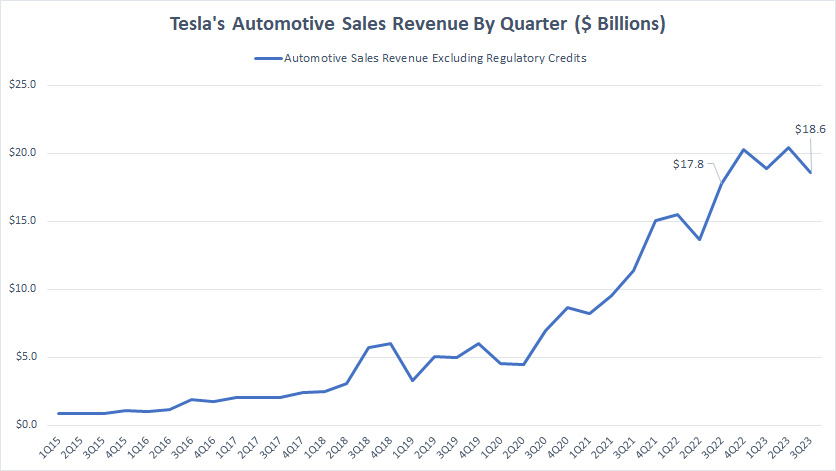
Tesla’s car sales revenue totaled US$18.9 billion, US$20.4 billion, and US$18.6 billion in the first three quarters of 2023, respectively.
Tesla’s quarterly car sales revenue of US$18.6 billion reported in 3Q 2023 represents a YoY growth rate of 5%.
Car Sales Revenue By TTM
Tesla-car-sales-revenue-by-ttm
(click image to expand)
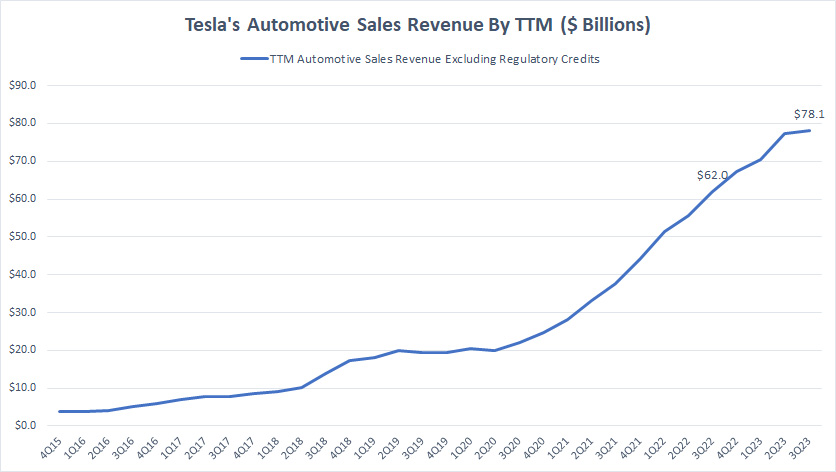
Tesla’s car sales revenue reached US$78.1 billion on a TTM basis as of 3Q 2023, a record figure since 2015 and up 26% year over year.
A noteworthy trend is that Tesla’s car sales revenue appeared to defy the disruption caused by the pandemic, including the materials shortages and a high inflationary environment during the pandemic between 2020 and 2023.
The TTM plot above shows no decline in Tesla’s car sales revenue between 2020 and 2023.
On the other hand, conventional automobile companies such as General Motors and Ford have experienced negative revenue growth during those periods as shown in these articles: GM Revenue By Country And Ford Revenue Streams.
Car Sales Revenue YoY Growth Rates
Tesla-car-sales-revenue-YoY-growth-rates
(click image to expand)
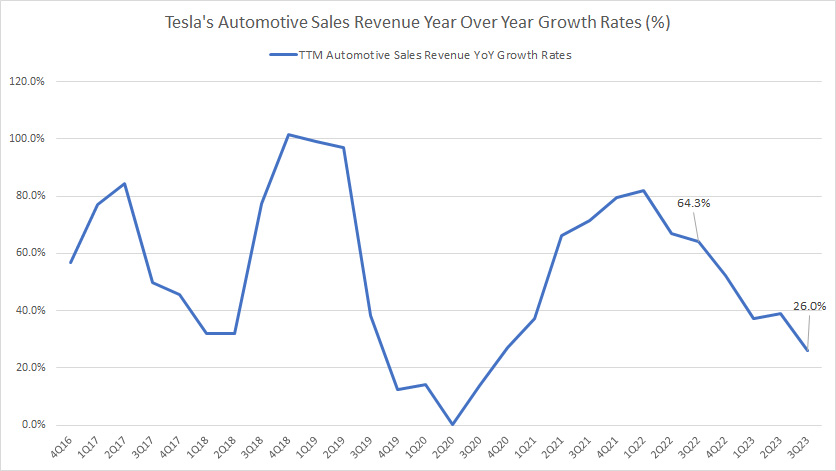
Tesla’s car sales revenue has grown at an average growth rate of 53% since 2016, and the latest figure came in at 26%, down significantly from a year ago.
Since 2023, Tesla’s YoY growth rate for car sales revenue has significantly declined, suggesting that the company’s electric vehicle sales revenue may be slowing down.
Although car sales revenue has significantly slowed in 2023, it still grew 26% YoY as of 3Q 2023, still an impressive result by all measures.
Car Sales Gross Margin
Tesla-car-sales-gross-margin
(click image to expand)
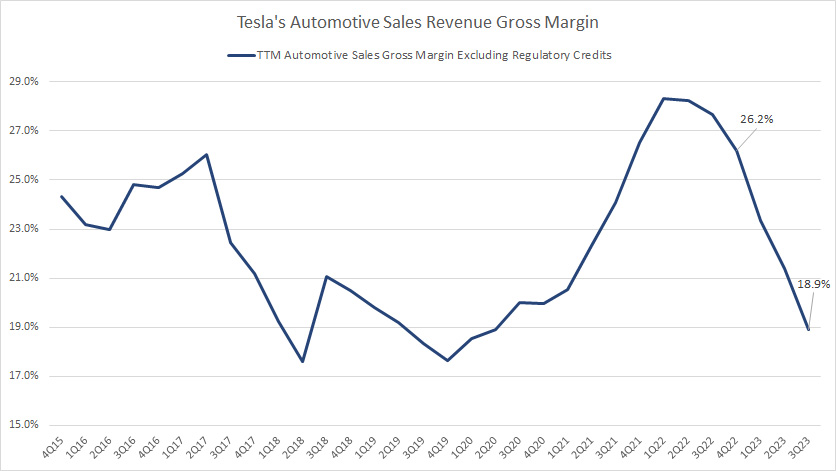
Besides slowing revenue growth, Tesla’s car sales gross margin has also significantly declined since 2022.
As of 3Q 2023, Tesla’s car sales gross margin totaled 18.9%, down significantly from the 26.2% gross margin measured a year ago.
Car Sales Revenue To Total Revenue Ratio
Tesla-car-sales-revenue-to-total-revenue-ratio
(click image to expand)
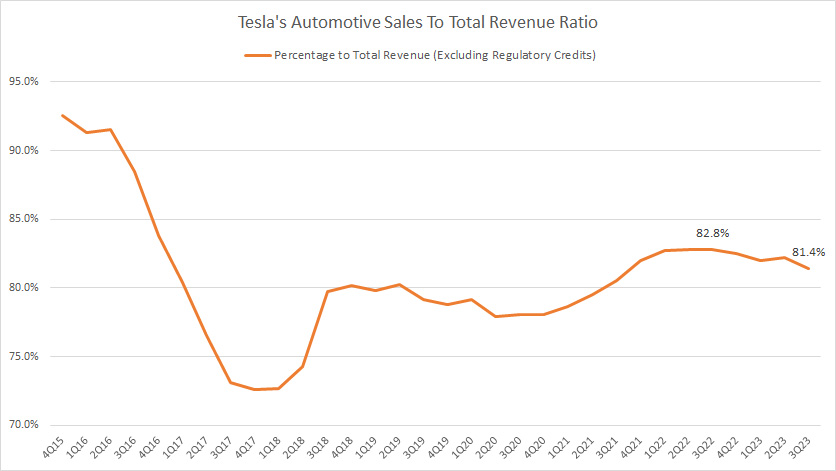
Tesla’s car sales revenue contributes to over 80% of the company’s total revenue, making it the company’s largest revenue source.
This ratio came in at 81.4% as of 3Q 2023, down slightly from a year ago.
Interestingly, the car sales revenue to total revenue ratio has significantly declined since 2015.
The decline should be driven by the surge of Tesla’s other revenue segments, including its energy revenue, automotive leasing, and services revenue.
In short, Tesla is gradually evolving into more than just a car manufacturer.
Conclusion
Tesla, the electric vehicle manufacturing company, has been growing its car sales revenue steadily over the years. In 2022, the company reported a total revenue of $81 billion, of which $67 billion came from car sales. This significantly increased from the $54 billion revenue generated in 2021, with $44 billion from automotive sales.
Tesla’s revenue growth can be attributed to the increasing demand for electric vehicles and the company’s focus on research and development to improve the technology and performance of its cars. In addition, Tesla’s innovative marketing and sales strategies, such as direct-to-consumer sales and online ordering, have also contributed to its success.
In the first three quarters of 2023, Tesla reported revenue of $72 billion, with $58 billion from car sales. Despite the challenges posed by the COVID-19 pandemic, the company delivered 1.3 million vehicles, a 40% increase from the same period in 2022.
Overall, Tesla’s car sales revenue has been on an upward trend, and the company’s continued focus on innovation and sustainability suggests that it will continue to lead the way in the electric vehicle market.
References and Credits
1. All financial figures presented in this article were obtained and referenced from Tesla’s quarterly and annual reports, SEC filings, investors letters, press releases, etc., which are available in Tesla SEC Filings.
2. Featured images in this article are used under a Creative Commons license and sourced from the following websites: Jakob Härter.
Disclosure
References and examples such as tables, charts, and diagrams are constantly reviewed to avoid errors, but we cannot warrant the total correctness of all content.
The content in this article is for informational purposes only and is neither a recommendation nor a piece of financial advice to purchase a stock.
If you find the information in this article helpful, please consider sharing it on social media and provide a link to this article from any website so that more articles like this can be created.
Thank you!
