
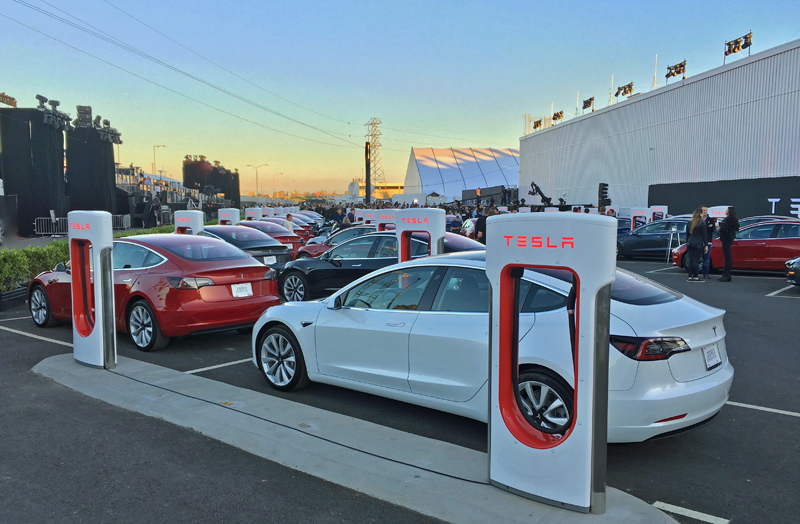
Tesla Model 3 ready for delivery. Source: Flickr
In this article, we will focus on the return on investment or ROI of Tesla. But what exactly is the return on investment? The ROI is the measure of operating surplus with respect to the underlying assets or the return of net profit with respect to equity.
Specifically, “return on total assets (ROTA)” and “return on equity (ROE)” are exactly the 2 metrics that we need to analyze Tesla’s return on investment or ROI.
Let’s head out to the numbers!
For other key statistics of Tesla, you may find more resources on this page: Tesla key stats.
Please use the table of contents to navigate this page.
Table Of Contents
Definitions And Overview
Insight & Summary of Observed Trends
Z1. Insight & Summary of Tesla’s Return On Investment (ROI)
ROI Statistics
Profitability
A1. Operating Income and Net Income
Assets and Equity
B1. Total Assets and Total Equity
Return On Investment
C1. Return on Total Assets (ROTA) and Return On Equity (ROE)
Reference, Credits, and Disclosure
S1. References and Credits
S2. Disclosure
Definitions
To help readers understand the content better, the following terms and glossaries have been provided.
Return On Total Assets (ROTA): The return on total assets is arguably the most important measurement in assessing a company’s ROI. It can be derived from the equation below:
ROTA = (EBIT / Total Assets ) X 100%
From the equation above, EBIT stands for earnings before interest and taxes. In other terms, the EBIT is also referred to as the operating income.
It’s the profit after all operating cost and expense is deducted from revenue, but before interest and taxes are accounted for.
As seen from the equation, ROTA relates the operating aspect of the company to total assets. It is a measure of the operating efficiency of the company.
In general, there are 3 main operating variables the ROTA equation is assessing, namely total revenue, total expenses, and total assets.
By analyzing the 3 main operating variables, ROTA provides a comprehensive analysis of management efficiency in managing the company assets to generate the required operating surplus.
Of course, a higher ROTA ratio reflects better management efficiency in utilizing all the assets.
Return On Equity (ROE): While ROTA measures the operating efficiency, return on equity (ROE) looks at how that operating efficiency is translated into benefits to stockholders. ROE can be derived from the equation below:
ROE = (EAT / Stockholders’ Equity ) X 100%
From the equation, EAT stands for earnings after tax. It’s also referred to as the net income or net profit. Net income is the profit after all operating expenses, interest payments, and taxes are accounted for.
Similar to ROTA, ROE is also arguably one of the most important ratios that measure the efficiency of a business in driving values for shareholders.
The higher the ratio, the better the return to shareholders. You may notice that ROE is a ratio that is largely driven by ROTA. Without a good ROTA, a company finds it almost impossible to generate a satisfactory ROE.
Insight & Summary of Tesla’s Return On Investment (ROI)
The following analysis consolidates the trends observed across Tesla’s ROI for the 2015–2025 period.
-
Tesla’s ROI trajectory is a textbook illustration of a capital-intensive growth company transitioning through three distinct phases: sustained loss (2015–2019), breakout profitability (2020–2022), and compressing returns (2023–2025). EBIT moved from -$716M (2015) to a peak of $13,656M (2022) before declining to $4,355M (2025). Net earnings followed a similar arc but with greater volatility driven by non-operating items — notably the extraordinary $14,997M net income in FY2023, which was partially driven by deferred tax asset recognition rather than operating improvement. The 3-year averages of $6,774M EBIT and $8,627M net earnings reflect a company generating meaningful profit but well below its 2022 peak.
-
The loss phase (2015–2019) was deeper and longer than most investors anticipated at the time. Tesla sustained negative EBIT for five consecutive years, peaking at -$1,632M in 2017 — the year of the Model 3 production ramp disaster that consumed enormous capital and cash. Net losses were consistently worse than EBIT losses due to interest expense on the substantial debt load carried during this period. ROTA and ROE were deeply negative throughout: ROTA ranged from -8.8% (2015) to -0.2% (2019), while ROE ranged from -78.5% (2015) to -10.6% (2019). The -78.5% ROE in 2015 reflects the extreme leverage of a pre-scale company with a small equity base being eroded by losses. By 2019, both metrics had moderated significantly — ROTA at -0.2% and ROE at -10.6% — signalling that the transition to profitability was imminent.
-
The breakout phase (2020–2022) produced some of the fastest ROI improvement in modern automotive history. ROTA surged from 3.8% (2020) to 16.6% (2022) in just two years — a 1,280 basis point improvement driven by simultaneous revenue scaling, operating leverage on the fixed manufacturing base, and margin expansion from strong EV pricing. ROE went from 3.0% (2020) to 27.4% (2022) — a 2,440 basis point expansion that placed Tesla among the top-tier ROE generators in global technology, well above any automotive peer. The 2022 reading of 16.6% ROTA is the highest for any major global automaker in recent history and reflects the unusual combination of Tesla’s asset-light-relative-to-revenue model (achieved through high factory utilisation and low dealer/service infrastructure overhead compared to legacy OEMs) and peak-cycle pricing power in the EV market.
-
The compression phase (2023–2025) is the most consequential trend in the dataset for current investors. ROTA declined from 16.6% (2022) to 8.3% (2023), 5.8% (2024), and 3.2% (2025) — a 1,340 basis point decline over three years. ROE similarly collapsed from 27.4% (2022) to 23.6% (2023), 9.6% (2024), and 4.6% (2025). The 3-year averages — ROTA 5.8%, ROE 12.6% — are artificially elevated by the 2023 reading; the current-year run-rate is ROTA 3.2% and ROE 4.6%, which are near the lower end of Tesla’s post-profitability history and approaching the rates typically associated with capital-constrained legacy automotive companies rather than technology premium vehicle manufacturers.
-
The divergence between ROTA and ROE trajectories reveals the role of Tesla’s equity structure in the ROI story. Through the loss phase, ROE was dramatically more negative than ROTA because small equity bases amplified losses. Through the breakout phase, ROE expanded faster than ROTA as equity grew more slowly than asset profitability improved. In the compression phase, ROE has declined faster than ROTA in 2024–2025 because Tesla’s equity base has grown rapidly (from $45.9B in 2022 to $82.9B in 2025 — an 80% increase driven by retained earnings and SBC-driven equity issuance) while net income has fallen. The combination of a growing equity denominator and falling net income numerator makes ROE particularly sensitive in the current environment. ROTA’s 3.2% in 2025 is still positive and reflects a real return on a $137.8B asset base — it is not a return to loss territory — but it implies Tesla’s massive asset base is generating modest returns relative to its peak.
-
Total assets and equity growth have substantially outpaced earnings growth — the primary structural driver of ROI compression. Total assets grew from $82.3B (2022) to $137.8B (2025) — a 67.4% increase — driven by continued manufacturing capacity expansion (Gigafactories Texas, Berlin, and Mexico preparation), energy storage product investment, Supercharger network, and AI/robotics infrastructure (Dojo). Total equity grew from $45.9B to $82.9B over the same period. Unless EBIT returns to 2022 levels, the expanding asset and equity bases will continue to dilute ROTA and ROE structurally. This is the core ROI tension Tesla faces: it is investing heavily for future growth while its current-period profitability has declined, producing denominator expansion without proportional numerator growth.
-
Structural Takeaway: Tesla’s ROI profile in 2023–2025 is that of a company mid-cycle between its 2022 peak returns and whatever equilibrium state its investments in Dojo, FSD, Robotaxi, Optimus, and Megapack will eventually produce. The 3.2% ROTA and 4.6% ROE in 2025 are adequate — the company is profitable and returning something on invested capital — but they are not the metrics that justified Tesla’s premium valuation. The path back to 10%+ ROTA requires either a substantial EBIT recovery (new products, higher ASP, FSD monetisation) or a period of asset base growth pause. Given the current investment programme, ROTA recovery is most likely to come from the revenue side rather than asset restraint.
The table below combines all key Tesla’s return on investment (ROI) metrics into a single view for the latest three fiscal years.
Tesla ROI — Consolidated Averages (FY2023–2025)
| Metric | Average (FY2023–2025) |
|---|---|
| Profitability ($M) | |
| Earnings Before Interest and Tax (EBIT) | $6,774 |
| Net Earnings Available to Common Stockholders | $8,627 |
| Assets & Equity ($M) | |
| Total Assets | $122,165 |
| Total Equity | $73,385 |
| Return on Investment | |
| Return On Total Assets (ROTA) | 5.8% |
| Return On Equity (ROE) | 12.6% |
Operating Income and Net Income
The operating income or earnings before interest and tax (EBIT) is one of the required variables in the measurement of ROTA as discussed in the above equation.
Similar to operating income, the net income or earnings after tax (EAT) is one of the required components in the calculation of return on equity (ROE).
Tesla Profitability ($M) — Average (FY2023–2025)
| Metric | Average (FY2023–2025) |
|---|---|
| Earnings Before Interest and Tax (EBIT) | $6,774 |
| Net Earnings Available to Common Stockholders | $8,627 |
Total Assets and Total Equity
Tesla Total Assets & Equity ($M) — Average (FY2023–2025)
| Metric | Average (FY2023–2025) |
|---|---|
| Total Assets | $122,165 |
| Total Equity | $73,385 |
Return On Total Assets (ROTA) and Return On Equity (ROE)
The definition of ROTA and ROE is available here: return on total assets and return on equity.
Tesla Return on Investment — Average (FY2023–2025)
| Metric | Average (FY2023–2025) |
|---|---|
| Return On Total Assets (ROTA) | 5.8% |
| Return On Equity (ROE) | 12.6% |
References and Credits
1. All financial figures presented in this article were obtained and referenced from Tesla’s annual reports published in Tesla Investor Relations.
2. Flickr images.
Back To Table Of Contents
Disclosure
We may use artificial intelligence (AI) tools to assist us in writing some of the text in this article. However, the data is directly obtained from original sources (usually the quarterly and annual reports) and meticulously cross-checked by our editors multiple times to ensure its accuracy and reliability.
If you find the information in this article helpful, please consider sharing it on social media. Additionally, providing a link back to this article from any website can help us create more content like this in the future.
Thank you for your support and engagement! Your involvement helps us continue to provide high-quality, reliable content.
Great summary of ratio analysis, plus I seem to agree with the conclusion you come up with.
Also read your post of stock dilution over the years which match your statement of tesla being on “life support”. Makes me wonder which tools and valuation models wall street analysts are using to justify such high price targets with little explicit positive fundamentals to rely on.
Thanks for the feedback. I would love to hear what readers have to say. Please do not hesitate to pinpoint and criticize if you found any mistake or discrepancy in the article.
Yes, “life support” is certainly a good way of explaining it.
Similar to the term “outpatient care” that was used by another author to describe parents paying for their adult children’s financial obligations year in and year out with no end in sight.
So, in summary…based upon financial facts…it appears that the stock price has a good percentage of “irrational exuberance” embedded within.
Although I wish all the best to Tesla, it’s interesting to note that any mainstream company that dared to put up such a long string of red numbers would see their stock price get hammered immediately with calls for some or all of the C-suite to resign.