
Ford Motor Company. Source: Flickr
Tesla and Ford Motor Company represent two distinct approaches to the automotive industry, with Tesla focusing exclusively on electric vehicles (EVs) and Ford balancing a portfolio that includes traditional internal combustion engine (ICE) vehicles, hybrids, and EVs.
Tesla’s success stems from its direct-to-consumer sales model, advanced battery technology, and strong branding as an industry disruptor. Ford, meanwhile, benefits from its legacy infrastructure, widespread dealership network, and extensive experience in manufacturing.
Despite the difference, both companies are investing heavily in EV technology, with Ford expanding its EV lineup (Mustang Mach-E, F-150 Lightning) and Tesla continuing to dominate the market with its Model S, 3, X, and Y.
In addition, both companies prioritize technological advancements, including autonomous driving, battery technology, and software integration. Tesla leads in AI-driven self-driving capabilities, while Ford is developing its own autonomous vehicle systems.
In this article, we will look at the research and development spendings of both companies.
Apart from the R&D absolute values, we explore several R&D ratios such as the R&D to revenue, R&D to costs and expenses, and R&D to profit.
Let’s look at the results!
Investors interested in the R&D spending of other companies may find more resources on these pages:
R&D Comparison: Automotive
R&D Comparison: Semiconductor
R&D Comparison: Social Media
Please use the table of contents to navigate this page.
Table Of Contents
Definitions And Overview
O2. Are companies with high R&D to revenue and profit ratio taking significant risk?
O3. What does a high R&D to expense ratio mean?
R&D Spending
A1. Research And Development Spending
R&D Growth Rates
R&D Ratios
C1. R&D To Revenue Ratio
C2. R&D To Total Costs And Expenses Ratio
C3. R&D To Profit Ratio
Summary And Reference
S1. Insight
S2. References and Credits
S3. Disclosure
Definitions
To help readers understand the content better, the following terms and glossaries have been provided.
R&D To Revenue Ratio: The research and development expenses to revenue ratio is a financial metric that measures the amount of money a company spends on research and development (R&D) activities as a proportion of its total revenue.
This ratio assesses a company’s innovation investment and ability to generate new products and services. A high R&D expenses to revenue ratio may indicate a company investing heavily in research and development, which could lead to long-term growth and profitability. On the other hand, low R&D expenses to revenue ratio may suggest that a company is not investing enough in innovation and may struggle to compete in the market.
R&D To Expenses Ratio: The R&D to expenses ratio is a financial metric that measures the amount of money a company spends on research and development compared to its total expenses. It is calculated by dividing the company’s R&D expenses by its total expenses for a given period.
The higher the ratio, the more the company invests in research and development relative to its other expenses. Investors and analysts often use this ratio to evaluate a company’s commitment to innovation and potential for future growth.
Are companies with high R&D to revenue and profit ratio taking significant risk?
Yes, companies with a high R&D-to-revenue ratio are taking a significant risk. Investing heavily in research and development does not always guarantee success. There is always a risk that the company’s R&D efforts may not result in the development of a successful product or service.
However, companies willing to take this risk are often the ones most successful in the long run. By investing in innovation, they can stay ahead of their competitors and create new opportunities for growth and profitability.
What does a high R&D to expense ratio mean?
A high R&D-to-expenses ratio typically indicates that a company invests significant resources in research and development activities. This suggests that the company is committed to innovation and creating new products or services, which may help it to stay competitive in the long term.
A high ratio may also indicate that the company is pursuing disruptive technologies or new markets that require significant investment in R&D. However, a high R&D to expenses ratio may also suggest that a company is taking on more risk, as R&D projects may not always result in successful products or services.
Ultimately, the interpretation of a high R&D-to-expenses ratio will depend on the specific industry and market conditions in which the company operates.
Research And Development Spending
Ford Motor R&D Spending
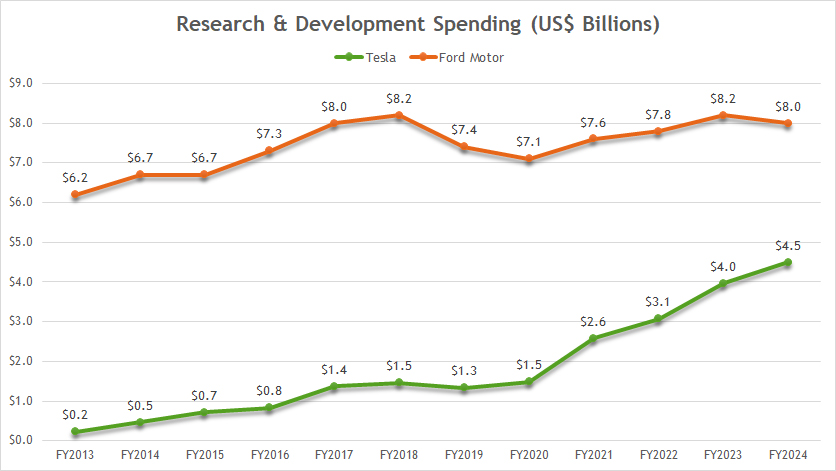
Ford’s R&D spending has significantly increased since 2013, reaching $8.0 billion as of fiscal year 2024. Ford’s research and development spending averaged roughly $7.7 billion between 2020 and 2024.
The same goes for Tesla. Its R&D expense also has significantly increased since 2013, totaling over $4.5 billion as of fiscal year 2024. Between 2020 and 2024, Tesla’s spending on research and development averaged only $3.1 billion, a far smaller figure than Ford Motor.
As Ford spends significantly more on research and development, its average R&D budget is roughly 3X higher than Tesla’s. In fiscal 2024, Ford’s R&D budget was nearly 80% more than Tesla’s figure.
Although Ford’s R&D expenditure is much higher, the gap between both companies has significantly narrowed recently. If you have noticed, the difference in R&D expenses between the two automakers was much higher in 2013.
Since 2013, Tesla has managed to narrow the gap with Ford Motor in terms of research anmd development.
R&D YoY Growth Rates
Ford Motor R&D Spending Growth Rates
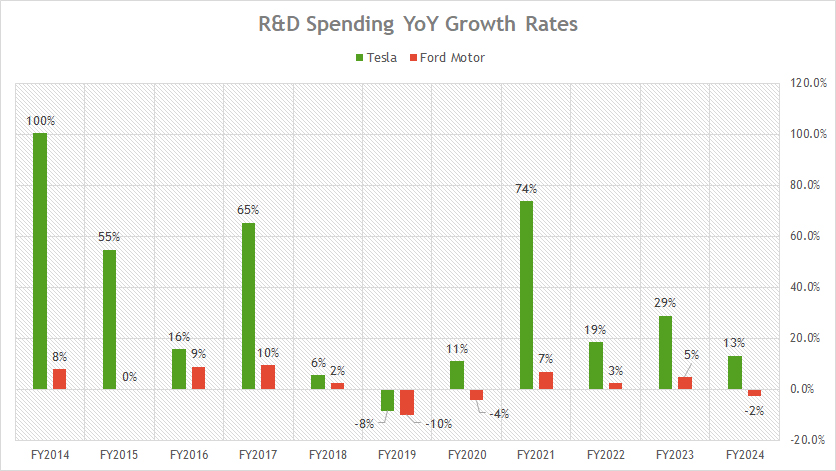
From the perspective of R&D growth, Tesla has registered much higher growth rates than Ford, as shown in the chart above.
For example, Ford’s R&D growth averaged just 1.7% over the past five years spanning from 2020 to 2024, while Tesla’s figure averaged 29% for the same period.
Therefore, Ford’s R&D expenses have grown by an average of only 2% annually over the past five years, while Tesla’s R&D expenses have significantly soared.
R&D to Revenue Ratio
Ford Motor R&D Spending To Revenue Ratio
The definition of R&D to revenue ratio is available here: R&D To Revenue Ratio.
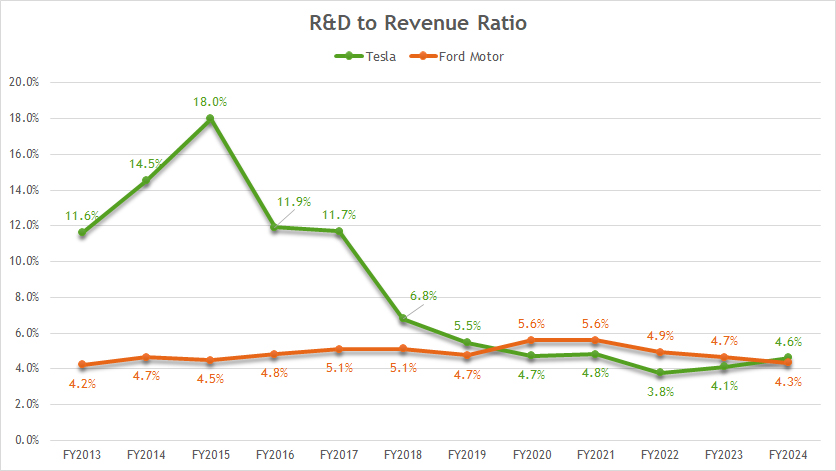
Tesla used to have a much higher R&D to revenue ratio, topping as much as 18% in 2015, the highest ratio ever measured. However, this figure has significantly declined over time and landed at just 4.6% as of fiscal year 2024.
On the other hand, Ford’s ratio has remained relatively unchanged and came in at 4.3% in fiscal year 2024, roughly in line with Tesla’s result.
As a result, both automakers have roughly the same R&D expenses to revenue ratios, indicating that their R&D intensity is at around the same level.
For your information, Ford’s total revenue is much higher than Tesla’s revenue.
R&D to Total Costs and Expenses Ratio
Ford Motor R&D Spending To Total Costs And Expenses Ratio
The definition of R&D to expenses ratio is available here: R&D To Expenses Ratio. The R&D to expenses ratio indicates the proportion of expenses allocated for research and development.
The higher the ratio, the higher the research and development spending with respect to expenses.
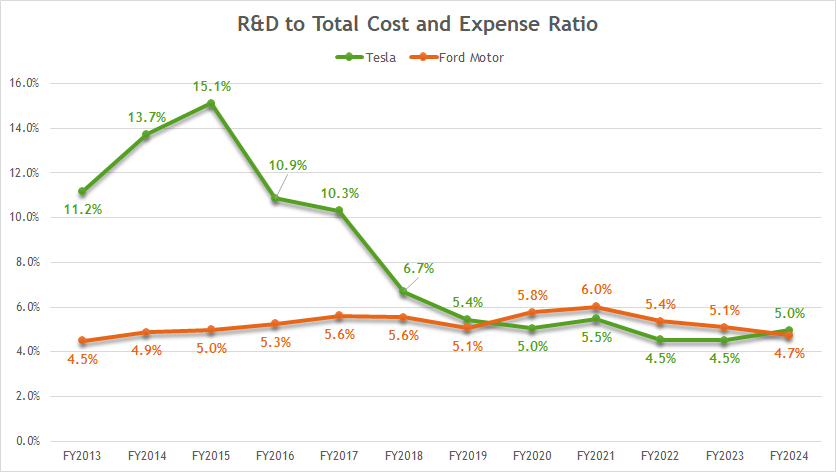
That said, Tesla used to spend a much higher proportion of its total costs and expenses on research and development, with the ratio topping as much as 15% in 2015 and 10% on average in the past.
However, Tesla’s ratios have significantly declined over the years and reached only 5.0% as of 2024.
On the other hand, Ford’s ratios have remained relatively flat but declined modestly in 2024 to 4.7% from 5.1% a year ago.
As a result, Ford Motor and Tesla spend almost an equal portions of their costs and expenses on research and development.
R&D To Profit Ratio
Ford-Motor-R&D-to-profit-ratio
(click image to expand)
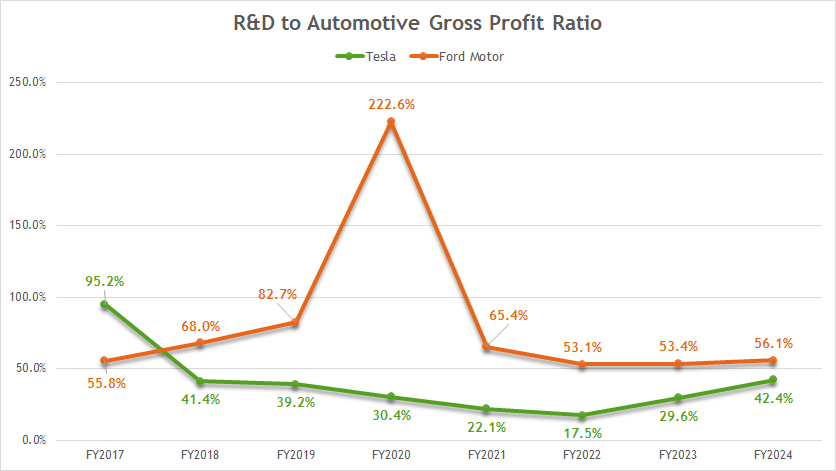
With respect to the automotive gross profit, Ford Motor’s R&D expense eats up a greater portion of its automotive gross profit, as illustrated in the chart above.
Ford’s R&D to profit ratio reached 56% in fiscal year 2024 and peaked at more than 200% in fiscal year 2020, meaning that its R&D spending exceeded its entire gross profit.
On the other hand, Tesla’s ratio was more moderate, totaling just 42% in fiscal year 2024. Despite the more moderate ratio, this figure has significantly risen since 2022, whose ratio stood at 17.5%.
Tesla’s increasing R&D to profit ratio indicates that its R&D is taking a significant bite out of its gross profit.
Insight
While Ford allocates a significantly higher absolute budget to R&D, both companies prioritize innovation at a similar intensity relative to their revenue and total expenses.
Essentially, Ford maintains a larger R&D budget, but Tesla is rapidly increasing its R&D investments, narrowing the gap.
Both companies allocate similar proportions of revenue and expenses to R&D, showing parallel commitments to innovation despite differences in scale.
Tesla’s aggressive R&D growth suggests it is expanding its capabilities faster, while Ford relies on steady investment in technology development.
References and Credits
1. All financial figures presented were obtained and referenced from Ford Motor and Tesla’s quarterly and annual reports published on the respective investor relations pages: Ford SEC Filings and Tesla Sec Filings.
2. Flickr Images.
Disclosure
We may use artificial intelligence (AI) tools to assist us in writing some of the text in this article. However, the data is directly obtained from original sources and meticulously cross-checked by our editors multiple times to ensure its accuracy and reliability.
If you find the information in this article helpful, please consider sharing it on social media. Additionally, providing a link back to this article from any website can help us create more content like this in the future.
Thank you for your support and engagement! Your involvement helps us continue to provide high-quality, reliable content.

I would be very curious to know about how much of the $7.4B Ford spent in 2019 was on Battery Electric Vehicle Technology.
Good point! As far as I know, Ford didn’t disclose the breakdown in the financial statements. But i will try to find this out.