Cruising on highway. Pexels Image.
Debt can be beneficial for a company, but it can also lead to a downfall if the company becomes unable to repay the debt. It’s no exception for General Motors (NYSE: GM).
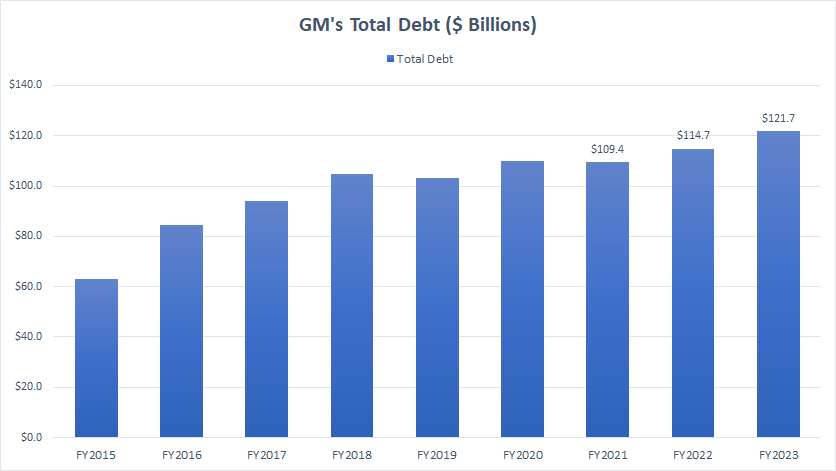
General Motors’ total debt exceeded $121B by the end of fiscal year 2023, the highest level since 2015.
This number even exceeded the company’s market capitalization, which totaled only US$50B as of 2024.
Therefore, is there a cause for concern for GM’s debt level? This article answes this question by examining several debt statistics of General Motors.
These statistics include debt figures, available cash, net debt, leverage, payments due, total liquidity, and credit rating.
Let’s get started!
Please use the table of contents to navigate this page.
Table Of Contents
Definitions And Overview
Debt
A1. Total Debt
A2. Debt Breakdown
A3. GM Financial Debt
A4. Unsecured Debt
Cash
B1. Available Cash
Net Debt
Debt Vs Revenue
D1. Debt Vs Revenue
D2. Debt To Revenue Ratio
Debt Schedules, Liquidity And Credit Rating
E1. Debt Due
E2. Sources Of Liquidity
E3. Credit Rating
Summary And Reference
S1. Conclusion
S2. References and Credits
S3. Disclosure
Definitions
To help readers understand the content better, the following terms and glossaries have been provided.
Unsecured Debt: Unsecured debt for companies like Ford is similar in principle to unsecured debt for individuals, but it involves a larger scale and different implications due to the nature of the companies being publicly traded. Here’s what it entails:
1. Nature of Unsecured Debt: Just like with personal unsecured debt, unsecured corporate debt does not require the company to provide collateral. This means the debt is based on the company’s creditworthiness and financial health rather than specific assets.
2. Instruments: Common forms of unsecured debt for publicly listed companies include corporate bonds, debentures, and commercial paper. These instruments are used to raise capital without pledging company assets.
3. Interest Rates and Credit Ratings: Since unsecured debt poses a higher risk to lenders, it typically comes with higher interest rates compared to secured debt. The interest rate a company can obtain is influenced by its credit rating, which is assessed by rating agencies like Moody’s, S&P, and Fitch. A higher credit rating indicates lower risk and therefore can result in lower interest rates for the company.
4. Use of Funds: Companies use unsecured debt to finance various activities, including expansion projects, research and development, acquisitions, and general corporate purposes. It provides flexibility without the risk of losing specific assets.
5. Investor Considerations: For investors, unsecured debt offers the potential for higher returns, but also comes with higher risk compared to secured debt. In the event of bankruptcy, unsecured creditors are paid after secured creditors, which means they might recover less of their investment.
Unsecured debt plays a crucial role in a company’s capital structure, offering flexibility and opportunities for growth while balancing the risk and cost of borrowing.
Asset-Backed Debt: Asset-backed debt, or asset-backed securities (ABS), for a corporation is a type of debt obligation secured by a pool of assets. These assets are typically financial instruments like loans, leases, credit card receivables, or other forms of debt owed to the corporation. Here’s a breakdown of what this entails:
1. Collateralization: The primary feature of asset-backed debt is that it is collateralized by a pool of underlying assets. This means that if the corporation defaults on the debt, the lenders have a claim on these assets.
2. Asset Pools: The assets that back this type of debt can vary widely. Common examples include:
– Auto Loans: Loans made to consumers for the purchase of vehicles.
– Credit Card Receivables: Outstanding credit card balances owed by consumers.
– Mortgages: Residential or commercial mortgage loans.
– Student Loans: Loans made to students to finance their education.
3. Securitization: The process of creating asset-backed debt involves securitization. The corporation pools together its receivables or other assets, packages them into securities, and sells these securities to investors. This process allows the corporation to convert its assets into cash, which can be used for further investment or operational needs.
4. Risk and Return: Asset-backed debt typically offers a higher level of security to investors compared to unsecured debt because it is backed by tangible assets. However, the quality and risk of the underlying assets can vary, affecting the interest rate and attractiveness to investors.
5. Liquidity: For the issuing corporation, asset-backed debt can be an attractive way to raise capital because it often provides a relatively low-cost financing option and can improve liquidity by converting illiquid assets into cash.
6. Regulation and Compliance: Issuing asset-backed securities requires adherence to specific regulations and accounting standards to ensure transparency and protect investors.
Asset-backed debt is a crucial tool for corporations to manage their balance sheets and finance their operations efficiently. It allows companies to unlock the value of their assets, providing a more flexible and diversified funding option.
How Does GM Use Its Debt?
General Motors (GM) uses its debt strategically to support its business operations and growth initiatives. Here’s a detailed look at how GM utilizes its debt:
1. Financing Operations: GM uses debt to finance its day-to-day operations, including the design, manufacturing, and distribution of vehicles, parts, and accessories. This helps the company maintain liquidity and manage cash flow effectively.
2. Expansion and Investment: Debt is used to fund expansion projects, research and development (R&D), and investments in new technologies, such as electric vehicles (EVs) and autonomous driving systems. This allows GM to stay competitive and innovate in the rapidly evolving automotive industry.
3. Acquisitions and Partnerships: GM leverages debt to finance acquisitions and strategic partnerships. For example, GM’s acquisition of Cruise Automation, a self-driving car startup, was partially funded through debt.
4. GM Financial: A significant portion of GM’s debt is attributed to GM Financial, the company’s captive finance arm. GM Financial provides loans and credit facilities to retail and commercial customers, as well as dealerships. This helps GM expand its market reach and boost sales by offering financing options to customers.
5. Refinancing Existing Debt: GM periodically refinances its existing debt to take advantage of lower interest rates or more favorable terms. This helps reduce interest expenses and improve the company’s financial health.
6. Maintaining Credit Ratings: By managing its debt levels and maintaining a strong credit rating, GM can access capital markets at lower costs. This is crucial for funding ongoing operations and future growth initiatives.
7. Managing Cash Flow: Debt is used to manage cash flow fluctuations, ensuring that GM has sufficient funds to meet its financial obligations, such as paying suppliers, employees, and other operational expenses.
8. Supporting Dividends and Share Buybacks: GM may use some of the debt to support shareholder returns, including dividends and share buybacks. This helps maintain investor confidence and support the company’s stock price.
9. Risk Management: By diversifying its debt portfolio and maintaining a balanced capital structure, GM mitigates financial risks and ensures long-term sustainability.
In summary, General Motors strategically uses its debt to support various aspects of its business, from daily operations to long-term growth initiatives. This approach helps GM remain competitive and innovative in the automotive industry.
Total Debt
General Motors total debt
(click image to expand)
GM’s total debt has doubled since 2015, reaching a record figure of $122B as of the end of fiscal year 2023.
Compared to the figure measured a year ago, GM’s latest debt level was up 6%. Of this amount, $39 billion was current debt due within a year, while $$83 billion was long-term debt.
Debt Breakdown
General Motors debt breakdown
(click image to expand)
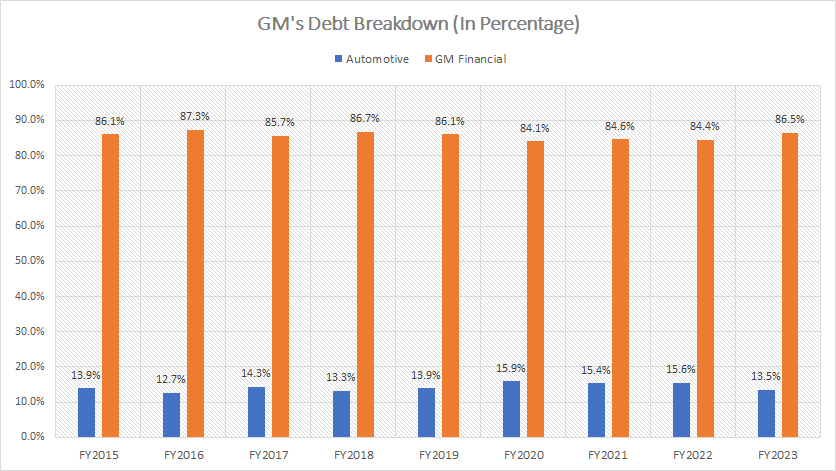
GM’s debt is split into two categories: Automotive and GM Financial.
The automotive segment designs, manufactures, and distributes new vehicles, parts, and accessories, while GM Financial provides loans and credit facilities to retail and commercial customers and dealerships.
The majority of GM’s debt came from GM Financial, which accounted for roughly 87% of the total as of the end of 2023. On the other hand, Automotive’s debt accounted for just 13.5% of General Motors’ total debt.
The debt levels of GM Financial and Automotive have consistently remained unchanged from the perspective of the percentage, as shown in the chart above.
GM Financial Debt
GM Financial debt
(click image to expand)
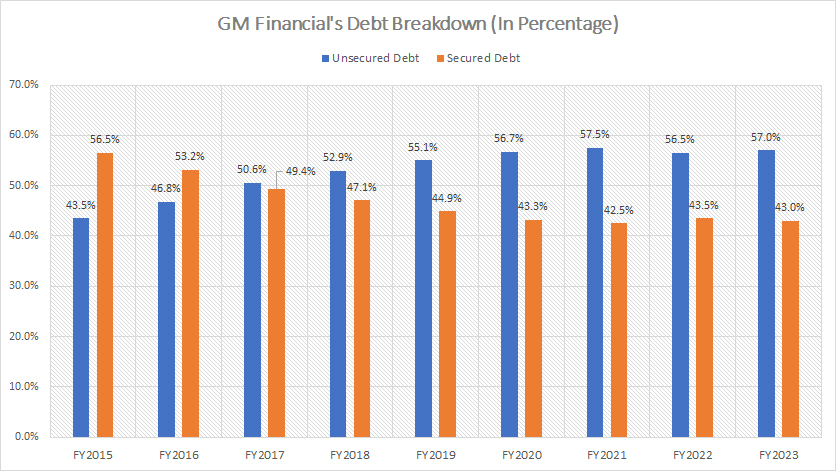
GM Financial’s debt is classified into two categories: secured and unsecured debt. The definitions of both types of debt are available here: secured debt and unsecured debt.
Secured debt is backed by assets and payable only from proceeds related to the underlying pledged assets, according to GM’s annual reports.
Here is a quote that illustrates GM Financial’s secured debt:
-
Secured debt consists of revolving credit facilities and securitization notes payable.
Most of the secured debt was issued by Variable Interest Entities (VIEs) and is repayable only from proceeds related to the underlying pledged assets.
In other words, GM Financial’s secured debt is backed by income-producing assets such as finance receivables and leasing-related assets. It is, therefore, paid back through cash generated from these underlying assets.
As a result, GM Financial’s secured debt is safe as the underlying assets can cover much of the liability of the secured debt. On the other hand, GM Financial’s unsecured debt consists of senior notes, credit facilities, and other unsecured debt. Unsecured debt is unsecured and, therefore, not backed by any assets.
Since any assets do not back these debts, they must be paid off using the cash generated by GM’s business operations. Investors should be concerned with unsecured debt because GM will be in trouble if it fails to service these debts.
As presented in the chart above, GM Financial’s unsecured debt was much higher than secured debt. Besides, the percentage of GM’s unsecured debt also has been on the rise, up significantly from 43.5% in 2015. As of the end of 2023, GM Financial’s unsecured debt contributed to 57% of the segment’s total debt.
Unsecured Debt
general-motors-unsecured-debt
(click image to expand)
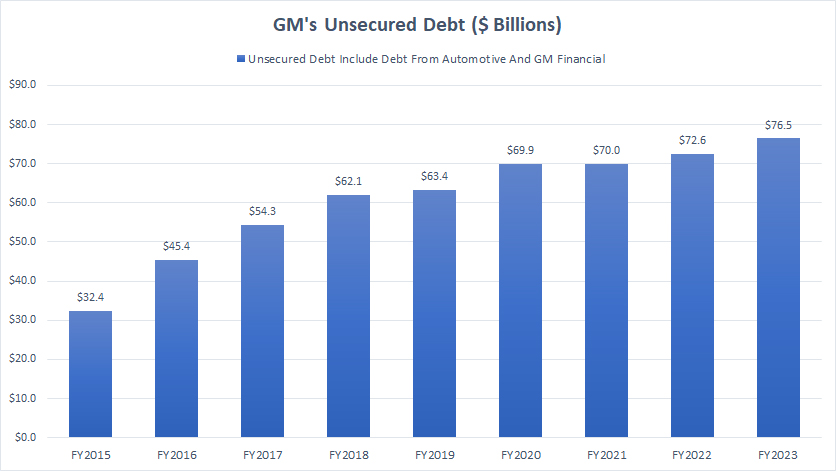
As discussed in previous section, unsecured debt is what investors should be concerned with. GM’s unsecured debt consists of those from Automotive and GM Financial. The definition of unsecured debt is available here: unsecured debt.
GM’s total unsecured debt has more than doubled since 2015, reaching a record high of $76.5 billion as of the end of fiscal year 2023.
Despite the record figure, GM’s unsecured debt was much smaller than the total debt. At $77 billion, GM’s unsecured debt comprised only about 63% of its total debt.
For example, GM’s debt-to-equity ratio was only 1.1X as of fiscal year 2023, which was relatively modest.
A detailed discussion of GM’s debt leverage can be found in this article – GM Debt To Equity Ratio.
Available Cash
general-motors-available-cash
(click image to expand)
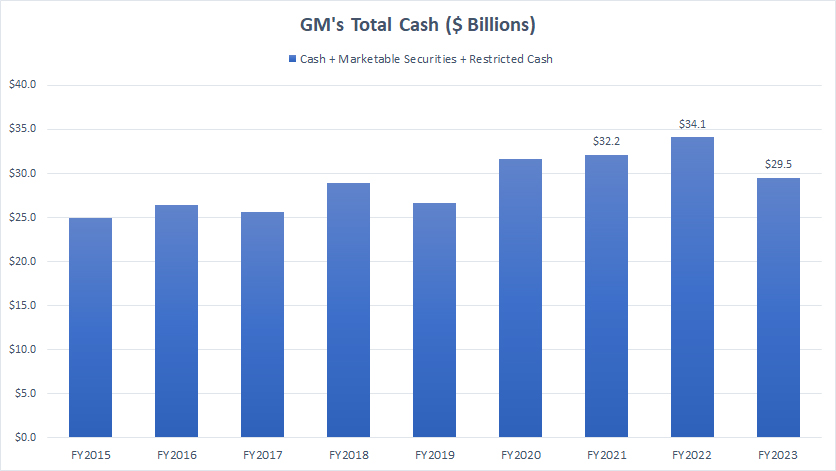
GM had nearly $30 billion of available cash as of the end of fiscal year 2023, down 10% from a year ago. GM’s available cash consists of cash and cash equivalents, marketable securities, and restricted cash.
A detailed discussion of GM’s cash flow can be found in this article – GM Cash Flow And Cash On Hand.
Unsecured Debt Less Cash
General Motors net debt
(click image to expand)
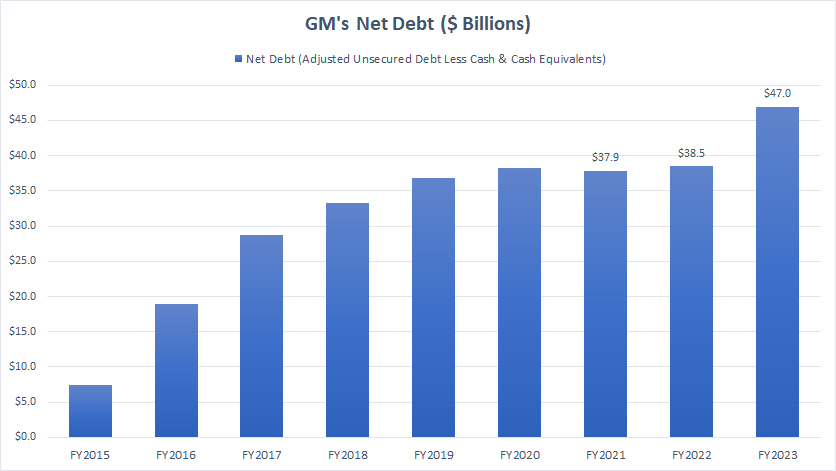
After adjusting for the available cash, GM’s net debt, defined as unsecured portions less cash, came in at only $47 billion as of the end of 2023, a record figure over the last ten years.
Despite having almost $30 billion in cash, GM still owed creditors up to $47 billion in the form of unsecured debt. The amount owed is much larger if we consider GM’s total debt without excluding secured debt. In this case, GM’s net debt would be as much as $90 billion.
A significant trend about GM’s net debt is that the figure has more than quadrupled since 2015, as shown in the chart above. That means General Motors has significantly racked up its unsecured debt over the years.
Debt Vs Revenue
GM debt vs revenue
(click image to expand)
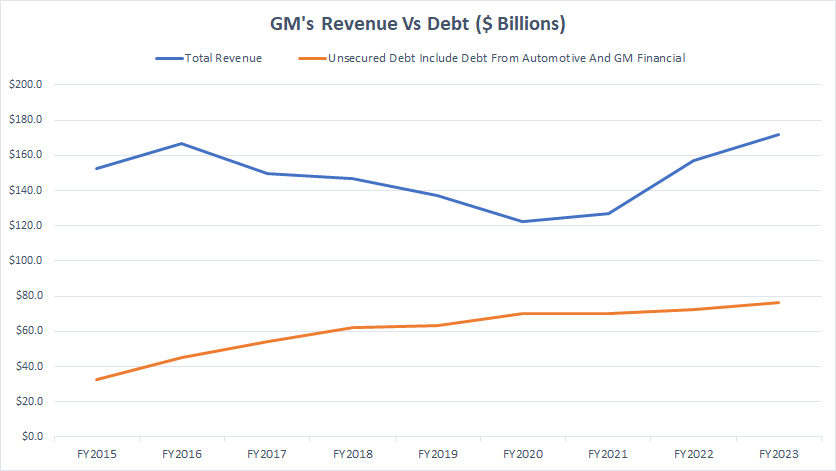
Although GM’s unsecured debt has significantly risen, its revenue also has increased in recent years, as presented in the chart above.
Since fiscal 2020, GM’s revenue has been moving higher, implying improving business prospects and sales in post-pandemic periods.
Similarly, GM’s total debt has been steadily rising, but recent revenue growth has made the debt growth tolerable.
Debt To Revenue Ratio
GM debt to revenue ratio
(click image to expand)
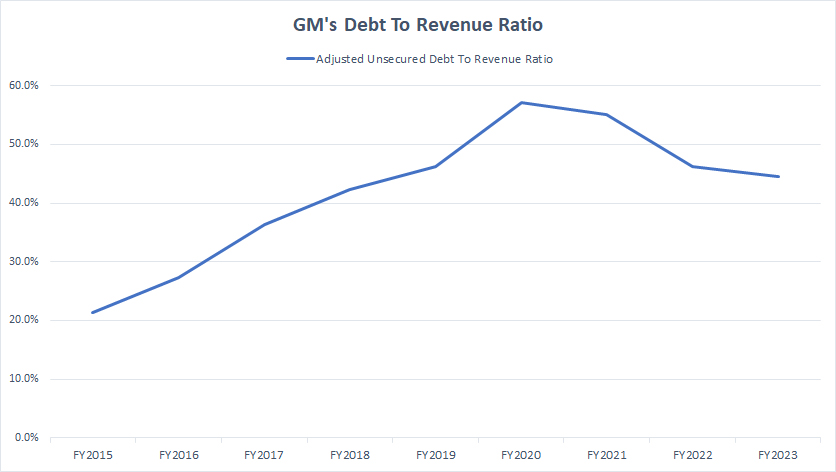
A declining debt-to-revenue ratio is favorable to investors.
The excellent news is that the debt-to-revenue ratio for GM’s unsecured debt has been decreasing in post-pandemic time, as shown in the chart above, primarily driven by the soaring revenue during the same period.
GM’s shareholders can find comfort in the decreasing ratio despite seeing an increasing debt level.
Debt Due
General Motors debt due data are obtained from the 2023 annual report dated 31 Dec 2023.
| Fiscal Year | Debt Due In Million Of USD | ||
|---|---|---|---|
| Automotive | GM Financial | Total | |
| 2024 | $428 | $38,637 | $39,065 |
| 2025 | $2,644 | $22,971 | 25,615 |
| 2026 | $93 | $15,049 | $15,142 |
| 2027 | $1,826 | $8,770 | $10,596 |
| 2028 | $831 | $7,164 | $7,995 |
| Thereafter | $11,082 | $13,999 | $25,081 |
The table above depicts GM’s debt due, including finance leases, between fiscal 2024 and 2028.
GM’s debt due is separated into two categories: Automotive and GM Financial. GM Financial’s portion appears to account for the majority of the debt due.
That said, GM’s debt due in 2024 totaled $39 billion, while that in fiscal 2025 totaled $26 billion. Between 2026 and 2028, the average amount of GM’s debt due measured at $11 billion annually.
Can General Motors afford the payments due? We will find out in the following discussion.
Sources Of Liquidity
GM’s liquidity data are obtained from the 2023 annual report dated 30 Dec 2023.
| Sources Of Liquidity | USD In Billions | |
|---|---|---|
| Committed Capacity | Available Capacity | |
| Automotive | ||
| Cash & Cash Equivalents | – | $12.2 |
| Marketable Securities | – | $7.6 |
| Credit Facilities | $16.4 | $15.7 |
| Operating Cash Flow | – | $16.5 (Estimated) |
| Total Automotive | – | $52.0 |
| GM Financial | ||
| Cash & Cash Equivalents | – | $5.3 |
| Total Borrowing Capacity | – | $24.6 |
| Operating Cash Flow | – | $6.5 (Estimated) |
| Total GM Financial | – | $36.4 |
| Total Liquidity | ||
| Total | – | $88.4 |
Automotive’s sources of liquidity include cash and cash equivalents, marketable securities, credit facilities, and cash provided by operating activities.
Similarly, GM Financial’s sources of liquidity include cash and cash equivalents, credit facilities, and cash provided by operating activities.
Cumulatively, GM has $88 billion in available liquidity as of the end of 2023, which is more than enough to cover all debt due through 2026.
A noteworthy point is that GM has enough liquidity to cover all debt due from 2024 to 2025, even without the cash flow from operations.
The following quote illustrates GM’s liquidity in the 2023 annuall report:
- “We believe our current levels of cash, cash equivalents, marketable debt securities, available borrowing capacity under our revolving credit facilities, and other liquidity actions currently available to us are sufficient to meet our liquidity requirements.”
In short, GM has sufficient liquidity to meet all debt obligations through at least fiscal 2026.
Credit Rating
GM’s credit rating as of 31 Dec 2023.
| Rating Agencies | Types Of Indebtedness | Outlook | ||
|---|---|---|---|---|
| Corporate | Revolving Credit Facilities | Senior Unsecured | ||
| DBRS | BBB (High) | BBB (High) | N.A. | Stable |
| Fitch | BBB | BBB- | BBB | Stable |
| Moody’s | Investment Grade | Baa2 | Baa2 | Stable |
| Standard & Poor’s | BBB | BBB | BBB | Stable |
According to the latest annual report, all four credit rating agencies rate GM’s corporate credit at investment grade.
In March 2023, Moody’s upgraded GM’s senior unsecured notes to Baa2 from Baa3.
In September 2023, Fitch upgraded GM’s Corporate and Senior Unsecured ratings to BBB from BBB- and changed the outlook to Stable from Positive.
DBRS credit rating definitions can be found here – DBRS.
Fitch credit rating definitions can be found here – Fitch.
Moody’s credit rating definitions can be found here – Moody’s.
Standard & Poor’s credit rating definitions can be found here – Understanding Credit Ratings.
Conclusion
Although GM’s total debt reached $122B as of 2023, the unsecured portion totaled only $77B, a far lower number than the total debt. Moreover, GM’s debt-to-equity ratio remains reasonable when only the unsecured debt was accounted for.
After adjusting for cash, GM’s net debt came in at only $47B, also a much smaller figure compared to the total debt. Therefore, GM’s debt leverage is considerably small when considering only the unsecured debt.
Apart from that, GM’s business prospect also has become much better during the post-pandemic periods, as seen in the rising revenue. In addition, GM’s latest liquidity is far higher than the debt amount due on an annual basis.
For example, GM’s total liquidity of $88 billion, measured as of the end of fiscal year 2023, was sufficient to cover the debt due through 2026.
As of October 16, 2023, GM’s corporate debt has obtained an investment-grade credit rating from four major credit agencies, and its senior unsecured debt has received the same from three major credit agencies.
Is General Motors $120 billion debt a cause for concern? In my opinion and based on the discussions, there should not be any concern nor any issue with GM’s $122 billion debt as of the end of 2023.
References and Credits
1. All financial figures presented in this article were obtained and referenced from General Motors’ earning releases, shareholders letters, investor presentations, quarterly and annual reports, etc., which are available in GM Earnings Releases.
2. Pexel Images.
Disclosure
References and examples such as tables, charts, and diagrams are constantly reviewed to avoid errors, but we cannot warrant the total correctness of all content.
The content in this article is for informational purposes only and is neither a recommendation nor a piece of financial advice to purchase a stock.
If you find the information in this article helpful, please consider sharing it on social media and also provide a link back to this article from any website so that more articles like this one can be created in the future.
Thank you!

