A GM Cadillac Eldorado Brougham 1957. Flickr Image.
It’s interesting to see how Tesla’s (NASDAQ: TSLA) automotive business performs when compared with its bigger rival, General Motors (NYSE: GM).
For your information, Tesla is relatively new to the automotive industry and is an all-electric vehicle player.
On the other hand, General Motors (GM) has already been in the trade for several decades and has only recently jumped on the electric vehicle bandwagon.
With both companies getting more ambitious in the electric vehicle space, it would be interesting to see how each measures up to one another in revenue, margins, profitability, and possibly other metrics.
While both companies operate in the same industry, they have different approaches regarding how their products are distributed.
In this aspect, Tesla adopts a retail-based business model, whereas GM’s business model is wholesale-based.
Theoretically, I would expect Tesla’s margin to be worse than that of GM, considering the extra expenses and costs required to operate its retail stores.
In this article, we compare Tesla and GM’s revenue and gross margins to see how the results stack up.
Let’s take a look!
Please use the table of contents to navigate this article.
Table Of Contents
Overview
Segment Adjustment
B1. GM Financial
B2. Tesla Energy and Leasing Revenue
B3. Tesla Regulatory Credits
B4. Tesla Services Revenue
B5. Research & Development
Automotive Revenue Comparison
C1. Automotive Revenue By Quarter
C2. Automotive Revenue By TTM
Gross Margin Comparison
D1. Automotive Gross Margin By Quarter
D2. Automotive Gross Margin By TTM
Summary And Reference
S1. Summary
S2. References and Credits
S3. Disclosure
Apple-To-Apple Comparison
This article compares only the automotive sector of Tesla and GM.
Although Tesla and GM are both automobile companies, they have non-automotive businesses that contribute significantly to sales and revenues.
For example, Tesla gets a significant portion of sales in the energy sector.
On the other hand, General Motors derives a significant portion of its revenue not just from the automotive segment but also from its financial segment.
Therefore, we must make some adjustments for a similar comparison when measuring the automotive revenue and gross margin.
These adjustments include the exclusion of non-automotive portions.
GM Financial
For General Motors, GM Financial is the company’s captive finance arm.
The subsidiary provides loans and credit facilities to retail and commercial customers.
As a result, GM Financial derives most of its revenue from finance income and has no activities related to automobile manufacturing.
For this reason, the portion of revenue from GM Financial is excluded during the measurement of GM’s automotive revenue and gross margin.
Tesla Energy and Leasing Revenue
Similarly, Tesla’s energy is a business subsidiary that is unrelated to automobile manufacturing.
Aside from the energy sector, Tesla’s automotive leasing revenue is another revenue segment that needs to be adjusted so that the automotive revenue is in line with that of General Motors.
For your information, GM’s automotive leasing revenue is recognized as a type of finance income that belongs to GM Financial.
Therefore, Tesla’s energy and leasing revenue is stripped off during the measurement of the automotive revenue and gross margin to perform an apple-to-apple comparison.
Tesla Regulatory Credits
The same goes for Tesla’s automotive regulatory credits revenue, which needs to be adjusted as well.
As of fiscal 2022, General Motors has not broken down any sales from regulatory credits.
In this aspect, I assume that GM did not produce sufficient zero-emission vehicles to offset the emissions from fossil-fuel vehicles.
Therefore, I have excluded Tesla’s regulatory credits revenue for a similar comparison while measuring the automotive revenue and gross margin.
Tesla Services Revenue
GM wraps its services revenue under the automotive sector.
Therefore, to be in line with General Motors, I am also including Tesla’s services revenue as part of its automotive revenue.
For this reason, I am adding Tesla’s services revenue during the revenue and gross margin measurement for an apple-to-apple comparison.
Research and Development Costs
Similarly, GM put research and development expenses under the automotive segment, which is part of the gross margin measurement.
However, for Tesla, its R&D costs fall under the operating expenses which are outside of the gross margin measurement.
For a similar comparison, I need to add Tesla’s R&D costs into the automotive revenue to derive a gross margin identical to that of GM.
The problem for Tesla is that not all research and development expenses were spent in the automotive sector.
Some of Tesla’s R&D expenses may have been spent on the energy sector.
As such, I am adding a certain portion of Tesla’s R&D costs as part of the gross margin measurement.
This ratio is around 80%, consistent with the automotive revenue to total revenue ratio.
Automotive Revenue By Quarter
Automotive revenue comparison: Tesla vs GM (Quarterly)
(click image to expand)
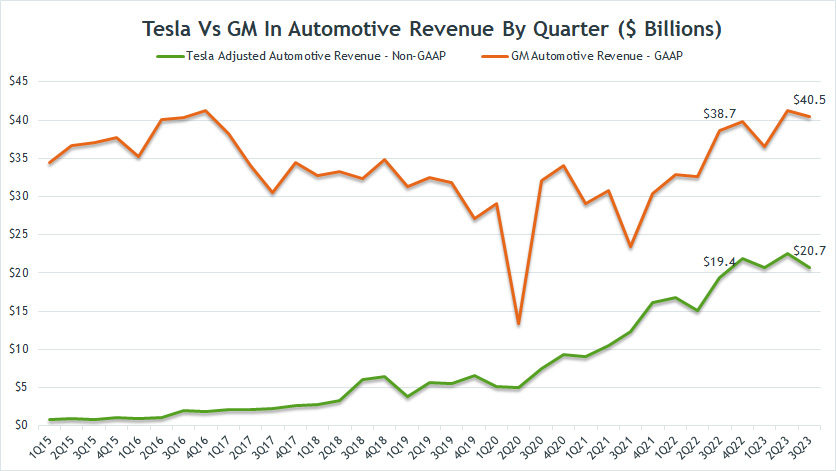
The above graph shows the comparison between Tesla’s adjusted automotive revenue and GM’s automotive revenue from fiscal 2015 to 2023 on a quarterly basis.
As mentioned, Tesla’s automotive revenue has been adjusted to include and exclude a couple of items to be in line with that of General Motors.
That said, the chart above clearly shows that GM’s automotive revenue is much higher than Tesla’s.
As of fiscal 3Q 2023, GM’s automotive revenue came in at US$40.5 billion compared to only US$20.7 billion in the same quarter for Tesla.
GM’s automotive revenue is about 2X higher than Tesla’s on a quarterly basis.
While the gap was big in 2023, it was much bigger five years ago, reportedly at a 35X difference.
In just five years, Tesla has nearly closed the gap with GM, illustrating the remarkable growth that Tesla has achieved in the automotive sector.
In contrast, GM’s automotive revenue has remained stagnant and has only been able to grow in recent quarters.
Automotive Revenue By TTM
Automotive revenue comparison: Tesla vs. GM (TTM)
(click image to expand)
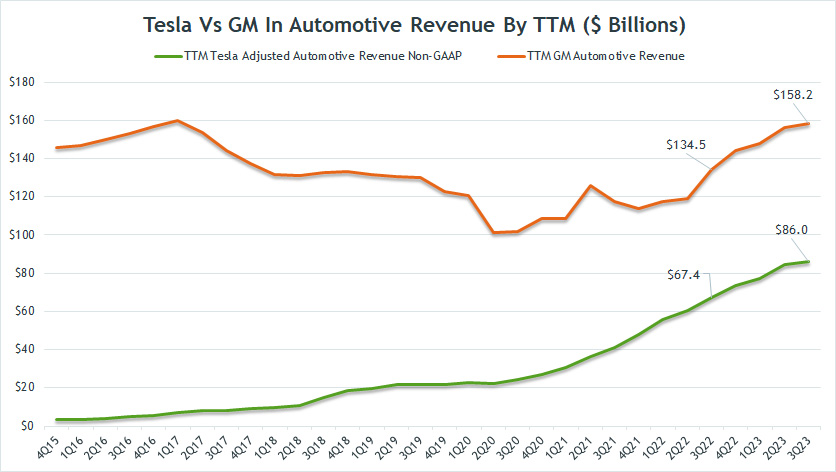
The prior quarterly chart may not clearly present the trend of both companies’ revenues. Therefore, I created the trailing 12-month (TTM) chart above to show the revenue trend.
From a TTM perspective, it is clear that Tesla’s automotive revenue has significantly grown, while that of GM has only been able to grow in post-pandemic periods.
Before the growth in 2023, GM’s automotive revenue experienced a significant slump during the COVID period.
Although GM managed to get its growth back, its revenue level in the latest quarter was more or less the same as that recorded six years ago.
Therefore, GM’s automotive revenue was flat compared to the results six years ago.
In addition, the gap between GM and Tesla has significantly narrowed in recent years, illustrating the remarkable progress that Tesla has made.
Automotive Gross Margin By Quarter
Automotive gross margin comparison: Tesla vs GM (Quarterly)
(click image to expand)
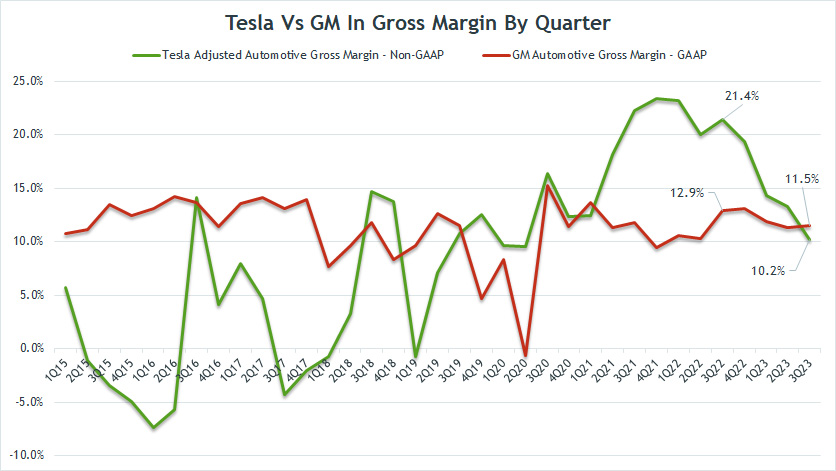
As discussed in prior paragraphs, Tesla’s automotive gross margin is adjusted to include and exclude several items to align with GM’s results for an apple-to-apple comparison.
While the plots are zig-zagging in the chart, we can see that Tesla’s automotive gross margin has closely trailed General Motors’ gross margin.
During the post-pandemic periods, Tesla’s automotive gross margin significantly exceeded GM’s.
However, Tesla’s automotive gross margin has slumped in recent quarters and is now roughly at the same level as GM’s.
As of fiscal Q3 2023, Tesla’s automotive gross margin declined to 10.2%, slightly lower than GM’s results of 11.5%.
Automotive Gross Margin By TTM
Automotive gross margin comparison: Tesla vs. GM (TTM)
(click image to expand)
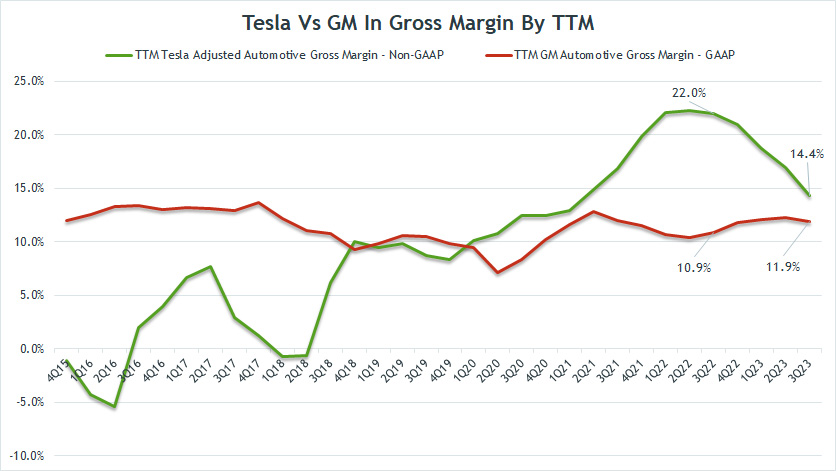
Again, the quarterly chart may not clearly depict the trend of the plots. As a result, the TTM chart above is created to showcase Tesla and GM’s gross margin comparison.
From a TTM perspective, Tesla’s automotive gross margin was slightly better than GM’s in the latest quarter, helped by prior results.
As of 3Q 2023, Tesla’s automotive gross margin reached 14.4% compared to GM’s result of 11.9%.
On a long-term basis, GM’s automotive gross margin has remained stagnant, while Tesla’s results have remarkably improved.
However, in post-pandemic periods, Tesla’s automotive gross margin has significantly slid, possibly driven by rising costs and lower vehicle prices.
Tesla’s dwindling gross margin illustrates the company’s challenges in maintaining its profitability.
Conclusion
On an adjusted basis, Tesla’s automotive gross margin was slightly better than GM’s despite having a far smaller revenue than GM’s.
However, Tesla still has much work to do, considering that its automotive gross margin has significantly slumped in the post-pandemic era.
Although Tesla operates a retail-based model instead of a wholesale-based model adopted by GM, Tesla can achieve a gross margin exceeding that of General Motors.
References and Credits
1. All financial figures presented were obtained and referenced from Tesla Investor Relations and GM Earning Releases.
2. Featured image was used under Creative Common Licenses and obtained from pcfishhk and Richard Wadd.
Disclosure
References and examples such as tables, charts, and diagrams are constantly reviewed to avoid errors, but we cannot warrant the total correctness of all content.
The content in this article is for informational purposes only and is neither a recommendation nor a piece of financial advice to purchase a stock.
If you find the information in this article helpful, please consider sharing it on social media and provide a link to this article from any website so that more articles like this can be created.
Thank you!

