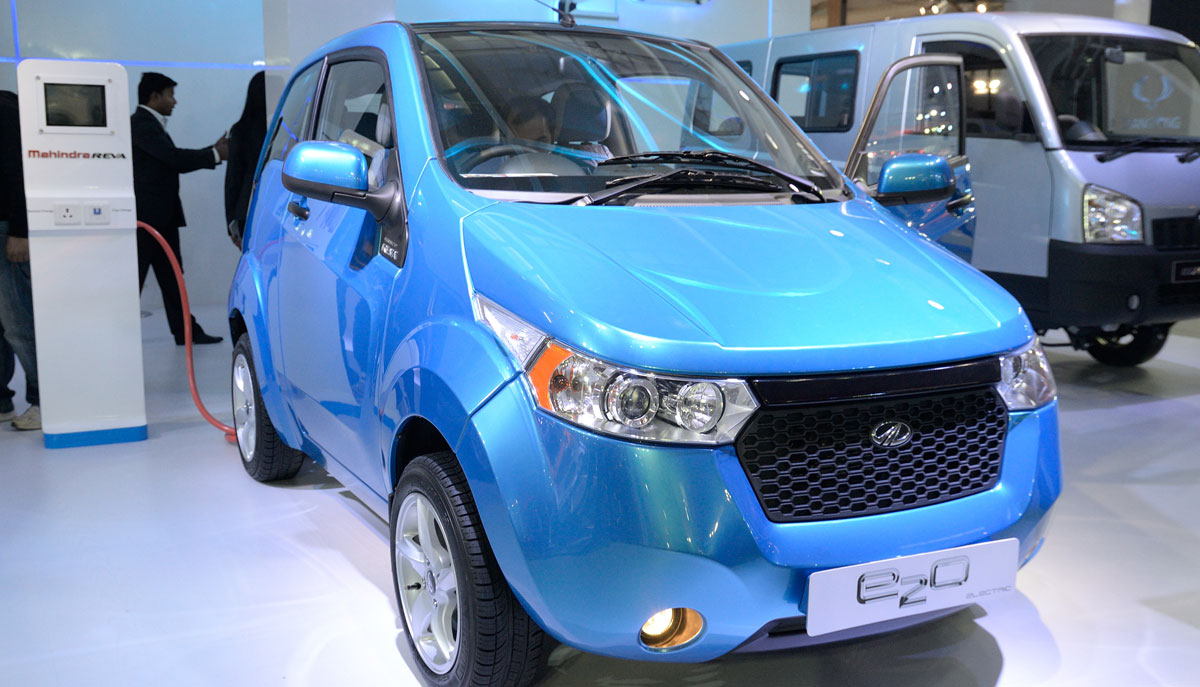
Mahindra all-electric e2o. Flickr Image.
This article presents the vehicle sale statistics of Mahindra & Mahindra Limited or M&M Limited.
The presented Mahindra’s vehicle sale numbers are obtained from the company’s automotive sectors.
For your information, Mahindra & Mahindra Limited is one of the largest automakers in India and is a wholly-owned subsidiary of Mahindra Group, a multinational conglomerate company based in Mumbai, India.
Moreover, Mahindra & Mahindra Limited is publicly traded on the Bombay Stock Exchange and the National Stock Exchange of India.
Mahindra produces not only automotive products such as passenger and commercial vehicles but also farm equipment, including tractors and farming machinery.
The company plays an important role in India’s economy by employing hundreds of thousands of people and its product brand names are well-recognized across the country.
Investors interested in Mahindra’s market share by vehicle segment and tractor sales numbers may find more information on these pages – M&M Market Share In India and Mahindra tractor sales.
Please use the table of contents to navigate this page.
Table Of Contents
Definitions And Overview
O2. Mahindra Automotive Sector Overview
Total Vehicle Sales
B1. Vehicle Sales By Fiscal Year
B2. YoY Growth Rates Of Vehicle Sales
Breakdown Of Total Vehicle Sales
C1. Domestic And Export Vehicle Sales
C2. Domestic And Export Vehicle Sales In Percentage
Breakdown Of Domestic Vehicle Sales
D1. Passenger And Commercial Vehicle Sales
D2. Passenger And Commercial Vehicle Sales In Percentage
Breakdown Of Commercial Vehicle Sales
E1. LCV, MHCV And 3-Wheeler Sales
E2. LCV, MHCV And 3-Wheeler Sales In Percentage
Breakdown Of Passenger Vehicle Sales
F1. Utility Vehicle, Car And Van Sales
F2. Utility Vehicle, Car And Van Sales In Percentage
Conclusion And Reference
S1. Conclusion
S2. References and Credits
S3. Disclosure
Definitions
To help readers understand the content better, the following terms and glossaries have been provided.
Light Commercial Vehicle: A light commercial vehicle (LCV) is a motor vehicle designed primarily for carrying goods or specialized equipment rather than passengers.
These vehicles typically have a gross vehicle weight (GVW) — which includes the vehicle’s weight plus the maximum load weight — of up to 3.5 metric tons.
Examples of light commercial vehicles include vans, pickup trucks, and small lorries or trucks. They are often used by businesses for local deliveries and by tradespeople to transport tools and equipment.
Medium And Heavy Commercial Vehicle: Medium Commercial Vehicles (MCVs) are a category of vehicles designed primarily for the transport of goods.
Their gross Vehicle Weight (GVW) typically ranges from over 3.5 metric tons to around 16 metric tons. These vehicles can include larger vans, small trucks, and minibuses. They are suited for moderate cargo loads and are often used for regional deliveries and transportation needs.
On the other hand, heavy Commercial Vehicles (HCVs) are designed to handle the heaviest loads in commercial transport, with a GVW of over 16 metric tons. This category includes large trucks, tractor-trailers, and buses.
HCVs are essential for long-haul transportation, extensive cargo deliveries, and heavy-duty tasks. They are built to carry significant weight, including bulky goods and machinery, and in the case of buses, a large number of passengers over long distances.
Three Wheeler: Three-wheelers refer to vehicles characterized by their three-wheel configuration, with either two wheels at the front and one at the rear (delta configuration) or one wheel at the front and two at the rear (tadpole configuration).
These vehicles can be powered by various means, including internal combustion engines or electric motors. Three-wheelers come in several forms, including motorcycles with a sidecar, motorized tricycles designed for cargo or passenger transport, and modern enclosed designs aimed at energy efficiency and reduced emissions for urban commuting.
They offer a unique blend of the agility of motorcycles with the added stability and load-carrying capability of an additional wheel, making them a versatile choice for personal and commercial use.
Mahindra Automotive Sector Overview
Mahindra’s vehicle sales breakdown
(click image to expand)
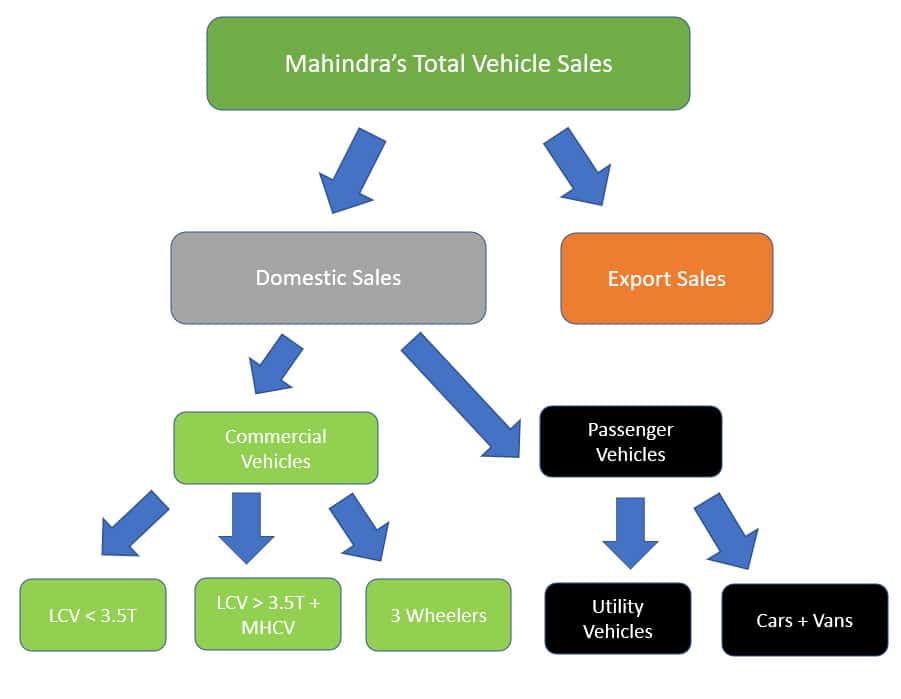
Mahindra’s vehicle sales are divided into 2 major categories and they are domestic and export sales as shown in the diagram above.
Domestic vehicle sales are further broken down into commercial and passenger vehicles.
Under the commercial vehicle segment, Mahindra’s vehicle sales consist of light commercial vehicles (LCV), medium and heavy commercial vehicles (MHCV), and 3-wheelers.
3 wheelers include the all-electric version and are a type of small vehicle that is similar to a motorbike but has 3 wheels instead of 2.
The definition of Mahindra’s LCV, MHCV, and 3-wheelers is available here: LCV, MHCV, and 3-wheeler.
On the other hand, Mahindra’s passenger vehicle segment is made up mainly of utility vehicles, cars, and vans.
Total Vehicle Sales By Fiscal Year
mahindra-vehicle-sales-by-year
(click image to expand)
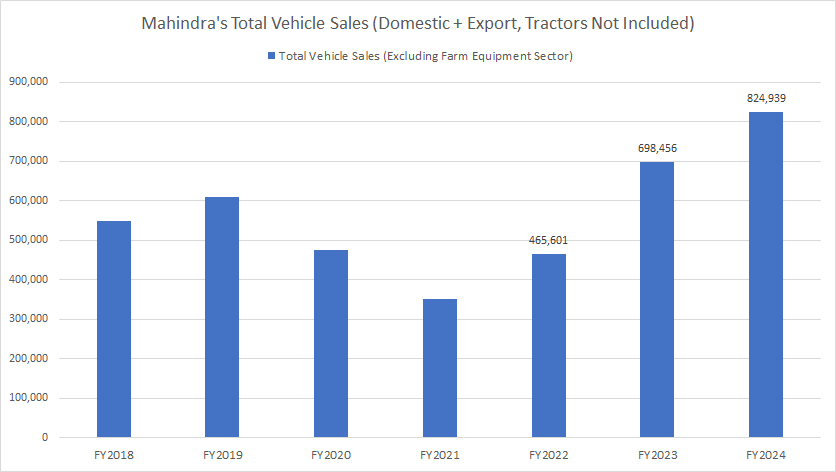
Mahindra’s total vehicle sales are made up of domestic and export sales but exclude tractor sales.
On a total and annual basis, the firm delivered a record figure of 825,000 vehicles in fiscal 2024, up 18% over fiscal 2023 and a massive 77% over fiscal 2022.
The latest results show that the figure has even surpassed the pre-pandemic levels, illustrating the massive post-pandemic vehicle sales recovery that the company has been experiencing.
YoY Growth Rates Of Vehicle Sales
mahindra-growth-rates-of-vehicle-sales
(click image to expand)
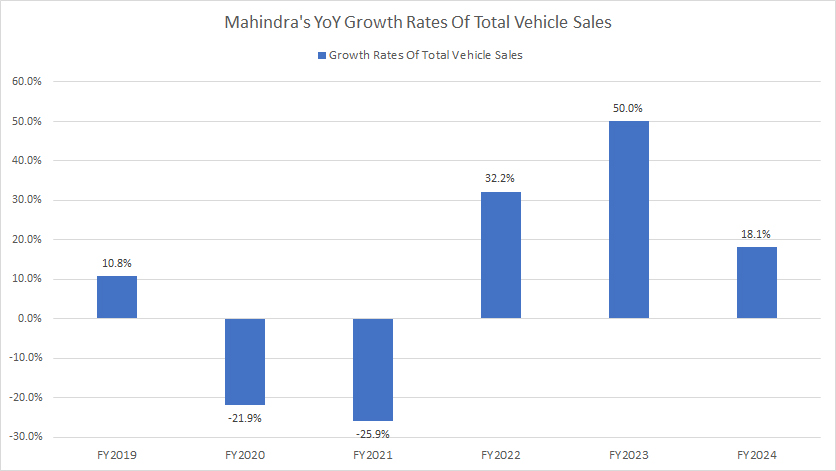
The growth rate plot above shows that the growth of Mahindra’s total vehicle sales has been on the rise in post-pandemic periods.
As seen, since fiscal 2022, growth rate has averaged 33%. In fiscal year 2024, the growth rate totaled 18%.
The growth of Mahindra’s vehicle sales came mostly from the domestic market of India as you will see in the next section.
Domestic And Export Vehicle Sales
mahindra-domestic-and-export-vehicle-sales
(click image to expand)
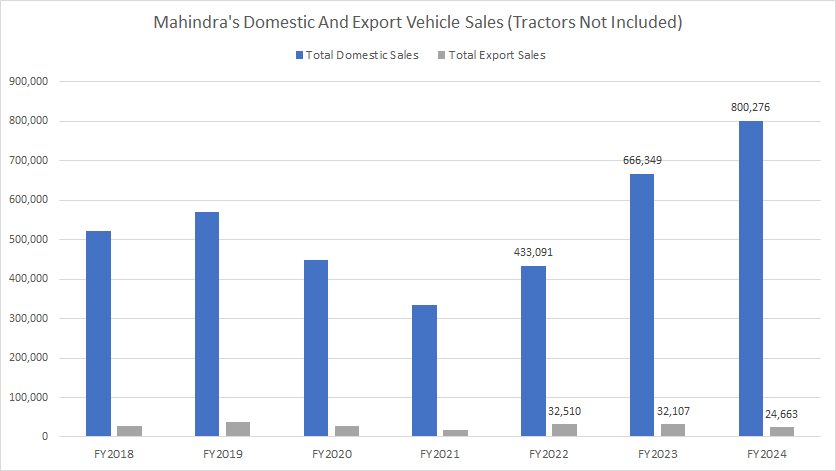
Mahindra’s domestic vehicle sales are significantly higher than export sales.
As of fiscal 2024, Mahindra’s domestic vehicle sales slightly exceeded 800,000 units compared to just 25,000 vehicles being exported in the same period.
Over the years, Mahindra’s export vehicle sales don’t seem to change that much but domestic vehicle sales have been having a post-pandemic boost and the latest result is even beating all pre-pandemic levels.
With the rise of the domestic market, Mahindra has now relied less on the export market for growth.
Domestic And Export Vehicle Sales In Percentage
mahindra-domestic-and-export-vehicle-sales-in-percentage
(click image to expand)
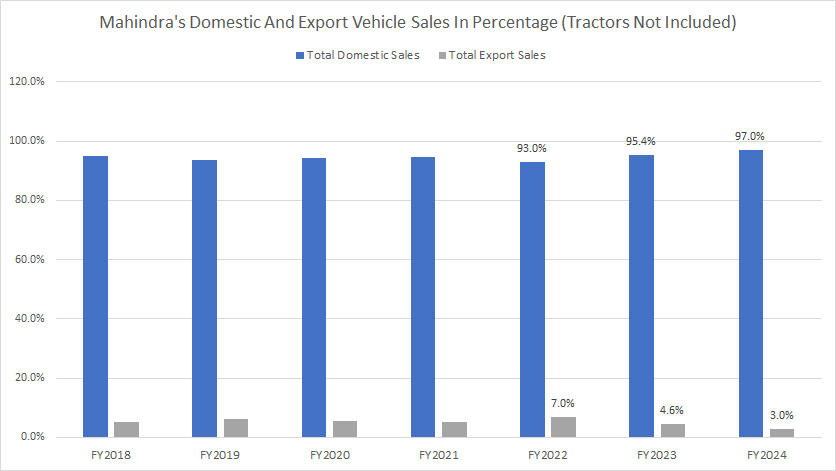
From the perspective of percentages, Mahindra’s domestic vehicle sales account for the majority of the company’s total vehicle volume while export sales take up fewer than 5%.
The latest ratio shows that domestic vehicle sales formed as much as 97% of the company’s total vehicle volume compared to only 3% for export vehicle sales.
An interesting trend is that the ratio for domestic vehicle sales has steadily been on the rise while that of export vehicle sales has slowly been on the fall, indicating the growing dominance of the domestic market of India to the company.
Therefore, Mahindra should focus more on the domestic market since the bulk of its sales comes from within India.
Commercial And Passenger Vehicle Sales
mahindra-commercial-and-passenger-vehicle-sales
(click image to expand)
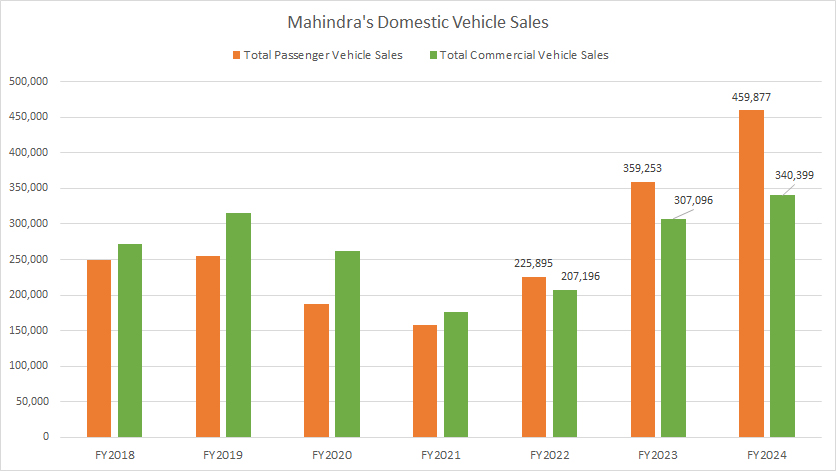
Mahindra’s commercial vehicle sales were much higher than the passenger volume prior to FY22.
However, starting in fiscal 2022, the passenger vehicle volume has exceeded that of the commercial segment.
As of FY24, M&M’s commercial vehicle sales came in at 460,000 units compared to 340,400 units for passenger vehicles.
Since fiscal 2021, the volume of both vehicle segment has significantly risen in post-pandemic periods.
However, passenger vehicle sales have grown at a much faster pace than commercial vehicle sales, and thereby overtaken that of the commercial segment since fiscal 2022.
Commercial And Passenger Vehicle Sales In Percentage
mahindra-commercial-and-passenger-vehicle-sales-in-percentage
(click image to expand)
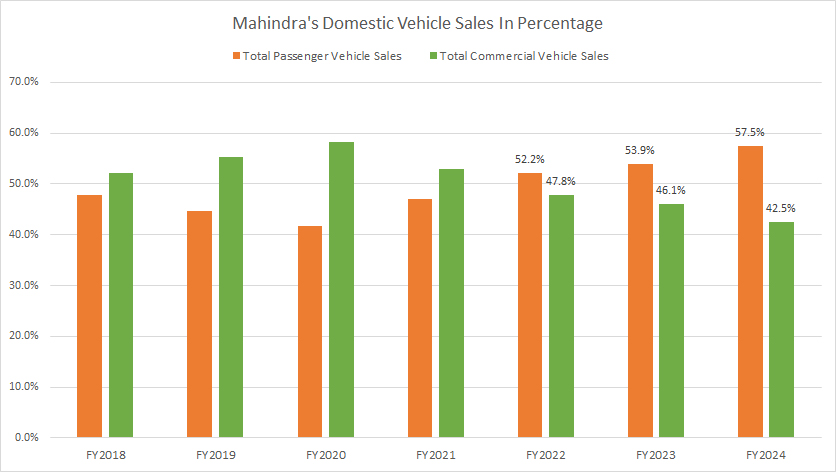
Mahindra’s commercial vehicle segment has dipped below 50% of the total domestic volume since fiscal 2022 and reached only 42.5% as of fiscal 2024, the lowest level ever recorded.
On the other hand, Mahindra’s passenger vehicle volume made up over half of the total domestic sales. The percentage reached as much as 57.5% as of fiscal 2024.
LCV, MHCV And 3-Wheeler Sales
mahindra-LCV-MHCV-and-3-wheeler-sales
(click image to expand)
Mahindra’s commercial vehicles include light commercial vehicles such as pick-up trucks. The definition of Mahindra’s LCV, MHCV, and 3-wheelers is available here: LCV, MHCV, and 3-wheeler.
Popular brand names in this segment include Jeeto, Jayo, Bolero Maxitruck, Bolero Pickup, etc. Moreover, Mahindra has recently produced an all-electric version of its cargo van which is called e-Supro. Mahindra’s 3-wheelers include the Alfa line and also the electric version such as the Treo and e-Alfa.
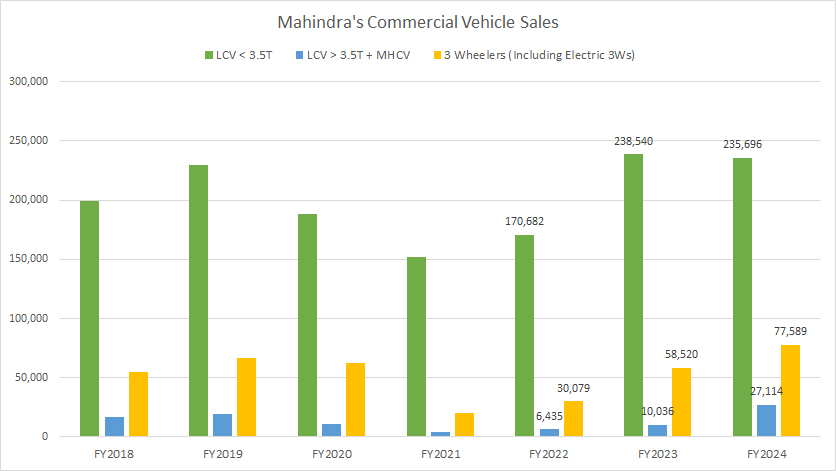
According to the chart above, Mahindra shipped the majority of its commercial vehicles under the LCV segment smaller than 3.5 tonnes.
As of FY24, this segment contributed about 235,700 vehicles while the LCV larger than 3.5T together with MHCV contributed only 27,000 vehicles during the same period, a far lower number compared to LCV smaller than 3.5 tonnes segment.
On the other hand, Mahindra’s 3-wheeler (inclusive of the electric version) sales clocked 77,600 units as of FY24, about 33% higher than in FY23.
Similarly, M&M’s sales of LCV smaller than 3.5 tonnes was flat in FY24 compared to FY23, while the sales of LCV greater than 3.5 tonnes together with MHCV nearly trippled during the same period.
Overall, Mahindra’s commercial vehicle sales have been on recovery in all vehicle segments, including the popular 3-wheelers, since FY21 in a post-pandemic world.
LCV, MHCV And 3-Wheeler Sales In Percentage
mahindra-LCV-MHCV-and-3-wheeler-sales-in-percentage
(click image to expand)
The definition of Mahindra’s LCV, MHCV, and 3-wheelers is available here: LCV, MHCV, and 3-wheeler.
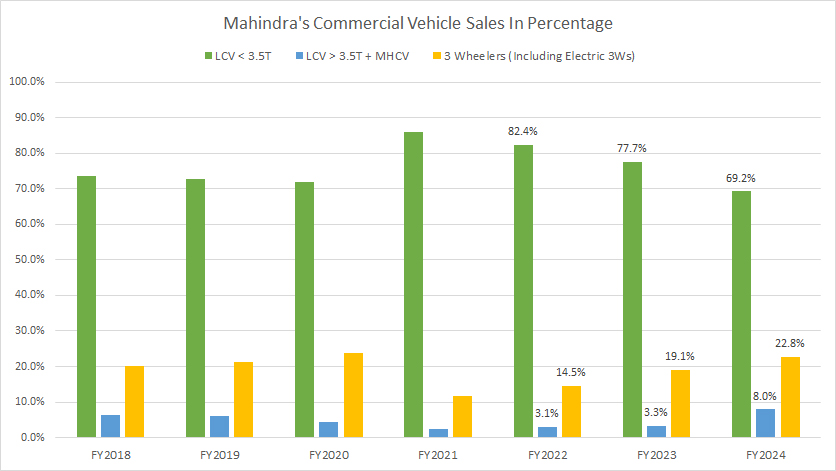
In terms of the percentage, Mahindra’s sales of LCVs smaller than 3.5T account for over 70% of the commercial vehicle volume on a consistent basis.
As of fiscal 2024, this ratio declined to 69% of the total commercial vehicle volume compared to 78% measured a year ago.
On the other hand, Mahindra’s sales of LCVs greater than 3.5T together with MHCVs account for less than 10% of the commercial vehicle volume, and this ratio declined to only 3.3% in fiscal 2023. However, the ratio jumped to 8% in FY24, indicating the significant increase in sales contribution of the LCV>3.5T and MHCV segment to the company.
Mahindra’s sales of the 3-wheelers, inclusive of the electric version, account for at 20% of the commercial vehicle volume. Since fiscal 2021, this ratio has been on the rise and reached a massive 23% as of fiscal 2024.
Utility Vehicle, Car And Van Sales
mahindra-utility-vehicle-car-and-van-sales
(click image to expand)
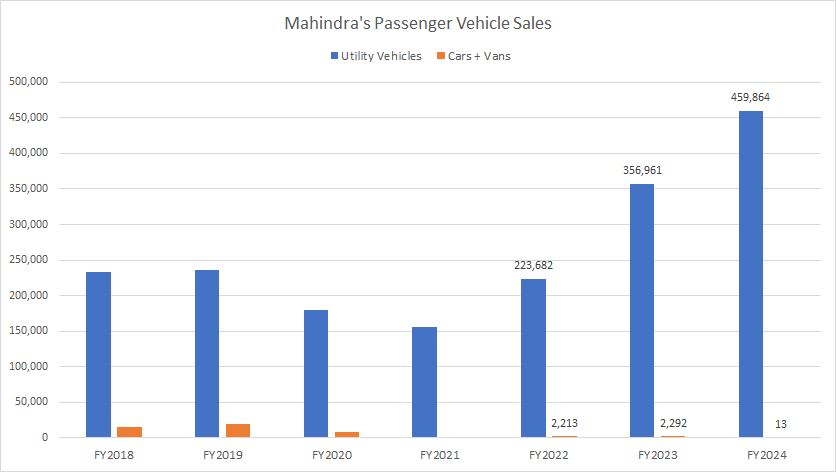
Over at the passenger vehicle segment, Mahindra’s passenger vehicle sales are primarily made up of utility vehicles.
Some popular utility vehicle models are Thar, XUV700, XUV300, Scorpio, Bolero, KUV100, and Marazzo.
On the other hand, Mahindra’s sales of cars and vans are insignificant, and the latest sales figure comes in at only 13 units for fiscal year 2024.
In contrast, Mahindra’s sales of utility vehicle sales jumped to 460,000 units as of fiscal 2024, up 29% over fiscal 2023 and is much higher than the sales figure for cars and vans.
Utility Vehicle, Car And Van Sales In Percentage
mahindra-utility-vehicle-car-and-van-sales-in-percentage
(click image to expand)
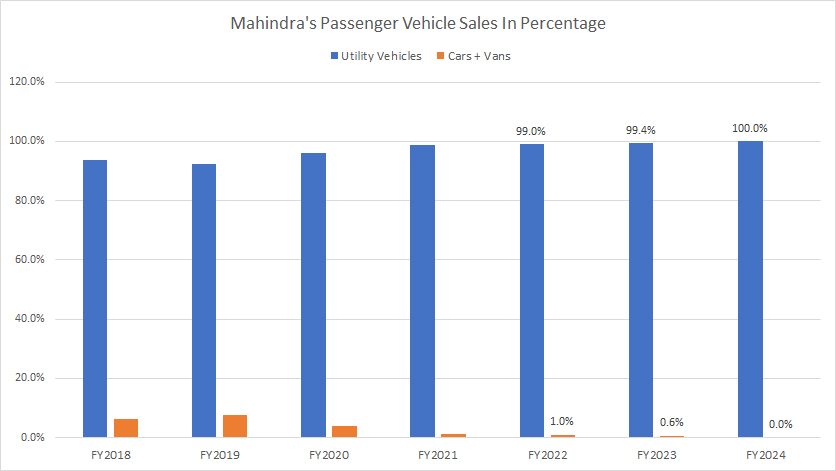
Mahindra’s sales of utility vehicles make up more than 90% of the total passenger vehicle volume consistently.
This figure reached 100% as of fiscal 2024, a rise of 6 percentage points in the past 6 years.
On the other hand, Mahindra’s sales of cars and vans make up less than 10% of the total passenger vehicle volume.
This figure has been on the decline and tumbled to only 0.0% as of fiscal 2024, illustrating the diminishing importance of cars and vans to the company. On the other hand, the growing sales of utility vehicles has become the top priority of the company, especially during the post-pandemic periods.
Conclusion
Mahindra’s vehicle sales in fiscal 2024 hit record figures. The passenger vehicle segment has become the largest segment with the most vehicle sales for the company.
In addition, Mahindra’s passenger vehicle segment also has grown the most over the last several years. Mahindra has sold the majority of utility vehicles within the passenger vehicle segment.
Credits And References
1. All financial data presented in this article was obtained and referenced from Mahindra’s earnings releases, annual reports, investors letters, presentations, news releases, etc., which are available in M&M’s Investor Relation.
2. Featured images in this article are used under Creative Commons licenses and sourced from the following websites: Mahindra Superbike and Mahindra all-electric e2o.
Disclosure
References and examples such as tables, charts, and diagrams are constantly reviewed to avoid errors, but we cannot warrant the full correctness of all content.
The content in this article is for informational purposes only and is neither a recommendation nor a piece of financial advice to purchase a stock.
If you find the information in this article helpful, please consider sharing it on social media and also provide a link back to this article from any website so that more articles like this one can be created in the future.
Thank you!


