The Nikola Motor’s Reckless Military. Flickr Image.
Other than Tesla (NASDAQ:TSLA), another company that has just got on the electric vehicle bandwagon and is worth taking a look at is Nikola Corporation (NASDAQ:NKLA).
Unlike Tesla, Nikola is an EV player focusing on large trucks specifically designed for hauling.
Aside from being an all-battery electric, Nikola’s trucks also use hydrogen to power the vehicles in addition to an onboard battery.
Is NKLA worth investing in? Probably.
The concern about Nikola is that the company still does not have any sales as of 3Q 2021 and it may carry a large debt level to fund its expansion.
That said, in this article, we will dive into several of Nikola Corporation’s debt metrics, including the total debt, net debt, debt leverage and the respective cash position.
Also, we will explore Nikola’s debt leverage by looking at the company’s total liabilities and total debt with respect to equity and assets.
Apart from the debt, we will also track the company’s liquidity position.
So, let’s get started!
Nikola’s Debt And Cash Topics
1. Total Debt Vs Cash On Hand
2. Total Liabilities Vs Cash On Hand
3. Total Liabilities Vs Total Liquidity
4. Total Debt To Equity Ratio
5. Total Debt To Asset Ratio
6. Total Liabilities To Equity Ratio
7. Total Liabilities To Asset Ratio
8. Summary
Nikola’s Total Debt Vs Cash On Hand
Nikola’s debt outstanding and cash on hand
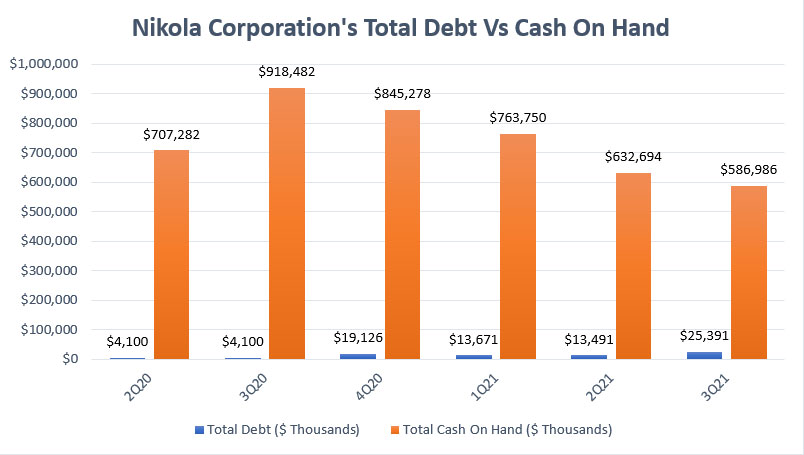
The chart above shows the comparison of Nikola’s total debt outstanding and total cash on hand over the last several quarters.
Since fiscal 2020, Nikola’s total debt has only slightly increased while its cash position has slightly gone lower.
Despite the slipping cash on hand, the amount was still significantly higher than the debt.
As of fiscal 3Q 2021, Nikola’s total debt came in at only $25 million while cash on hand was nearly $600 million.
For your information, Nikola actually did not have any debt as of 3Q 2021.
The $25 million total debt was primarily due to finance leases.
In view of the massive amount of cash position with respect to debt, Nikola Corporation should not have any near-term liquidity problem.
Nikola’s Total Liabilities Vs Cash On Hand
Nikola’s total liabilities and cash on hand
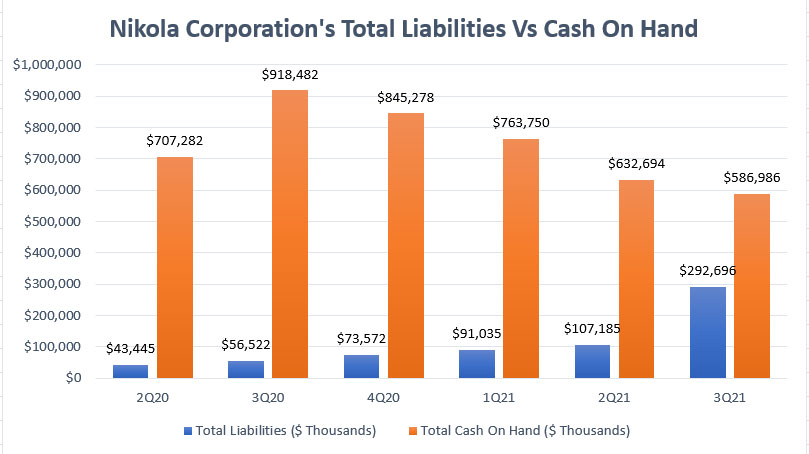
While Nikola carries little to no debt, it still has a significant amount of liabilities in its balance sheets.
As shown in the chart above, Nikola’s total liabilities have been rising and reached as much as $293 million as of fiscal 3Q 2021.
Of the $293 million total liabilities, a significant portion of that came from current liabilities.
In fact, Nikola’s current liabilities totaled as much as $253 million as of fiscal 3Q 2021, making up roughly 83% of total liabilities.
Despite the significant increase of total liabilities in the latest quarter, Nikola’s $600 million cash reserves reported in the same quarter were more than sufficient to cover the entire liabilities, including short-term liabilities that will be due within the next 12 months.
Again, Nikola should not have any near-term liquidity issue given the massive amount of cash on hand.
Nikola’s Total Liquidity Vs Total Liabilities
Nikola’s total liquidity vs total liabilities
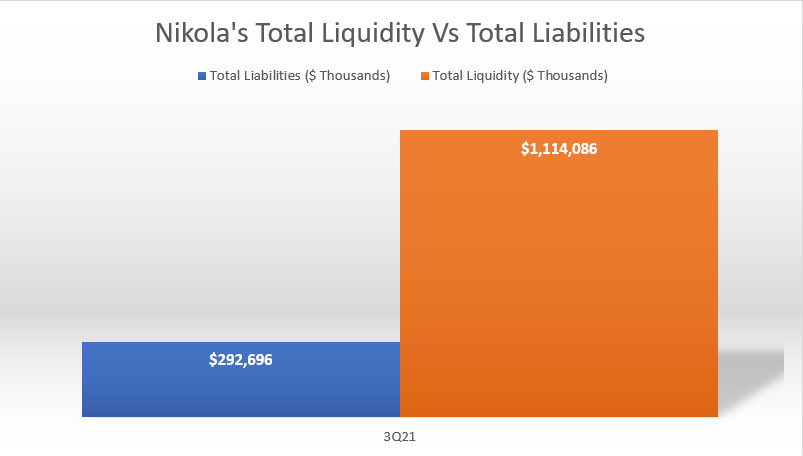
While Nikola’s total cash on hand reached nearly $600 million as of fiscal 3Q 2021, the company has an even greater amount of total liquidity.
As of fiscal Q3 2021, Nikola Corporation’s total liquidity came in at a massive $1.1 billion USD as shown in the chart above.
Keep in mind that Nikola’s extra liquidity was due largely to the $527 million equity line made available through a second $300 million common stock purchase program agreement with Tumim Stone Capital LLC (Tumim).
Under the stock purchase agreement, Nikola Corporation has the right but not the obligation to issue and sell up to a total of $600 million of the company’s common stocks to Tumim.
As of fiscal 3Q 2021, Nikola has most likely issued and sold more than $70 million of common stocks to Tumim, leaving the company with approximately $527 million of the available equity line.
Therefore, Nikola’s total liquidity has come to about $1.1 billion ($587.0 million of cash on the balance sheet and $527 million available on the equity line) as of fiscal Q3 2021.
This level of liquidity will provide ample cash for Nikola to fund its expansion through the end of 2022, according to the same press release.
As shown over the chart, Nikola’s $1.1 billion of total liquidity can cover the company’s total liabilities at nearly 4X the ratio.
In short, Nikola should not have any liquidity issues in the near term.
Nikola’s Total Debt To Equity Ratio
Nikola’s total debt to equity ratio
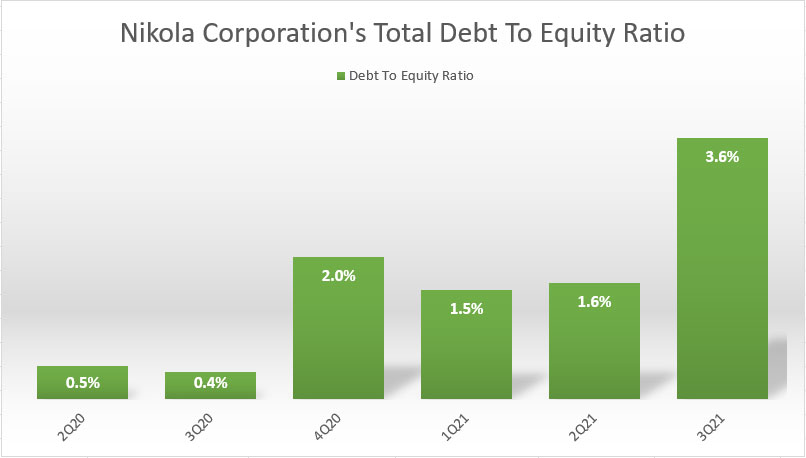
Since Nikola has only a small amount of debt, the respective debt to equity ratio came to only 3.6% as of fiscal 2021 Q3.
Despite Nikola’s rising debt to equity ratio in the last several quarters, the ratio was considered small at less than 5%.
With a debt to equity ratio of less than 5%, Nikola’s debt leverage was literally non-existence.
Nikola’s Total Debt To Asset Ratio
Nikola’s total debt to assets ratio
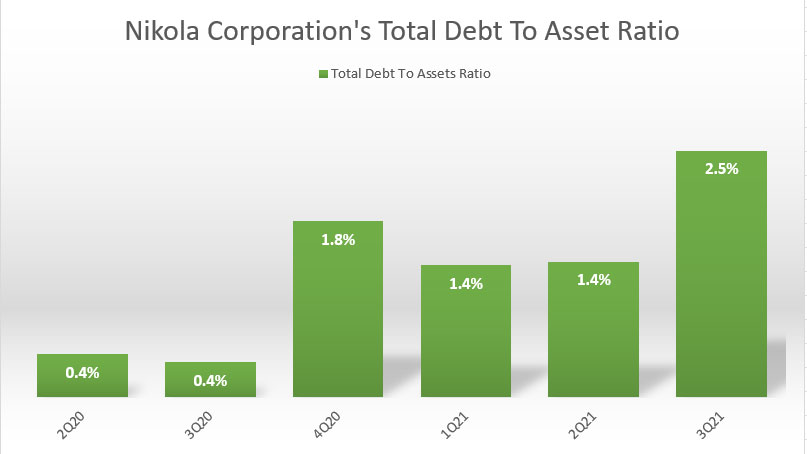
Similarly, Nikola’s debt to assets ratio was also considered minimal at less than 5% as of fiscal 3Q 2021.
While Nikola’s debt to assets ratio has been rising, the impact of the rising debt has been small with respect to total assets.
Therefore, with a debt to assets ratio of only 2.5%, we can conclude that the majority of Nikola’s assets were made up of equity such as cash and cash equivalents as well as physical assets, including properties, plant and equipment.
For your information, in fiscal Q3 2021, Nikola’s cash and cash equivalents as well as fixed assets alone made up nearly 80% of the company’s total assets.
Nikola’s Total Liabilities To Equity Ratio
Nikola’s total liabilities to equity ratio
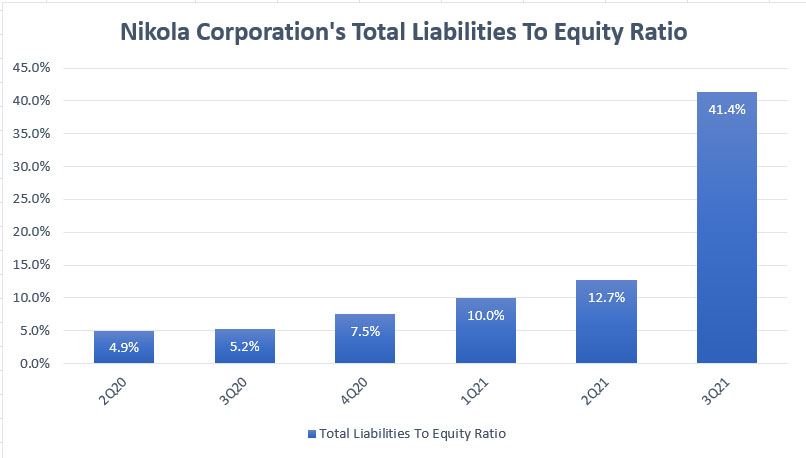
The total liabilities to equity ratio which is shown in the chart above illustrates the company’s total leverages with respect to stockholders’ equity or book value.
The total liabilities include not only total debt but also all current and long-term liabilities such as accounts payable, accrued expenses as well as deferred tax liabilities.
According to the chart above, Nikola Corporation has a total liabilities to equity ratio of more than 40% as of fiscal Q3 2021, indicating that the company was moderately leveraged.
More importantly, Nikola’s total liabilities to equity ratio has been rising and reached a record high in the latest quarter.
Despite the rising total liabilities to equity ratio, Nikola’s total leverage was still considered at a moderate level at slightly more than 40%.
With this ratio, Nikola Corporation has only $0.40 dollar of liabilities for every $1 dollar of equity, illustrating the low leverage of the company despite the increasing liabilities over the years.
Nikola’s Total Liabilities To Asset Ratio
Nikola’s total liabilities to assets ratio
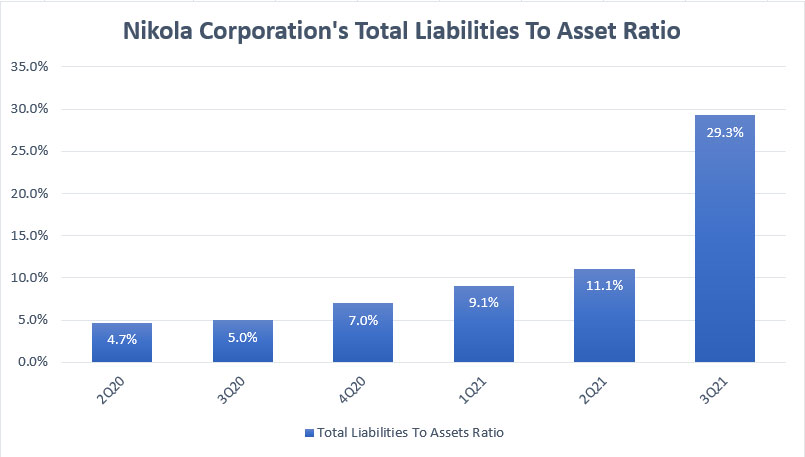
The total liabilities to asset ratio illustrate the company’s capital structure.
The ratio tells us about the proportion of the company’s assets that are funded by liabilities and equity.
For example, the graph above shows that Nikola’s capital structure was only 29% liabilities as of fiscal 3Q 2021, with the rest of it coming from stockholders’ equity.
In other words, Nikola’s capital structure was 70% equity which consisted primarily of liquid assets such as cash and cash equivalents.
As seen in the prior discussion, Nikola’s total cash on hand was nearly $600 million as of fiscal Q3 2021.
With this ratio, Nikola’s total assets or total funds were $0.30 dollars of liabilities for every $1 dollar of assets and the rest was equity.
Despite the rising debt structure over the years, Nikola’s total funds were still mostly made up of net assets in the latest quarter.
In short, Nikola’s total assets were 29% liabilities and 71% equity as of fiscal 2021 3Q, with the majority of the equity consisting of cash and cash equivalents.
Conclusion
In summary, Nikola Corporation carried very little debt as of fiscal Q3 2021, notably at only $25 million.
Moreover, the entire debt of $25 million was actually comprised of finance leases.
At this level of debt, Nikola’s leverage was very low.
Its debt to equity ratio was only 3.6% as of fiscal 3Q 2021.
More importantly, Nikola’s cash on hand totaled as much as $587 million as of fiscal Q3 2021, thereby giving a net debt of -$562 million.
Not only that but Nikola’s total liquidity reached as much as $1.1 billion as of fiscal Q3 2021, providing ample liquidity to the company to finance its growth until the end of 2022.
With the massive liquidity at hand, Nikola’s stock looks like an opportunity now.
At a market valuation of only $4.5 billion as of Dec 2021, Nikola’s stock may look like a good buy since it was debt-free and has a rock-solid balance sheet.
References and Credits
1. All financial figures in this article were obtained and referenced from Nikola Corporation’s financial statements available at Nikola Motor’s SEC Filings.
2. Featured images in this article are used under creative commons license and sourced from the following websites: Nikola Two Semi Truck and Nikola Motors Reckless Military.
Other Statistics That You May Find Helpful
Disclosure
The content in this article is for informational purposes only and is neither a recommendation nor a piece of financial advice to purchase a stock.
If you find the information in this article helpful, please consider sharing it on social media and also provide a link back to this article from any website so that more articles like this one can be created in the future. Thank you!

