Debt calculation. Pixabay Image.
This article presents several debt metrics of Nio Inc. (NYSE: NIO). These metrics include Nio’s total debt, net debt, cash, debt ratio, and liquidity.
Investors looking for other statistics of Nio Inc. may find more resources on these pages:
- Nio revenue breakdown and profit margin,
- Nio R&D cost vs Tesla and other Chinese EV, and
- Nio vehicle margin vs Tesla and other Chinese EV.
Please use the table of contents to navigate this page.
Table Of Contents
Definitions And Overview
O2. How Does Nio Inc Manage Its Debt?
Debt And Cash
A1. Total Debt
A2. Total Cash
Net Debt
A3. Total Debt Less Total Cash
Leverage Ratios
B1. Debt To Equity Ratio
B2. Debt To Asset Ratio
B3. Debt To Sales Ratio (Debt Margin)
Interest Coverage Ratio
C1. Operating Income Vs Interest Expense
Debt Schedules, Liquidity, And Credit Rating
D1. Payment Due
D2. Sources Of Liquidity
D3. Credit Rating
Summary And Reference
S1. Conclusion
S2. References and Credits
S3. Disclosure
Definitions
To help readers understand the content better, the following terms and glossaries have been provided.
Debt To Revenue Ratio: The debt-to-revenue ratio is a financial metric comparing a company’s total debt to its total revenue.
This ratio provides insight into the company’s ability to repay its debt using its revenue. Essentially, it indicates how many dollars of debt a company has for every dollar of revenue it generates.
The formula for calculating the debt-to-revenue ratio is:
\[\text{Debt-to-Revenue Ratio} = \left( \frac{\text{Total Debt}}{\text{Total Revenue}} \right) \times 100\%\]
A lower ratio suggests that the company has a manageable level of debt relative to its revenue, while a higher ratio indicates that the company might be taking on too much debt in relation to its revenue.
Renminbi (RMB): Renminbi or RMB is the official currency of the People’s Republic of China. The primary unit of the renminbi is the yuan (CNY). The symbol for the Chinese Yuan Renminbi (CNY) is ¥.
Nio Inc. uses the Renminbi (RMB) for its financial transactions and reporting. The current exchange rate for the Chinese Yuan Renminbi (CNY) to the US Dollar (USD) is approximately 7.24 CNY for 1 USD.
How Does Nio Inc. Manage Its Debt?
NIO Inc. manages its debt through several strategies to ensure financial stability and growth:
- Maintaining Liquidity: NIO keeps a substantial amount of cash and cash equivalents, along with short-term investments, to cover its debt obligations. As of the end of fiscal year 2023, NIO had RMB 55.3 billion (approximately US$7.6 billion) in total cash.
- Balancing Debt and Equity: NIO maintains a moderate debt-to-equity ratio, which helps manage leverage and reduce financial risk. The company’s total debt was RMB 22.9 billion (approximately US$3.1 billion) as of the end of fiscal year 2023.
- Interest Coverage: NIO ensures that its operating income is sufficient to cover interest expenses, maintaining a healthy interest coverage ratio.
- Debt Maturity Management: The company manages its debt maturities effectively, ensuring that it has sufficient liquidity to meet upcoming debt payments.
- Strategic Partnerships: NIO has formed strategic partnerships, such as its joint venture with Jianghuai Automobile Group Co., to share manufacturing and operational responsibilities, reducing the financial burden on NIO.
By implementing these strategies, NIO aims to manage its debt efficiently while continuing to invest in growth and innovation.
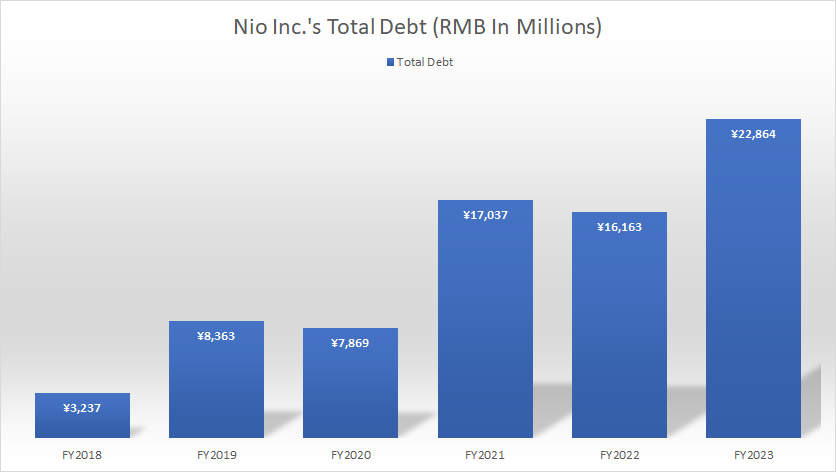
Nio Inc Total Debt
Nio Inc total debt
(click image to enlarge)
Nio Inc. uses the Renminbi (RMB), also known as the Yuan (CNY), for its financial transactions and reporting. The definition and exchange rate of the RMB to USD is available here: Renminbi (RMB).
As of December 31, 2023, NIO Inc.’s total debt outstanding reached RMB 22.9 billion (approximately US$3.1 billion), marking an increase of over 40% compared to the previous year.
Of this total, approximately RMB 5.1 billion was short-term debt, RMB 4.7 billion was due within one year, and RMB 13 billion was long-term debt.
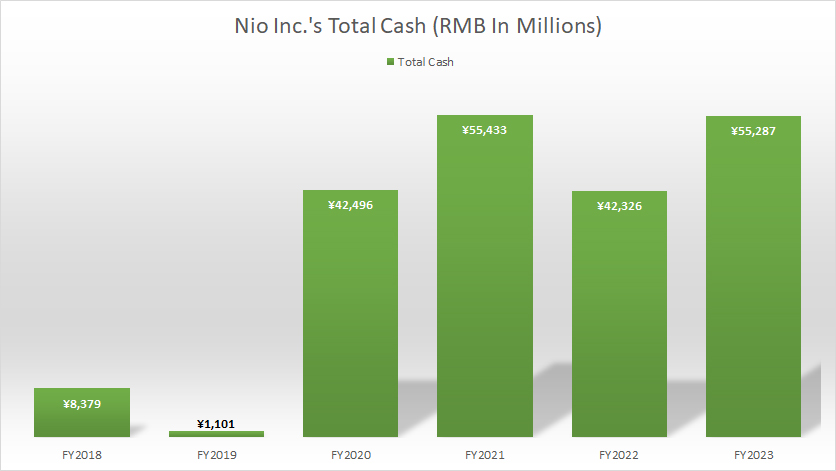
Nio Inc Total Cash
Nio Inc total cash
(click image to enlarge)
Nio Inc. uses the Renminbi (RMB), also known as the Yuan (CNY), for its financial transactions and reporting. The definition and exchange rate of the RMB to USD is available here: Renminbi (RMB).
As of the end of fiscal year 2023, NIO Inc. had a total cash holding of RMB 55.3 billion (US$ 7.6 billion). This amount included approximately RMB 38.5 billion in cash & cash equivalents and restricted cash, and around RMB 17 billion in short-term investments.
NIO’s cash on hand has remained relatively stable since fiscal year 2020, as depicted in the chart above.
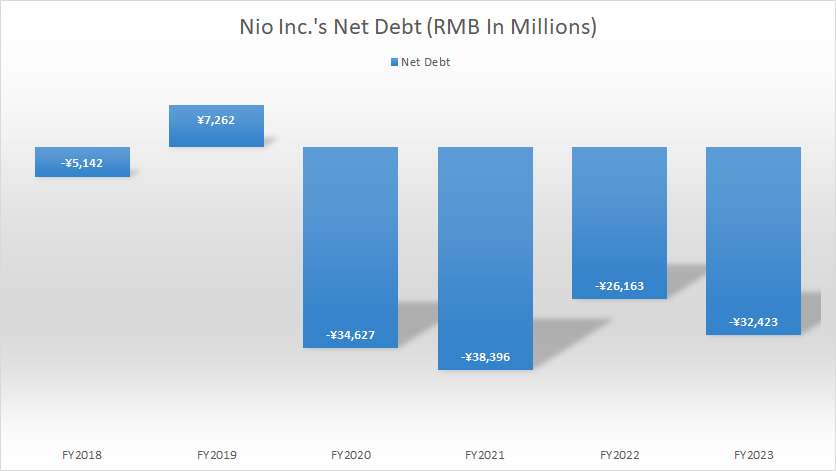
Nio Inc Total Debt Less Total Cash
Nio Inc net debt
(click image to enlarge)
Nio Inc. uses the Renminbi (RMB), also known as the Yuan (CNY), for its financial transactions and reporting. The definition and exchange rate of the RMB to USD is available here: Renminbi (RMB).
NIO Inc. effectively had no net debt as of the end of fiscal year 2023, due to its substantial cash assets. The company’s net debt was -RMB 32.4 billion, reflecting that its cash holdings significantly exceeded its total indebtedness.
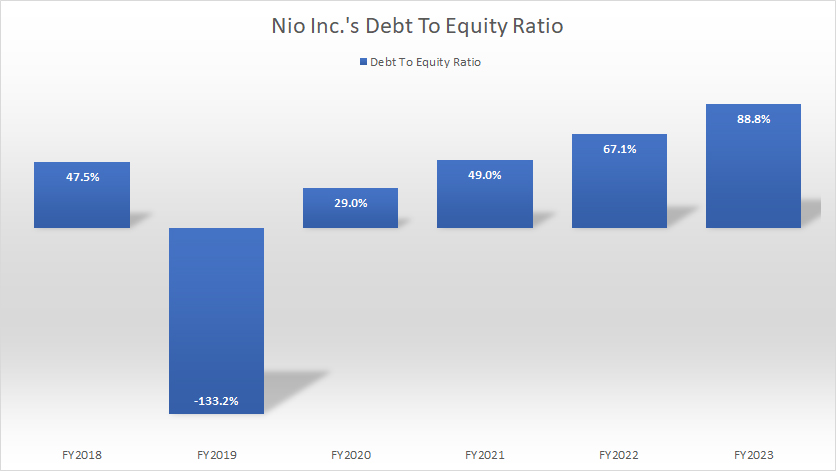
Nio Inc Debt To Equity Ratio
Nio Inc debt to equity ratio
(click image to enlarge)
Nio’s debt-to-equity ratio has risen considerably since fiscal year 2018, reaching 89% (0.89x) as of the end of fiscal year 2023.
Despite this significant growth, Nio’s debt leverage relative to total equity remains moderately low, with the company having only RMB 0.89 of debt for every RMB 1 of equity.
Nio Inc Debt To Asset Ratio
Nio Inc debt to asset ratio
(click image to enlarge)
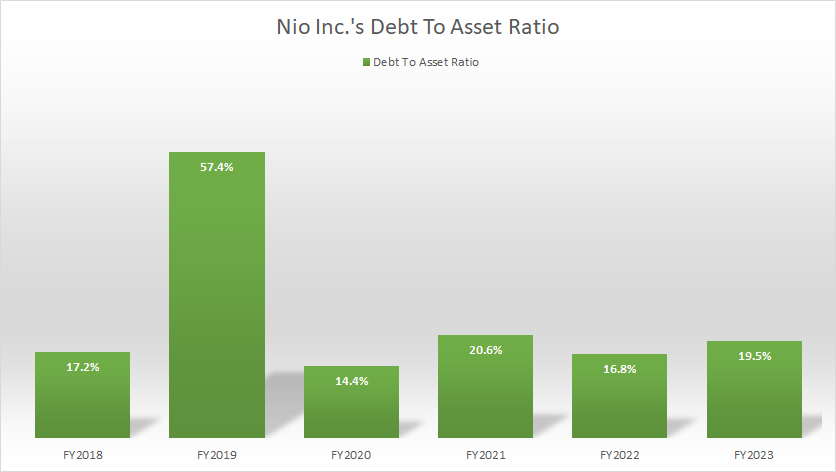
The debt-to-asset ratio provides insight into Nio’s capital structure. As of fiscal year 2023, Nio’s total debt represented just 20% of the company’s total assets, indicating that debt constituted a relatively small portion of its capital structure.
This ratio has remained relatively stable over the past six years, likely due to the management’s consistent approach to handling debt.
Nio Inc Debt To Sales Ratio (Debt Margin)
Nio Inc debt to sales ratio
(click image to enlarge)
The definition of debt to revenue is available here: debt to revenue ratio.
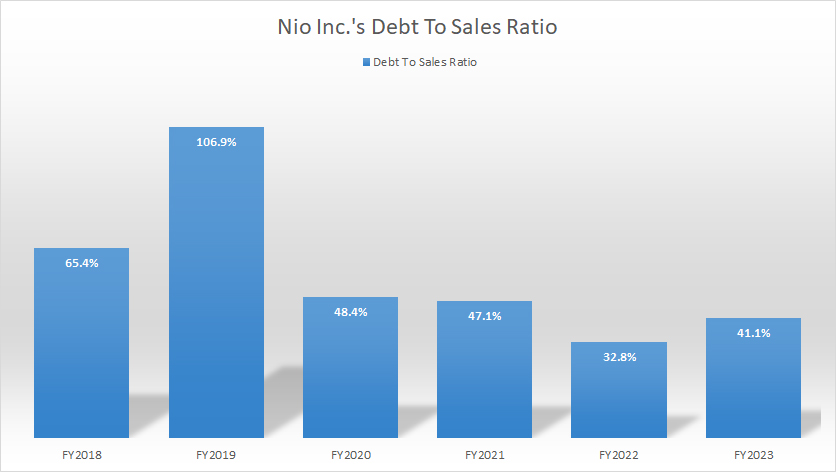
Although Nio’s debt levels have been increasing, the debt-to-sales ratio has been decreasing with respect to sales revenue.
As shown in the chart above, Nio’s debt-to-sales ratio, or debt margin, has been declining since fiscal 2018 and reached 41% (0.41x) in fiscal year 2023, marking one of the lowest levels in the past six years.
This decreasing ratio reflects the company’s strong revenue growth over the years. Therefore, the decline in the debt-to-sales ratio is a positive indicator of Nio’s financial health.
Nio Inc Operating Profit Vs Interest Expense
Nio Inc operating income vs interest expense
(click image to enlarge)
Nio Inc. uses the Renminbi (RMB), also known as the Yuan (CNY), for its financial transactions and reporting. The definition and exchange rate of the RMB to USD is available here: Renminbi (RMB).
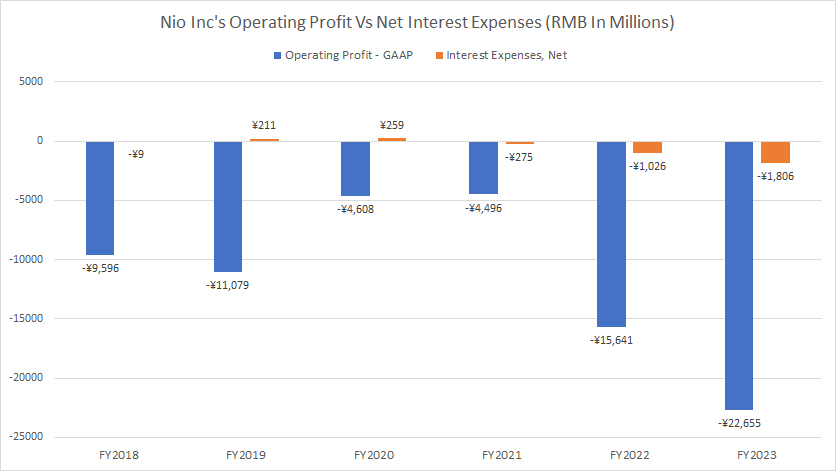
For your information, Nio Inc has never been profitable, as detailed in this article – Nio profit and margins. Consequently, Nio’s operating profit, a GAAP measure, has been negative, as seen in the chart above.
While the company is not making any profit, its interest expense is often negative in most fiscal years. This is because Nio also derives interest income from its short and long-term investments. In many fiscal years, Nio’s interest income was significantly higher than its interest expense, resulting in negative interest expense, as shown in the chart above.
Although Nio may not be able to cover its interest expense with its operating profit, it can do so with its interest income. As seen in the chart above, in fiscal 2022, Nio’s interest income far exceeded its respective interest expense. In this scenario, Nio’s interest coverage ratio is not applicable.
Nio Inc Debt Due
nio-inc-material-cash-requirements
(click image to enlarge)
Nio Inc. uses the Renminbi (RMB), also known as the Yuan (CNY), for its financial transactions and reporting. The definition and exchange rate of the RMB to USD is available here: Renminbi (RMB).
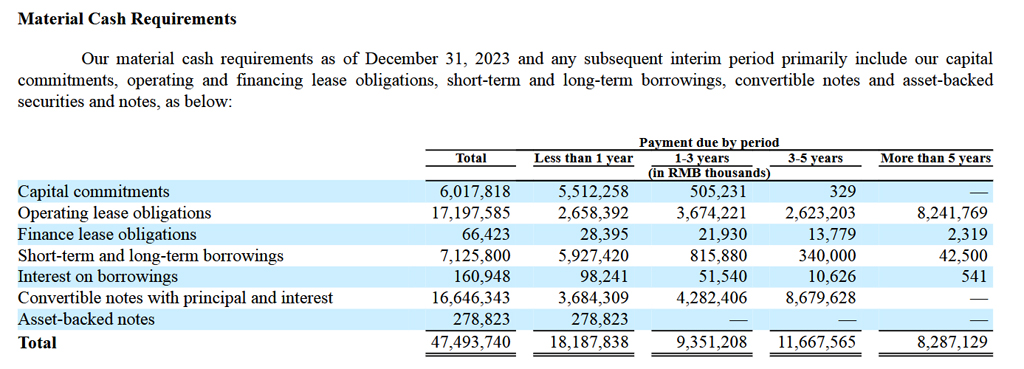
As shown in the snapshot above, Nio’s total payment due within one year from December 31, 2023, was RMB 18.2 billion (US$ 2.5 billion). Of this amount, debt payments alone — including short-term and long-term borrowings, convertible notes with principal and interest, and asset-backed notes — accounted for RMB 10 billion, or about half of the total payment due.
Between fiscal years 2024 and 2026, Nio’s total payment due amounts to RMB 9.4 billion. From fiscal year 2026 onward, the total payment due is RMB 11.7 billion. The cumulative amount over these periods is RMB 47.5 billion (US$ 6.4 billion).
Does Nio have enough liquidity to meet the material cash requirements in 2024 and the years after? We will find out in the next section.
Nio Inc Sources Of Liquidity
Nio Inc’s total liquidity as of 31 Dec 2023.
| Sources Of Liquidity | RMB In Billions | |
|---|---|---|
| Committed Capacity | Available Capacity | |
| Cash & Cash Equivalents | – | ¥38.5 |
| Short-Term Investments | – | ¥16.8 |
| Non-Collateral-Based Bank Facilities | ¥16.3 | ¥9.0 |
| Collateral-Based Bank Facilities | ¥48.1 | ¥31.0 |
| Operating Cash Flow | – | ¥0.0 (estimated) |
| Total | – | ¥95.0 |
Nio Inc. uses the Renminbi (RMB), also known as the Yuan (CNY), for its financial transactions and reporting. The definition and exchange rate of the RMB to USD is available here: Renminbi (RMB).
Nio Inc’s sources of liquidity include cash and cash equivalents, short-term investments, and credit facilities from banks. Over the past three years, Nio’s cash from operating activities has been negative, averaging zero.
Despite this, Nio had RMB 95 billion in total liquidity as of December 31, 2023, as shown in the table above. Although the Chinese automaker had access to this substantial liquidity, it does not require the entire amount to meet its cash obligations.
For example, Nio’s cash and cash equivalents alone can cover all material cash requirements in 2024, which amounts to RMB 18.2 billion, as detailed in the section: total payment due.
Moreover, Nio’s cash and cash equivalents are also sufficient to cover the material cash requirements due between 2024 and 2026, which totals RMB 27.6 billion (RMB 18.2 billion + RMB 9.4 billion).
By including short-term investments, Nio Inc’s liquidity can cover the cumulative material cash requirements, totaling RMB 47.5 billion. This calculation does not even account for the additional liquidity available from its credit facilities.
The following quote shows what Nio said about its liquidity in the 2023 annual report:
- “We believe that our current cash, cash equivalents and short-term investments balance as of December 31, 2023 is sufficient to fund our operating activities, capital expenditures and other obligations for at least the next twelve months.”
Although the annual report indicates that liquidity is sufficient for the next 12 months, I believe Nio’s total liquidity can cover all payment obligations through 2024 and beyond. This confidence is based on Nio’s substantial cash reserves, short-term investments, and the availability of additional liquidity from credit facilities.
Nio Inc Credit Rating
Nio Inc’s credit ratings as of 31 Dec 2023.
| Rating Institutions | Types Of Indebtedness | Outlook | |
|---|---|---|---|
| Long-Term Debt | Short-Term Debt | ||
| Standard & Poor’s | N.A. | N.A. | N.A. |
| Moody’s | N.A. | N.A. | N.A. |
| Fitch | N.A. | N.A. | N.A. |
As of 31 Dec 2023, Nio Inc has not published any credit rating regarding its debt obligation in its 2023 annual reports.
Conclusion
Nio Inc. has managed its debt effectively, maintaining a moderately low leverage relative to equity and a low debt-to-asset ratio. The company’s robust liquidity, supported by substantial cash reserves and short-term investments, ensures it can meet its payment obligations through fiscal year 2024 and beyond. This strong liquidity position, combined with a decreasing debt-to-sales ratio, reflects the company’s healthy financial status and strong revenue growth.
References and Credits
1. All financial figures presented in this article were obtained and referenced from Nio Inc.’s annual reports published in the company’s investor relation page: Nio’s Financial Results.
2. Featured images presented in this article are used under creative commons licenses and sourced from Pixabay.
Disclosure
References and examples such as tables, charts, and diagrams are constantly reviewed to avoid errors, but we cannot warrant the full correctness of all content.
The content in this article is for informational purposes only and is neither a recommendation nor a piece of financial advice to purchase a stock.
If you find the information in this article helpful, please consider sharing it on social media and also provide a link back to this article from any website so that more articles like this one can be created in the future.
Thank you!

