Electric cars. Pixabay Image.
Nio Inc. (NYSE:NIO) is a Chinese startup that designs and develops what the company calls premium smart electric vehicles.
The company differentiates itself from other EV startups through technological breakthroughs and innovation which include its industry-leading battery swapping technologies, Battery as a Service, or BaaS, as well as its proprietary autonomous driving technologies and Autonomous Driving as a Service, or ADaaS.
While Nio derives its revenue primarily from China, it has sales offices in other countries around the world, particularly in the U.S. and Europe.
Nio’s vehicle portfolio consists of mainly large and mid-size SUVs and sedans. That said, this article presents Nio’s revenue and revenue breakdown by category.
Apart from revenue, we also explore the company’s profit and margins.
Investors interested in Nio’s vehicle sales volume may visit this article – Nio vehicle sales.
Let’s take a look!
Please use the table of contents to navigate this page.
Table Of Contents
Definitions And Overview
- Vehicle Sales
- Vehicle Margin
- Parts, Accessories And After-Sales Vehicle Services
- Provision Of Power Solutions
- Other Revenue Sources
- Battery as a Service (BaaS)
- Battery Swapping Service
- Battery Upgrade Service
- Sales Of Automotive Regulatory Credits
O2. How Does Nio Generate Revenue?
Consolidated Results
A1. Total Revenue And Revenue Breakdown (In USD)
A2. Total Revenue And Revenue Breakdown (In RMB)
Results In Percentage
B1. Percentage Of Vehicle Sales And Other Sales Revenues
Growth Rates
B2. Growth Rates Of Total Revenue, Vehicle Sales And Other Sales Revenue
Results By Category (New)
C1. Breakdown Of Other Sales Revenue
Results By Category (Legacy)
C2. Breakdown Of Other Sales Revenue
Margin
D1. Vehicle Margin
Summary And Reference
S1. Conclusion
S2. References and Credits
S3. Disclosure
Definitions
To help readers understand the content better, the following terms and glossaries have been provided.
Vehicle Sales: Nio defines vehicle sales as revenues from vehicle sales, which represent revenues from sales of new vehicles.
Vehicle Margin: Nio defines the vehicle margin as the margin of new vehicle sales, which is calculated based on revenues and cost of sales derived from new vehicle sales only.
Parts, Accessories And After-Sales Vehicle Services: Nio’s revenue from parts, accessories and after-sales vehicle services includes repair, maintenance, service package, extended warranty services and other vehicle services.
Provision Of Power Solutions: Nio’s revenue from provision of power solutions includes sale of charging piles, provision of battery charging and swapping services, battery upgrade services, BaaS battery buy-out services and other power solution services.
Other Revenue Sources: Nio’s revenue from others consists of sales of used vehicles, auto financing services, retail merchandise, automotive regulatory credits, embedded products and services offered together with vehicle sales, including vehicle connectivity services, and other products and services.
Battery as a Service (BaaS): Nio’s Battery as a Service (the “BaaS”), allows users to purchase electric vehicles without batteries and subscribe for the usage of batteries separately.
Battery Swapping Service: Nio provides battery swapping service to users with convenient “recharging” experience by swapping the user’s battery for another one.
The battery swapping service is in substance a charging service instead of non-monetary exchanges or sales of batteries as the batteries involved in such swapping are the same in capacity and very similar in performance.
Battery Upgrade Service: Nio provides battery upgrade service to both BaaS users and non-BaaS users.
The users can exchange their batteries with lower capacity for the batteries with higher capacity from the Group with a fixed cash consideration.
Sales Of Automotive Regulatory Credits: Nio explains that New Energy Vehicle (“NEV”) mandate policy launched by China’s Ministry of Industry and Information Technology (“MIIT”) specifies the NEV credit targets.
Since all of Nio’s products are NEVs, the company is able to generate NEV credits above target. The credits earned per vehicle is dependent on various metrics such as vehicle driving range and battery energy efficiency, and is calculated based on the MIIT published formula.
Excess positive NEV credits are tradable to other vehicle manufacturers through a credit management system established by the MIIT on a separately negotiated basis. Nio sells these credits at agreed price to other vehicle manufacturers.
How Does Nio Generate Revenue?
Nio Inc. generates revenue primarily by selling electric vehicles (EVs). Their lineup includes smart, premium electric SUVs and sedans designed with advanced technology and features. In addition to vehicle sales, Nio also earns revenue from:
1. **Battery as a Service (BaaS)**: This innovative model allows customers to purchase vehicles without batteries, which can be leased separately. This reduces the upfront cost of the vehicles.
2. **Charging Infrastructure**: Nio is investing in a network of battery-swapping stations and charging points, which can also generate revenue.
3. **After-sales Services**: This includes maintenance, repairs, and other services for existing customers.
4. **Merchandising and Brand Experiences**: Nio sells merchandise and offers experiences that promote the brand.
5. **Software and Updates**: They also develop proprietary software and technology that may include features sold or subscribed to post-purchase.
Overall, Nio combines traditional car sales with innovative services that cater to the growing EV market.
Total Revenue And Revenue Breakdown (In USD)
nio-inc-total-revenue-and-revenue-brekdown-usd
(click image to expand)
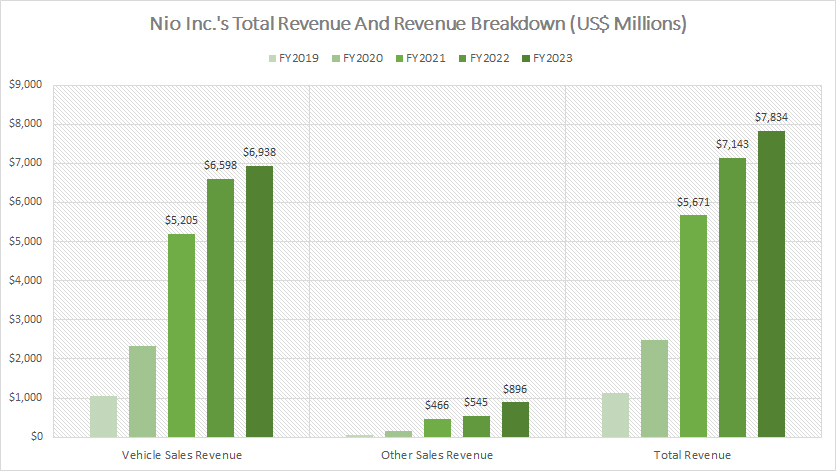
Nio’s total revenue consists of revenue from vehicle sales and other sales. The definitions of Nio’s vehicle sales and other sales are available here: vehicle sales and other sales.
Nio’s total revenue reached a record high of US$7.8 billion in fiscal year 2023, up 10% from US$7.1 billion reported in fiscal year 2022.
The majority of Nio’s revenue is derived from vehicle sales, as shown in the chart above. Nio’s vehicle sales revenue reached a record figure of US$6.9 billion in fiscal year 2023, up 5% from US$6.6 billion reported in fiscal year 2022.
Nio’s other sales revenue topped US$900 million in fiscal year 2023, nearly double the number in 2022.
Total Revenue And Revenue Breakdown (In RMB)
nio-inc-total-revenue-and-revenue-brekdown-rmb
(click image to expand)
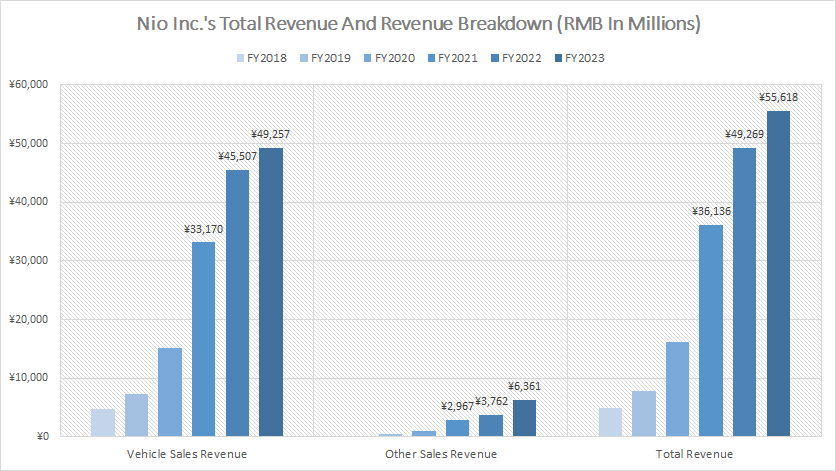
Nio’s total revenue consists of revenue from vehicle sales and other sales. The definitions of Nio’s vehicle sales and other sales are available here: vehicle sales and other sales.
In terms of the Chinese renminbi (RMB), Nio’s total revenue came in at RMB 55.6 billion in fiscal year 2023, an increase of 13% or roughly RMB 6.3 billion from 2022.
Again, Nio’s vehicle sales make up the majority of its total revenue, accounting for RMB 49.3 billion in fiscal year 2023, up slightly from RMB 45.5 billion in 2022 and was much higher from 2018.
Nio’s revenue from other sales came in at RMB 6.4 billion in fiscal year 2023, accounting for only a small portion of its total. However, other sales revenue has significantly risen since fiscal year 2018. Particularly, it nearly doubled from RMB 3.8 billion in 2022 to RMB 6.4 billion in 2023.
Percentage Of Vehicle Sales And Other Sales Revenues
Nio’s percentage of revenue by segment
(click image to enlarge)
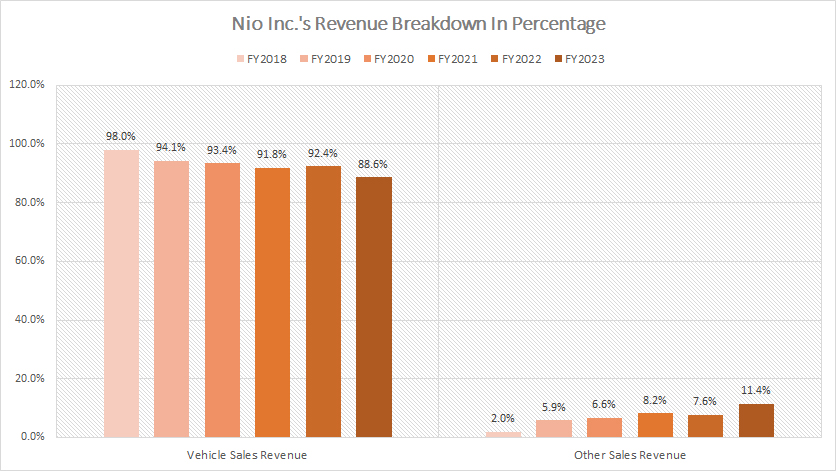
From a percentage perspective, Nio’s vehicle sales have consistently represented more than 90% of the company’s total revenue since fiscal year 2018. However, this ratio declined to 88.6% in fiscal year 2023, driven primarily by the growth of other revenue sources.
On the other hand, Nio’s other sales revenue has grown from 2.0% in 2018 to 11.4% as of 2023, the highest level ever measured.
The rising contribution of other sales revenue illustrates the growing importance of Nio’s other sales channels, particularly the parts, accessories, and, after-sales vehicle services, and power-related solutions, as well as others, which we will see in subsequent sections.
Growth Rates Of Total Revenue, Vehicle Sales And Other Sales Revenue
Nio revenue growth rates
(click image to enlarge)
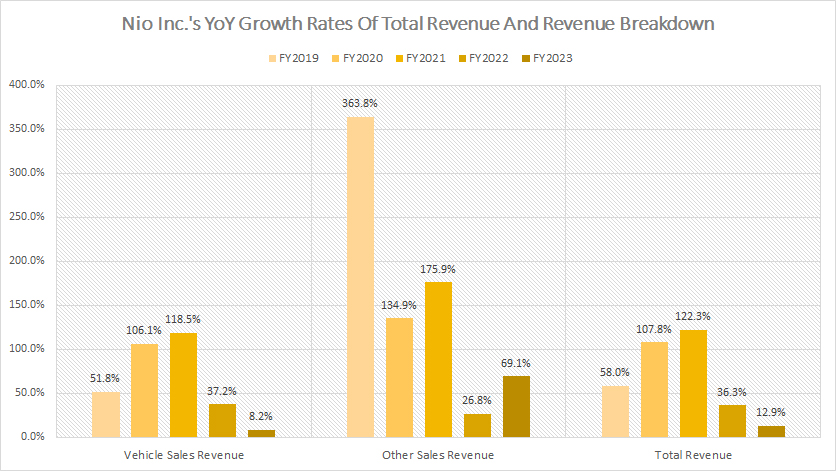
On a consolidated basis, Nio’s total revenue increased by 13% in fiscal year 2023. Since fiscal year 2021, Nio’s total revenue growth has averaged 57%. However, we can see that Nio’s total revenue growth has significantly slowed in recent years, particularly in 2023, primarily driven by the slowdown in vehicle sales. The 13% YoY growth rate registered in 2023 was the slowest revenue growth the company has ever reported.
In terms of vehicle sales, Nio’s revenue growth in this segment measured just 8.2% in fiscal year 2023, a significant slowdown compared to the growth rates in prior years. For example, Nio’s revenue growth in vehicle sales topped 118.5% and 37.2% in fiscal years 2021 and 2022, respectively. Since fiscal year 2021, Nio’s vehicle sales revenue growth has averaged 55%.
Nio’s revenue growth in other sales has averaged 91% over the last three years since 2021. In fiscal year 2023, this segment grew 69%, a much higher figure than vehicle sales. However, Nio’s other sales contributed just 11% of sales to the total in 2023.
Breakdown Of Other Sales Revenue (New)
nio-inc-brekdown-of-other-sales-revenue-new
(click image to expand)
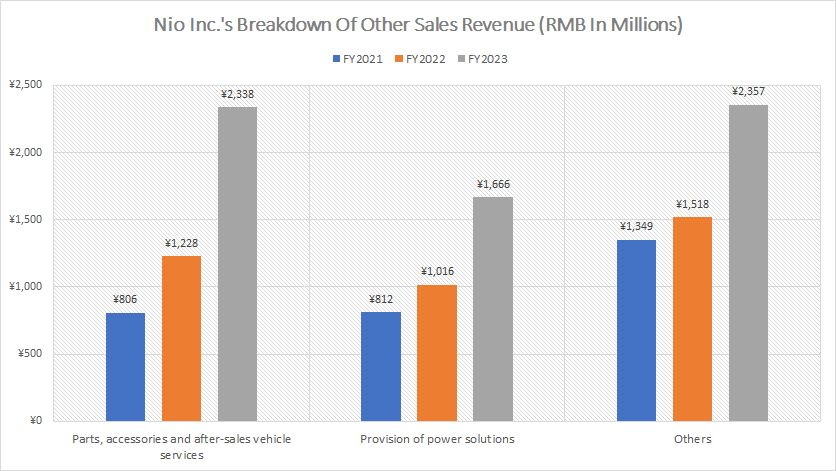
In the latest financial statement, Nio’s other sales revenue consists of several categories, and they are parts, accessories and after-sales vehicle services, provision of power solutions, and others, as depicted in the chart above. The definitions of these categories are available here: parts, accessories and after-sales vehicle services, provision of power solutions, and others.
Nio’s revenue from parts, accessories and after-sales vehicle services totaled RMB 2.3 billion in 2023, nearly double the amount in the prior year.
Nio’s revenue from provision of power solutions reached RMB 1.7 billion, while other revenue source topped a staggering RMB 2.4 billion.
A significant trend is that all revenue sources under the other sales segment have all significantly grown over the last three years, marking the growing importance of this revenue segment to the company.
In prior discussions, we saw that the revenue contribution from all of these categories made up around 11% of the total, the highest ratio ever measured over the last three years.
Breakdown Of Other Sales Revenue (Legacy)
nio-inc-brekdown-of-other-sales-revenue-legacy
(click image to expand)
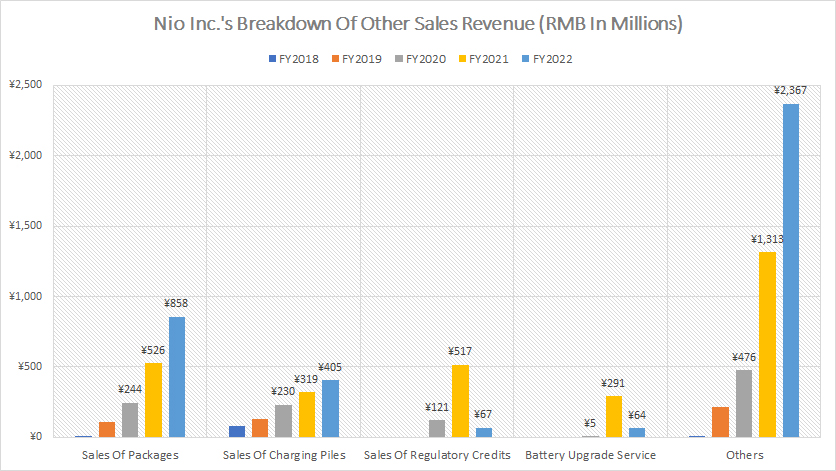
This section is a legacy report as Nio is no longer providing the breakdown of these categories in fiscal year 2023.
The definitions of these categories are available here: sales of automotive regulatory credits and battery upgrade service.
Nio’s other revenue sources are negligible compared to vehicle sales revenue. Apart from vehicle sales, Nio also generates revenue from sales of packages, charging piles, and regulatory credits, as well as battery upgrade service.
While these revenue segments are small, they have grown significantly over the years and can add up to quite a remarkable number.
For example, Nio’s sales of packages alone totaled more than RMB 1.6 billion (USD 228 million) between fiscal 2020 and 2022.
Similarly, Nio earned roughly RMB 700 million (USD 100 million) from the sales of regulatory credits over the last three years.
In addition, Nio also earned significant revenue from charging and battery service-related sales. This segment alone generated more than RMB 1.3 billion (USD 184 million) from fiscal 2020 to 2022.
Vehicle Margin
nio-inc-vehicle-margin
(click image to expand)
The definition of Nio’s vehicle margin is available here: vehicle margin.
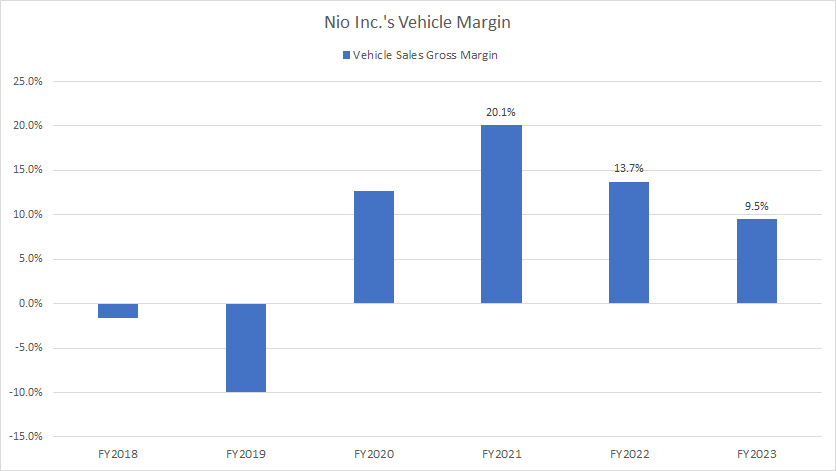
Nio’s vehicle margin topped 20% in fiscal year 2021, the highest lever ever measured. This figure has significantly declined since then, down to just 9.5% as of 2023, the lowest ratio ever measured in the last four years.
Nio’s declining vehicle margin can be due to several factors such as increased competition, rising production costs, rising spending on investment in research and development, production scaling, and increasing sales incentives and promotions.
Conclusion
To recap, Nio achieved record total revenue of RMB 55.6 billion (US$ 7.8 billion) as of 2023. Vehicle sales contribute to the bulk of the total revenue, topping 89% in percentage in fiscal year 2023.
Although revenue and vehicle sales have reached higher levels in recent years, Nio’s vehicle margin has deteriorated, driven by a multitude of factor, including rising competition, soaring production costs, increased in spending on R&D, production scaling, and possibly growing sales incentives and promotions to boost sales
References and Credits
1. All financial figures in this article were obtained and referenced from Nio Inc.’s SEC filings, earnings reports, financial statements, etc, which are available in Nio’s Financial Filings.
2. Pixabay Images.
Disclosure
References and examples such as tables, charts, and diagrams are constantly reviewed to avoid errors, but we cannot warrant the full correctness of all content.
The content in this article is for informational purposes only and is neither a recommendation nor a piece of financial advice to purchase a stock.
If you find the information in this article helpful, please consider sharing it on social media and also provide a link back to this article from any website so that more articles like this one can be created in the future.
Thank you!

