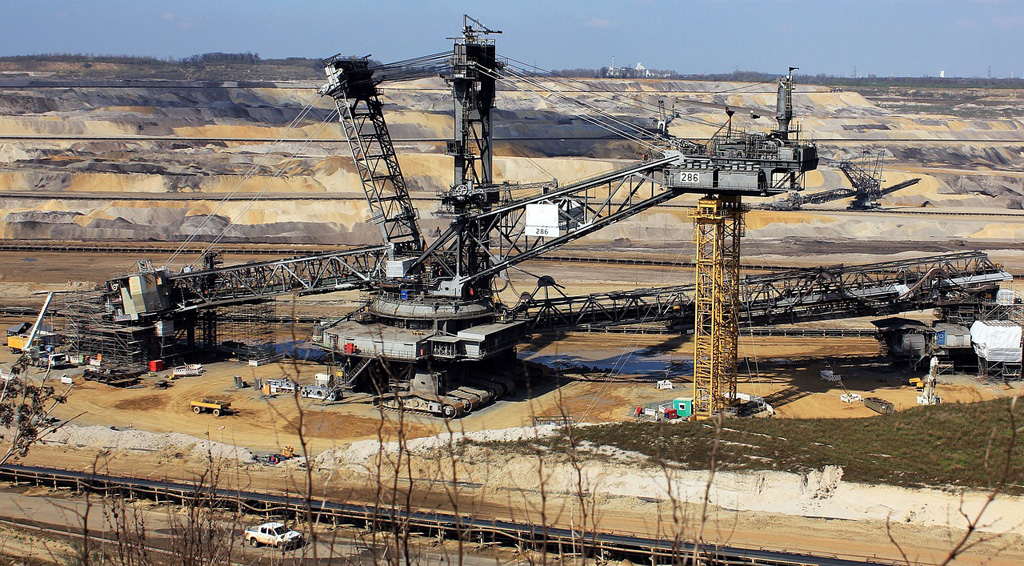
Open pit mining. Source: Pixabay
This article presents the revenue, revenue breakdown, profitability, and margins of Peabody Energy Corporation (NYSE:BTU).
For your information, Peabody Energy is one of the biggest coal miners in the U.S., with a market cap topping nearly $3 billion as of June 2023.
The information presented in this article is only about the sales revenue and profitability of Peabody Energy.
If you are interested in the coal sales volume, you may visit this page here – Peabody Global And U.S. Coal Sales Numbers.
If you are looking for revenue and profitability on a per-ton basis, this article is for you – Peabody Coal Price And Profit Per Ton.
For Peabody’s dividends, this article lays out several reasons that the company is a reliable dividend payer and other factors that suggest Peabody’s cash dividends are not safe – Is Peabody A Good Dividend Stock.
All said, let’s head out to the following topics.
Peabody Revenue, Profit And Margin Topics
Consolidated Results
A1. Revenue And Profitability
A2. Margins
Revenue By Segment/Region
B1. Revenue From Seaborne Mining Operations
B2. Percentage Of Revenue From Seaborne Mining Operations
B3. Revenue From U.S. Mining Operations
B4. Percentage Of Revenue From U.S. Mining Operations
Profitability By Segment/Region
C1. Profitability From Seaborne Mining Operations
C2. Percentage Of Profitability From Seaborne Mining Operations
C3. Profitability From U.S. Mining Operations
C4. Percentage Of Profitability From U.S. Mining Operations
Margins By Segment/Region
D1. Margin For Seaborne Mining Operations
D2. Margin For U.S. Mining Operations
D3. Margin Comparison Between Seaborne And U.S. Mining Operations
Revenue By Coal Type
E1. Thermal And Metallurgical Revenue
E2. Percentage Of Thermal And Metallurgical Revenue
Revenue By Market Type
F1. Domestic And Export Revenue
F2. Percentage Of Domestic And Export Revenue
Conclusion And Reference
S1. Conclusion
S2. References and Credits
S3. Disclosure
Peabody’s Consolidated Revenue And Profitability
Peabody consolidated revenue and profitability
(click image to enlarge)
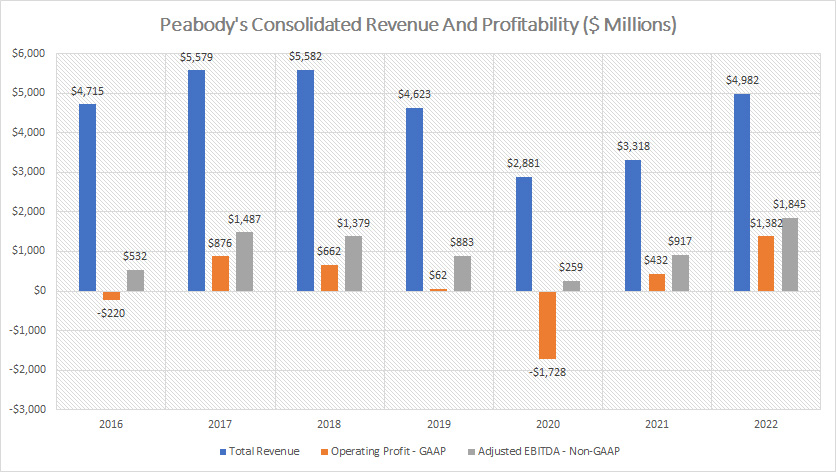
Peabody’s total revenue peaked at roughly $5.6 billion recorded between fiscal 2017 and 2018.
The total revenue figure dived considerably to only $2.9 billion in fiscal 2020 at the onset of the COVID-19 pandemic.
However, Peabody’s total revenue has recovered significantly in post-pandemic periods and reached a record high of nearly $5 billion as of 2022.
Operating-wise, Peabody Energy had been a profitable company in nearly all fiscal years except for fiscal 2016 and 2020.
In most fiscal years, Peabody had been able to generate positive operating income, with the latest figure topping a record high of $1.4 billion USD recorded in 2022.
In terms of the adjusted EBITDA, a non-GAAP measure, Peabody also had been able to produce positive figures in all fiscal years, illustrating the solid cash earnings generated by the company.
As of 2022, Peabody reported a record high of $1.8 billion USD in adjusted EBITDA.
In short, Peabody’s revenue and profitability had been on the rise after the pandemic and reached record figures as of 2022, illustrating the excellent business prospect of the company in a post-pandemic world.
Peabody’s Consolidated Margins
Peabody consolidated margins
(click image to enlarge)
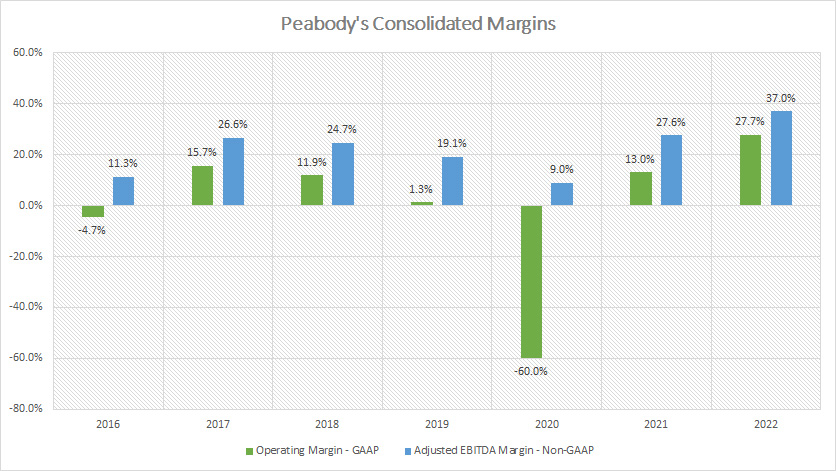
Margin-wise, Peabody’s results had been quite disappointing in most fiscal years.
For example, the company had only been able to record an operating margin of slightly over 10% on a GAAP basis in most fiscal years.
However, since fiscal 2020, Peabody’s operating margin had been on the rise and reached a record figure of 28% as of 2022, illustrating the rising profitability of the company in the post-pandemic periods.
A similar trend applies to the company’s adjusted EBITDA margin whose figure also had recovered significantly after 2020 and reached 37% as of fiscal 2022, also a new high over the past 7 years.
Peabody’s Revenue From Seaborne Mining Operations
Peabody revenue from seaborne mining operations
(click image to enlarge)
Peabody’s seaborne mining operations are located mainly in Australia.
Within the seaborne mining operations, 2 types of coal are mined, namely thermal and metallurgical coal.
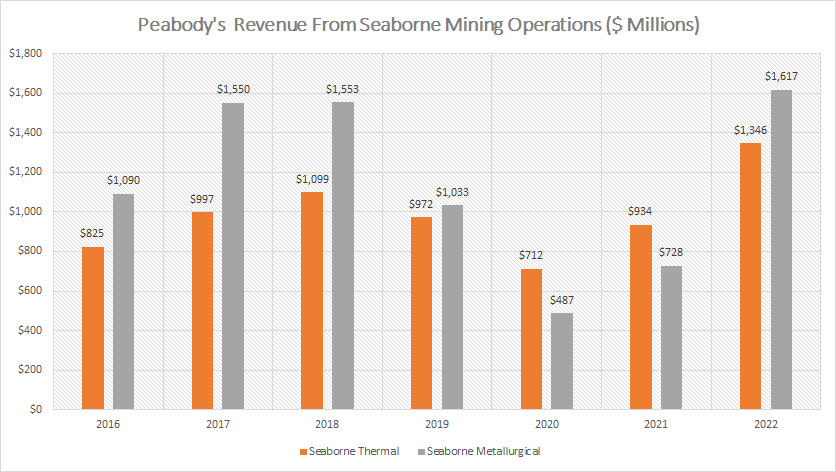
That said, Peabody’s revenue generated from seaborne metallurgical coal had been slightly higher than those generated from seaborne thermal coal in most fiscal years.
Since fiscal 2020 or after the pandemic, Peabody’s revenue from seaborne mining operations had significantly recovered, particularly for seaborne metallurgical coal.
In fiscal 2022, Peabody’s metallurgical coal revenue surged to a record figure of $1.6 billion USD compared to $1.3 billion USD for seaborne thermal coal.
We can see that Peabody’s seaborne mining operations generate a large portion of revenue from both thermal and metallurgical coal, totaling nearly $3 billion USD in combined value as of fiscal 2022.
Peabody’s Percentage Of Revenue From Seaborne Mining Operations
Peabody percentage of revenue from seaborne mining operations
(click image to enlarge)
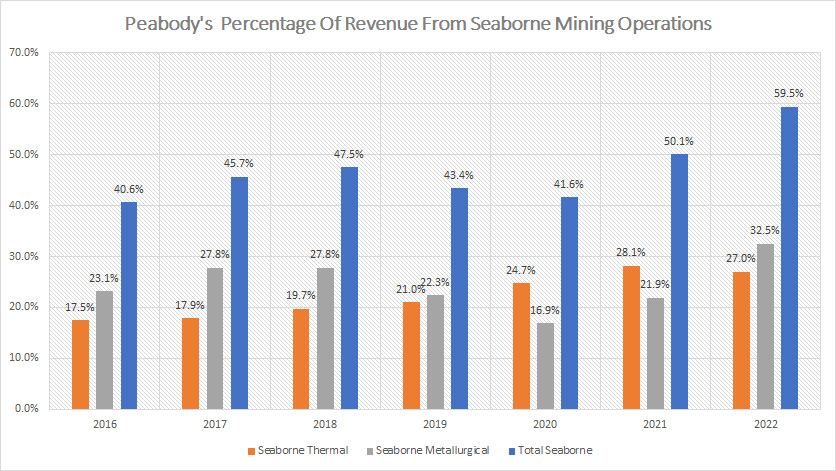
From the perspective of percentage, Peabody’s results have been on the rise over the years for revenue generated from seaborne mining operations.
For example, the percentage figure reached a record figure of 60% of total sales as of 2022 for the combined revenue of seaborne thermal and metallurgical coal.
Peabody’s seaborne thermal coal alone accounts for 27% of the company’s total revenue in fiscal 2022 while that of seaborne metallurgical coal reached even higher at 32.5% in the same fiscal year.
In short, Peabody’s revenue derived from seaborne mining operations has formed the bulk of the company’s total revenue since fiscal 2021.
Peabody’s Revenue From U.S. Mining Operations
Peabody revenue from U.S. mining operations
(click image to enlarge)
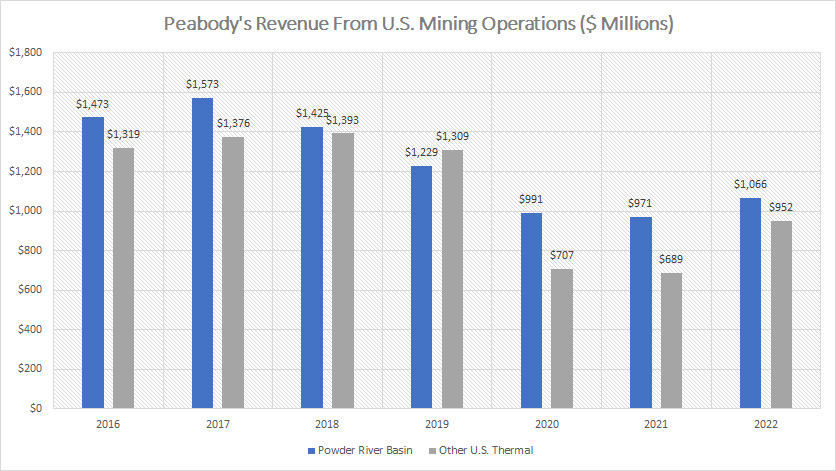
Peabody’s U.S. mining operations are divided into 2 regions, namely Powder River Basin and other U.S. thermal.
Other U.S. thermal mining operations are located primarily in the Western and Midwestern of the U.S.
That said, for the U.S. mining operations, Peabody’s revenue derived from this segment used to be much higher but had slowly decreased over time and reached record lows as of 2022 as shown in the chart above.
For example, Peabody’s revenue derived from coal mined in the Powder River Basin region totaled only $1.1 billion in fiscal 2022, a far lower figure compared to prior highs.
Similarly, Peabody’s revenue derived from coal mined in other U.S. locations totaled less than $1 billion as of fiscal 2022, also a seemingly low figure compared to historical highs.
While revenues from the U.S. mining operations have recovered in post-pandemic periods, they were still far below those reported prior to the pandemic.
Also worth mentioning is that Peabody’s revenues produced from the U.S. mining operations were significantly below that of its overseas counterparts as of 2022.
Granted, Peabody had a combined revenue of only $2 billion in the U.S. compared to overseas results which totaled nearly $3 billion as of 2022.
Peabody’s Percentage Of Revenue From U.S. Mining Operations
Peabody percentage of revenue from U.S. mining operations
(click image to enlarge)
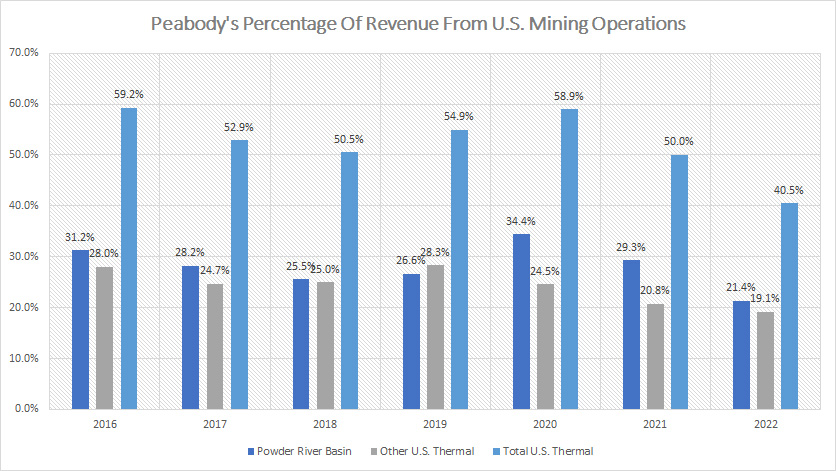
From the perspective of percentage, Peabody’s U.S. revenue had been much higher, notably at more than 50% of total revenue after combining the sales figures from both the Powder River Basin and other U.S. mining regions.
However, this ratio dropped to only 40% as of 2022, the lowest number that has ever been measured.
In fiscal 2022, Peabody’s revenue derived from the Powder River Basin region accounts for only 21% of the company’s total revenue while that of other U.S. thermal totaled only 19% in the same fiscal year, also the lowest over the past 7 years.
Peabody’s Profitability From Seaborne Mining Operations
Peabody profit from seaborne mining operations
(click image to enlarge)
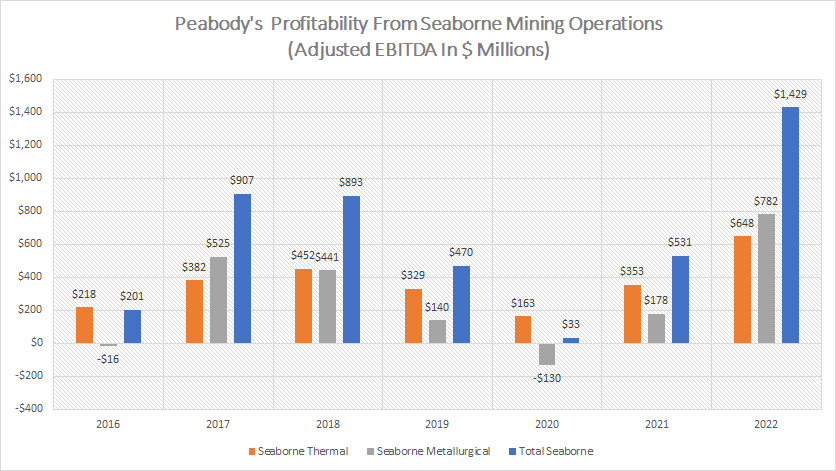
Peabody’s profitability from seaborne mining operations is measured in the adjusted EBITDA provided by the company in every earnings report.
That said, Peabody produced a profit from its seaborne mining operations in nearly all fiscal years except for fiscal 2020 when the company incurred a loss within its metallurgical sector.
In fiscal 2020, Peabody’s adjusted EBITDA seems to have reached a bottom and has since been on the rise.
As of 2022, Peabody generated a record adjusted EBITDA of $1.4 billion from total seaborne mining operations, a record profit produced by the company’s overseas locations.
Of that $1.4 billion in adjusted EBITDA reported in fiscal 2022, Peabody’s seaborne thermal accounts for $648 million while seaborne metallurgical took up $782 million USD.
In short, Peabody’s overseas mining operations generate record profitability for the company in post-pandemic periods.
Peabody’s Percentage Of Profitability From Seaborne Mining Operations
Peabody percentage of profit from seaborne mining operations
(click image to enlarge)
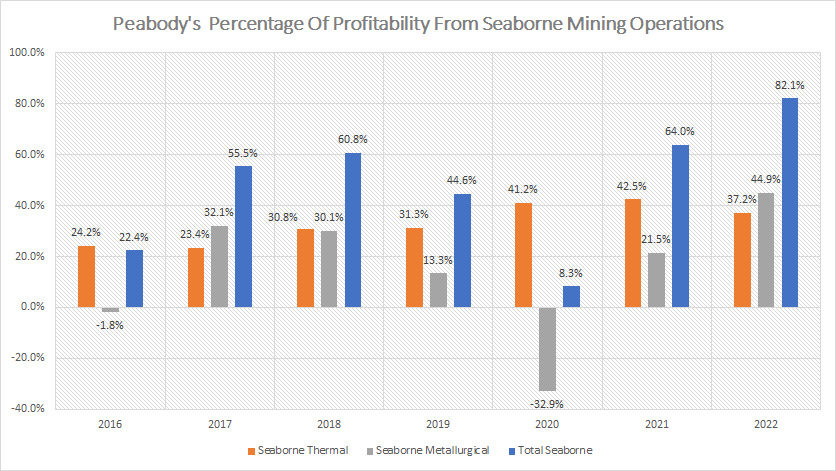
Apart from being the highest in terms of percentage of revenue, Peabody’s seaborne mining operations also contribute the largest percentage of profit to the company.
As shown in the chart above, Peabody’s total seaborne mining operations account for a massive 82% of the company’s total adjusted EBITDA as of 2022, representing nearly all of the company’s profits.
More importantly, this ratio also has been on the rise after reaching a bottom in 2020, illustrating the turnaround the company has been having in the post-pandemic periods.
Peabody’s seaborne thermal alone accounts for 37% of the company’s total adjusted EBITDA in fiscal 2022 while that of seaborne metallurgical coal took up a record high of 45% in the same fiscal year.
In short, Peabody’s overseas mining operations are now the biggest contributor of profits to the company.
Peabody’s Profitability From U.S. Mining Operations
Peabody profit from U.S. mining operations
(click image to enlarge)
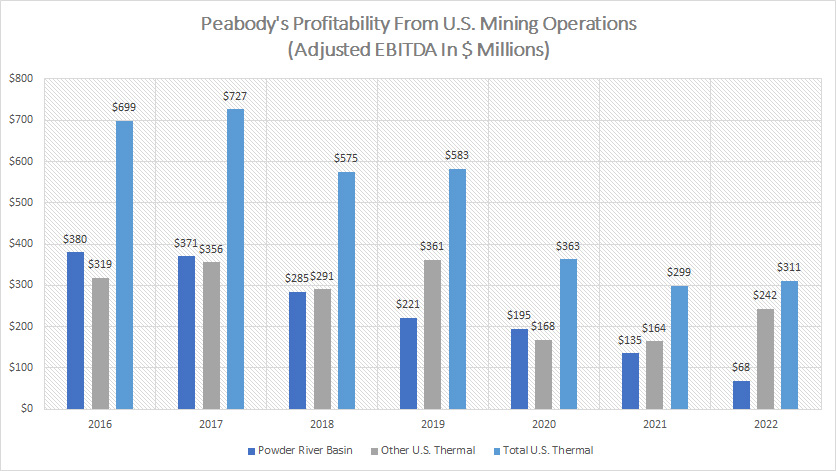
Peabody’s profitability from the U.S. mining operations is measured in the adjusted EBITDA as shown in the chart above.
While Peabody’s profitability from the U.S. mining operations has been on a decline over time, it has never lost any money which is unlike its seaborne mining operations.
As of fiscal 2022, Peabody’s profitability from the U.S. mining operations reached the lowest levels at only $311 million in adjusted EBITDA, which was a far lower figure compared to that of seaborne mining operations.
Of the $311 million in adjusted EBITDA reported in 2022, only $68 million came from the Powder River Basin region while the rest of the number, $242 million was contributed by other U.S. thermal.
In short, Peabody’s profitability from the U.S. mining operations has declined considerably over time and reached record lows as of 2022
Peabody’s Percentage Of Profitability From U.S. Mining Operations
Peabody percentage of profit from U.S. mining operations
(click image to enlarge)
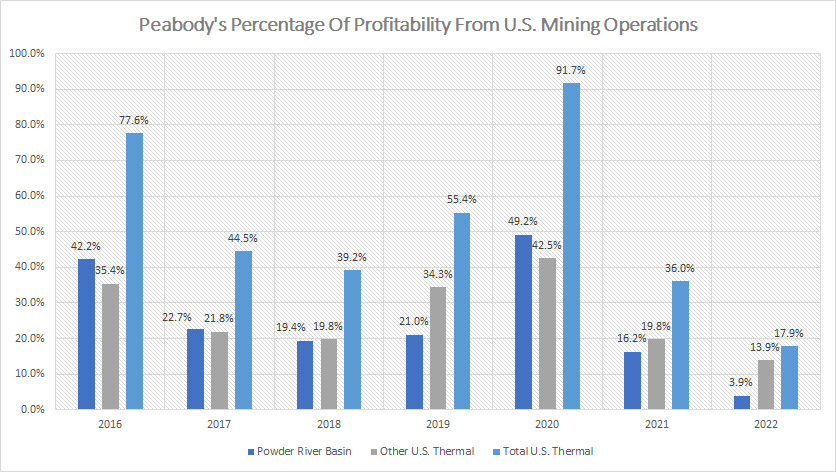
Peabody’s percentage of profitability from the U.S. mining operations has declined considerably as of 2022 compared to the peak figures recorded in 2020.
As seen, Peabody’s total U.S. thermal mining operations represent only 18% of the total adjusted EBITDA as of fiscal 2022, the lowest figure over the past 7 years.
Of that figure, Peabody’s profitability from Powder River Basin totaled only 4% while that of other U.S. thermal made up 14% of the company’s total adjusted EBITDA.
Also worth mentioning is that the low percentage of profitability from the U.S. mining operations reported in 2022 seems like not a corner case.
The 2021 results also were one of the lowest numbers the company has ever reported.
Therefore, Peabody’s U.S. mining operations contribute not only the least revenue but also the least profit to the company.
Peabody’s Margin For Seaborne Mining Operations
Peabody margin for seaborne mining operations
(click image to enlarge)
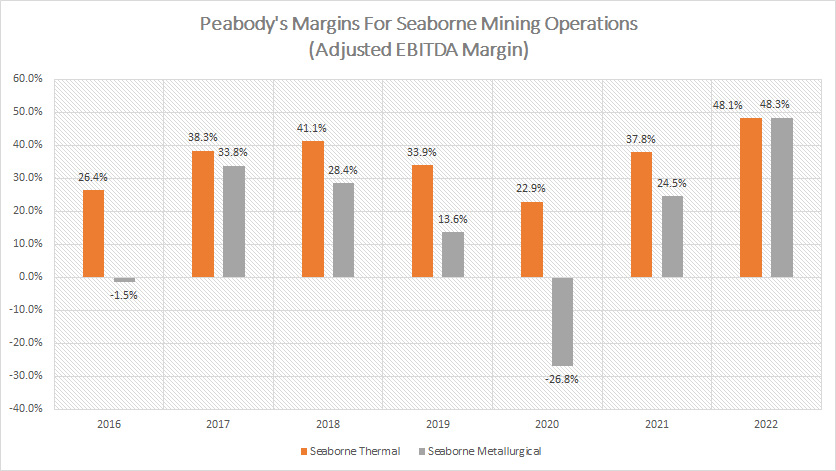
From the perspective of margin, Peabody’s seaborne thermal mining operations had a much better margin than the seaborne metallurgical.
For example, the adjusted EBITDA margin of Peabody’s seaborne thermal mining operations beats its metallurgical counterpart hands down in most fiscal years.
However, as of 2022, Peabody’s adjusted EBITDA margin for seaborne metallurgical mining operations surged to a record high of 48% and was at the same level as that of seaborne thermal mining operations.
With an adjusted EBITDA margin of nearly 50%, Peabody’s seaborne thermal and metallurgical mining operations are extremely profitable businesses.
A trend worth pointing out is the growing margins of both seaborne thermal and metallurgical mining operations since 2020, indicating the increasing profitability of the company’s overseas sectors.
Peabody’s Margin For U.S. Mining Operations
Peabody margin for U.S. mining operations
(click image to enlarge)
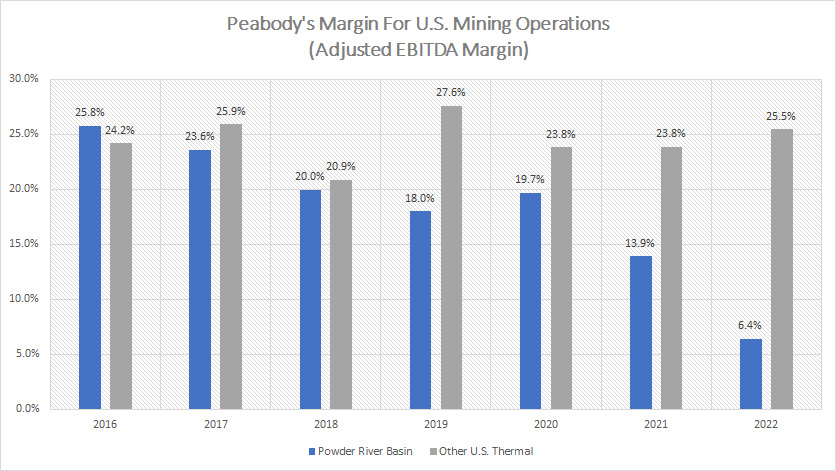
For the U.S. mining operations, the adjusted EBITDA margins are slightly lower compared to that of seaborne mining operations.
However, Peabody’s margins for the Powder River Basin region had significantly declined over time and reached a record low of only 6% as of fiscal 2022.
On the other hand, Peabody had been able to keep its adjusted EBITDA margin at more than 20% for other U.S. thermal mining operations.
As of fiscal 2022, Peabody managed to achieve an adjusted EBITDA margin of as much as 25.5% for other U.S. thermal mining operations.
Therefore, Peabody’s Powder River Basin mining operations are the least profitable among all regions in the world.
Peabody’s Margin Comparison Between Seaborne And U.S. Mining Operations
Peabody margin comparison between seaborne and U.S. mining operations
(click image to enlarge)
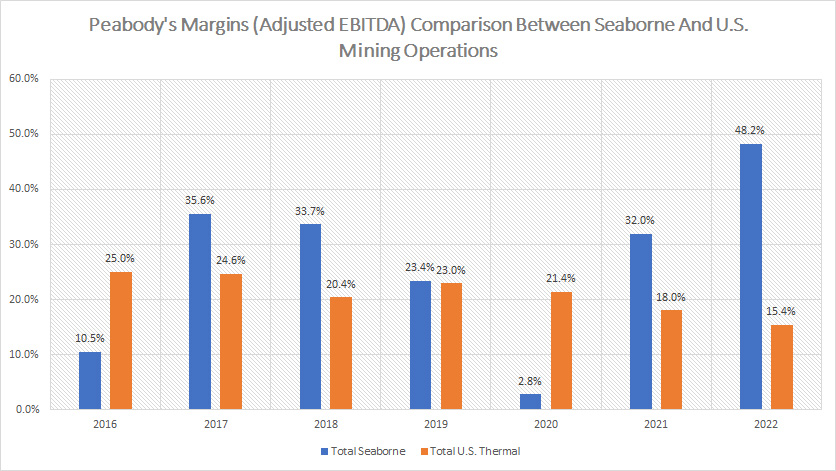
On a consolidated basis, we can see that Peabody’s seaborne mining operations are much more profitable than the U.S. mining operations from the perspective of the adjusted EBITDA margin.
More importantly, the adjusted EBITDA margin for seaborne mining operations had been on the rise since 2020 while that of the U.S. mining operations had been on the decline over the same period.
As of 2022, Peabody achieved an adjusted EBITDA margin of only 15% for its U.S. mining operations while that of seaborne mining operations reached a massive 48%.
Therefore, Peabody’s seaborne mining operations have much better margins and are much more profitable than U.S. mining operations.
Peabody’s Thermal And Metallurgical Revenue
Peabody revenue from thermal and metallurgical mining operations
(click image to enlarge)
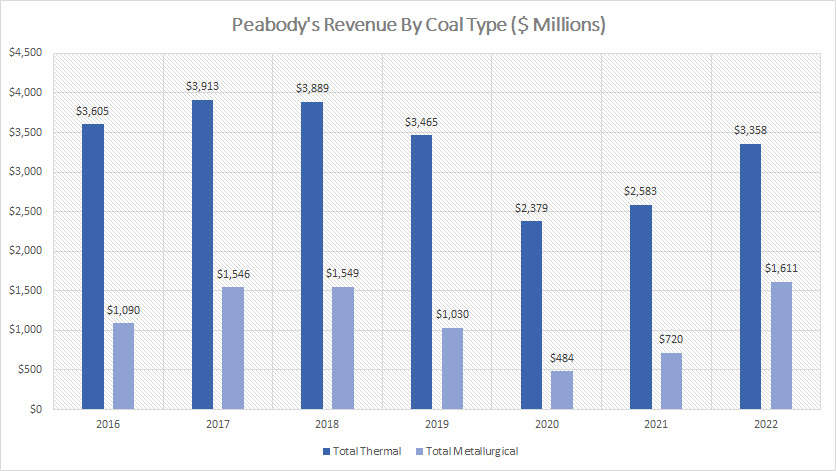
Peabody’s revenue from thermal mining operations still accounts for the bulk of the company’s total sales.
For example, as of fiscal 2022, Peabody’s revenue from thermal mining operations totaled $3.4 billion compared to only $1.6 billion for metallurgical mining operations.
Therefore, Peabody’s revenue produced by thermal mining operations is roughly twice the value of metallurgical mining operations in most fiscal years and some numbers are even more.
Also, a trend worth pointing out is the growing revenue in both thermal and metallurgical mining operations since fiscal 2020.
However, we can see that the revenue growth from metallurgical mining operations had been much greater than that of thermal mining operations.
For example, since fiscal 2020, Peabody’s revenue produced by metallurgical mining operations had grown more than 200% while that of thermal mining operations had grown only 40% during the same period.
Peabody’s Percentage Of Thermal And Metallurgical Revenue
Peabody percentage of revenue from thermal and metallurgical mining operations
(click image to enlarge)
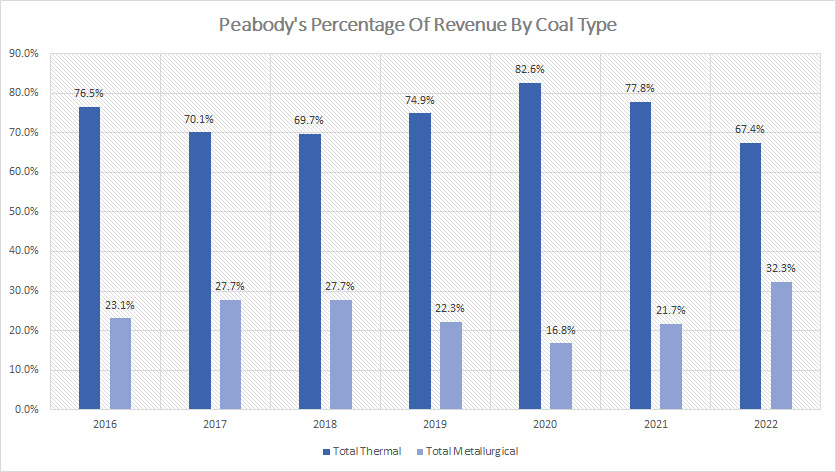
From the perspective of percentage, Peabody’s thermal mining operations had a much higher revenue share compared to metallurgical mining operations.
For example, Peabody’s thermal mining operations had revenue shares of more than 70% in most fiscal years.
However, this ratio declined to only 67% as of fiscal 2022 while that of metallurgical mining operations surged to 32%, the highest figure that has ever been recorded.
In short, Peabody Energy’s revenue comes primarily from its thermal mining operations, notably at around 67% of the total volume as of 2022.
Peabody’s Domestic And Export Revenue
Peabody revenue from domestic and export mining operations
(click image to enlarge)
Apart from selling its coal to the domestic market, Peabody Energy also exports its coal to other countries.
However, the export of coal sales applies to only the company’s seaborne mining operations.
For U.S. mining operations, the coal mined in U.S. territories is primarily used for domestic consumption.
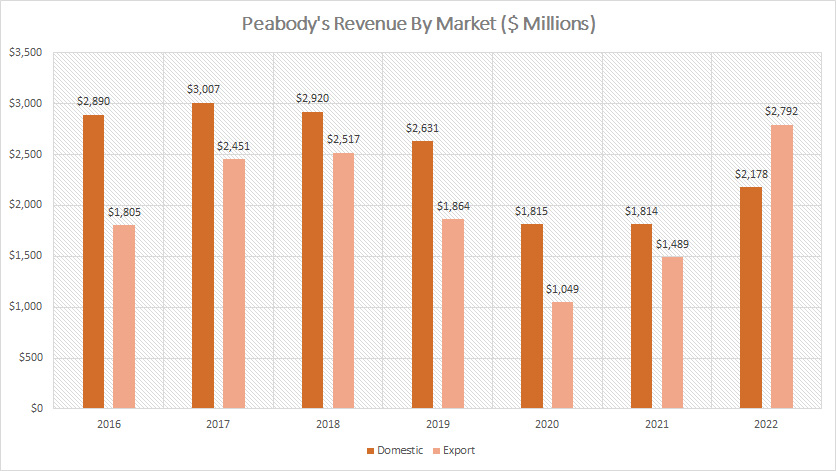
All said, Peabody’s revenue produced from the domestic market used to be much higher than the export market.
However, as of 2022, Peabody’s export revenue surged to a record high of $2.8 billion, which was much higher than the revenue produced in the domestic market.
Besides, Peabody’s export revenue also has been on the rise since 2020, illustrating the significant recovery in the export market in the post-pandemic world.
On the other hand, Peabody’s revenue from domestic mining operations grew modestly in 2022 over 2021 and was flat in 2021 over 2020.
In short, Peabody derived a large portion of its revenue from the export market, notably at $2.8 billion in 2022.
Peabody’s Percentage Of Domestic And Export Revenue
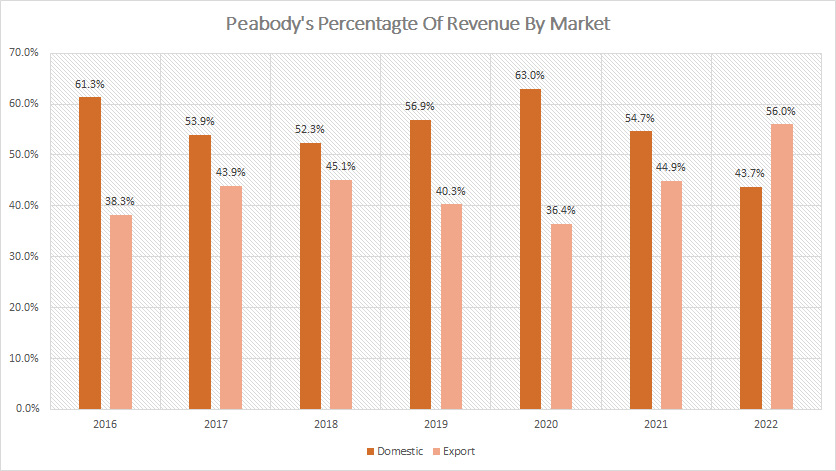
Peabody percentage of revenue from domestic and export mining operations
(click image to enlarge)
From the perspective of percentage, Peabody’s domestic revenue used to be taking up a larger portion but the portion was much smaller in 2022 compared to the export revenue.
As of 2022, Peabody’s export revenue accounts for 56% of the company’s total revenue while the domestic market revenue accounts for only 44% of the company’s total sales.
Again, the ratio of Peabody’s export revenue has been on the rise after fiscal 2020, illustrating the significant recovery in the export market for the company.
On the other hand, the ratio of Peabody’s domestic market revenue has been going down since fiscal 2020, and reached a record low in fiscal 2022, indicating the decline of the contribution of the company’s domestic market revenue.
In short, Peabody’s export market revenue accounts for the majority of the company’s total sales, notably at 56% as of 2022.
Conclusion
To recap, Peabody Energy’s business prospect has greatly recovered from the slump encountered in fiscal 2020.
As of 2022, Peabody Energy’s results, including revenue, profitability, and margin, have reached record highs.
In particular, Peabody’s seaborne mining operations grew the fastest and recovered the most compared to its U.S. mining operations.
From the profitability perspective, Peabody’s seaborne mining operation also is the most profitable compared to U.S. mining operations.
Also, Peabody’s seaborne mining operations made up roughly 82% of the company’s adjusted EBITDA reported in 2022.
Therefore, Peabody’s seaborne mining operations account for the bulk of the company’s profit.
In addition, Peabody’s thermal coal accounts for the majority of the company’s total sales, at 67% of the company’s total revenue reported in 2022.
Credits and References
1. All financial figures in this article were obtained and referenced from Peabody’s earnings reports, SEC filings, and other statements which are available in Peabody Investor Center.
2. Featured images in this article are used under creative commons license and sourced from Pixabay.
Disclosure
References and examples such as tables, charts, and diagrams are constantly reviewed to avoid errors, but we cannot warrant the full correctness of all content.
The content in this article is for informational purposes only and is neither a recommendation nor a piece of financial advice to purchase a stock.
If you find the information in this article helpful, please consider sharing it on social media and also provide a link back to this article from any website so that more articles like this one can be created in the future.
Thank you!

