AB InBev’s beer. Pixabay Image.
AB InBev is a multinational beverage and brewing company headquartered in Leuven, Belgium. With a history that dates back to 1366, the company has grown to become the world’s largest brewer and one of the most recognizable brands in the industry.
AB InBev’s portfolio includes over 500 brands, including popular names like Budweiser, Stella Artois, Corona, and Beck’s. The company operates in over 50 countries and employs over 170,000 people worldwide.
Despite its size, AB InBev is committed to sustainability and has set ambitious goals to reduce its carbon footprint and promote responsible consumption of its products.
In this article, we will discuss the financial performance of Anheuser-Busch InBev (AB InBev) by presenting its consolidated revenue and revenue breakdown by region and segment.
Additionally, we will analyze the company’s profit and margin by region and segment to understand how each area performs.
Investors interested in AB InBev’s production volume may find more statistics on this page: AB InBev production volume by region and segment.
Let’s get started!
Please use the table of contents to navigate this page.
Table Of Contents
Definitions And Overview
- North America
- Middle Americas
- South America
- EMEA
- Asia Pacific
- Normalized EBIT And EBITDA
- Non-underlying Items
- Normalized Financials
O2. AB InBev Business Strategy
O3. How Does AB InBev Generate Revenue
Consolidated Revenue
A1. Worldwide Revenue
A2. Growth Rates Of Worldwide Revenue
Consolidated Profits And Margins
A3. Consolidated Profits
A4. Consolidated Margins
Sales By Region
B1. Revenue By Region
B2. Revenue Contribution By Region
B3. Growth Rates Of Revenue By Region
Profit Contribution By Region
C1. Gross Profit Contribution By Region
C2. Operating Profit Contribution By Region
Margins By Region
D1. Gross Margin By Region
D2. Operating Profit Margin By Region
Summary And Reference
S1. Summary
S2. References and Credits
S3. Disclosure
Definitions
To help readers understand the content better, the following terms and glossaries have been provided.
North America: ABI’s North American region includes the following countries: United States and Canada.
Middle Americas: ABI’s Middle Americas region includes the following countries: the Caribbean, Colombia, Costa Rica, the Dominican Republic, Ecuador, El Salvador, Guatemala, Honduras, Mexico,
Panama and Peru.
South America: ABI’s South American region includes the following countries: Argentina, Bolivia, Brazil, Chile, Paraguay and Uruguay.
EMEA: ABI’s EMEA region includes the following countries: Austria, Belgium, France, Germany, Ireland, Italy, Luxembourg, the Netherlands, Spain, Switzerland, the United Kingdom, Botswana, Ghana, Lesotho, Mozambique, Namibia, Nigeria, South Africa, Swaziland, Tanzania, Uganda and Zambia and other African, European and Middle East countries.
Asia Pacific: ABI’s Asia Pacific region includes the following countries: China, India, Japan, New Zealand, South Korea, Vietnam and other South Asian and Southeast Asian countries.
Normalized EBIT And EBITDA: Normalized EBIT and EBITDA are non-IFRS measures utilized by AB InBev to demonstrate the company’s underlying performance.
Normalized EBIT represents normalized profit from operations.
Normalized EBITDA is a measure used by the management to evaluate the company’s business performance and is defined as profit from operations before exceptional items, depreciation, amortization and impairment.
Normalized EBITDA excludes the following effects from profit attributable to equity holders of AB InBev: (i) non-controlling interest; (ii) income tax expense; (iii) share of results of associates; (iv) non-underlying share of results of associates; (v) net finance income or cost; (vi) non-underlying net finance income or cost; (vii) non-underlying items above EBIT; and (viii) depreciation, amortization and impairment.
The definitions of ABI’s non-underlying items and normalized financials are available here: non-underlying items and normalized financials.
Non-underlying Items: ABI defines the non-underlying items as income or expenses that do not occur regularly as part of the normal activities of the company. They are presented separately because they are important for understanding the underlying sustainable performance of ABI due to their size or nature.
Normalized Financials: ABI’s normalized financials are analyzed eliminating the impact of changes in currencies on translation of foreign operations, and scope changes.
Scope changes represent the impact of acquisitions and divestitures, the start or termination of activities or the transfer of activities between segments, curtailment gains and losses and year-over-year changes in accounting estimates and other assumptions that management does not consider as part of the business’s underlying performance.
AB InBev Business Strategy
AB InBev’s business strategy focuses on being a global leader in the beer and beverage industry. The company aims to achieve this by leveraging its scale and operational efficiency to drive growth and profitability.
AB InBev’s strategy is centered around four key pillars: 1) Expanding its brand portfolio through mergers and acquisitions, 2) Innovating to meet changing consumer preferences, 3) Building strong relationships with retailers and wholesalers, and 4) Investing in sustainability and responsible business practices.
By executing these pillars, AB InBev seeks to create value for its shareholders, customers, and the communities in which it operates.
How Does AB InBev Generate Revenue
AB InBev generates revenue primarily through the sale of beer and other alcoholic beverages. The company produces and distributes a wide range of beers, including popular brands such as Budweiser, Corona, and Stella Artois.
It also generates revenue by selling non-alcoholic beverages, such as soft and energy drinks. In addition, AB InBev earns money through the sale of merchandise related to its brands and through licensing and sponsorship deals.
Overall, AB InBev is a large and successful company with diverse revenue streams.
Worldwide Revenue
ABI worldwide revenue
(click image to expand)
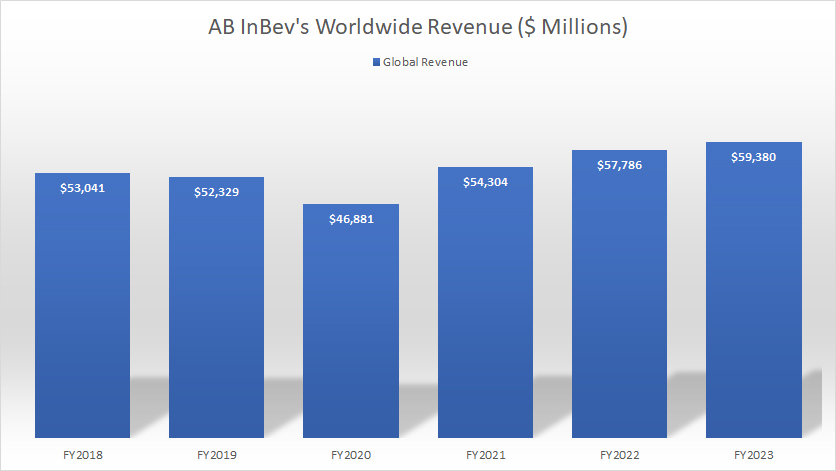
AB InBev earned $54.3 billion, $57.8 billion, and $59.4 billion in worldwide revenue in fiscal years 2021, 2022, and 2023, respectively.
AB InBev’s worldwide or global revenue has risen by 27% since 2020, from $46.9 billion in 2020 to $59.4 billion as of 2023.
Growth Rates Of Worldwide Revenue
ab-inbev-worldwide-revenue-growth
(click image to expand)
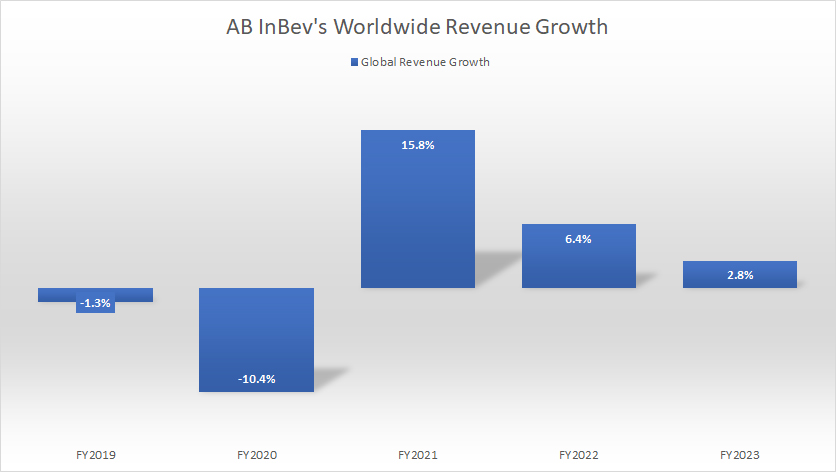
AB InBev’s global revenue growth was 2.8% in fiscal 2023, down slightly from 6.4% in 2022. On average, AB InBev’s revenue grew 8.3% between 2021 and 2023.
In short, AB InBev’s sales have been recovering since 2021.
Consolidated Profits
ab-inbev-consolidated-profits
(click image to expand)
The definitions of ABI’s normalized EBIT and normalized EBITDA are available here: Normalized EBIT And EBITDA.
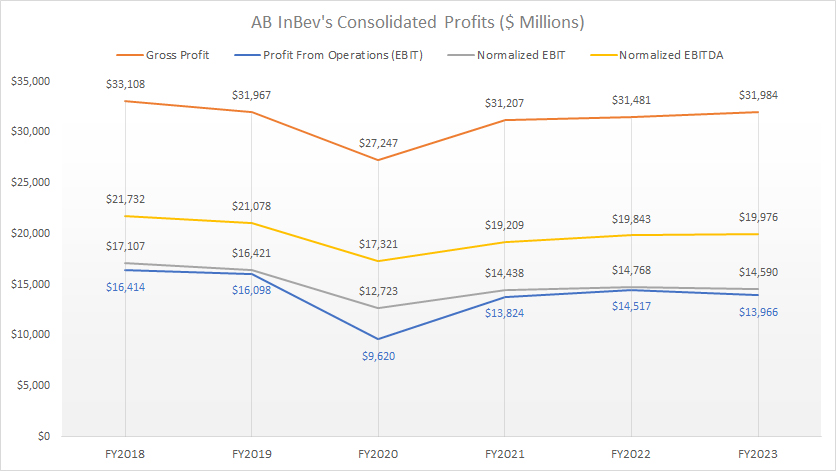
AB InBev reported gross profits of $31.2 billion, $31.5 billion, and $32.0 billion in fiscal years 2021, 2022, and 2023 respectively. In the same periods, the company earned profits from operations of $13.8 billion, $14.5 billion, and $14.0 billion, respectively.
The figures for non-IRFS metrics, such as normalized EBIT and normalized EBITDA, were much better. For example, in fiscal year 2023, AB InBev recorded a normalized EBITDA of $20 billion, about 42% higher than the respective profit from operations.
Despite the COVID-19 crisis between 2020 and 2022, AB InBev has been able to maintain profitability over the last six years. Although profitability decreased significantly in 2020, it quickly recovered the following year.
Consolidated Margins
ABI consolidated margin
(click image to expand)
The definitions of ABI’s normalized EBIT and normalized EBITDA are available here: Normalized EBIT And EBITDA.
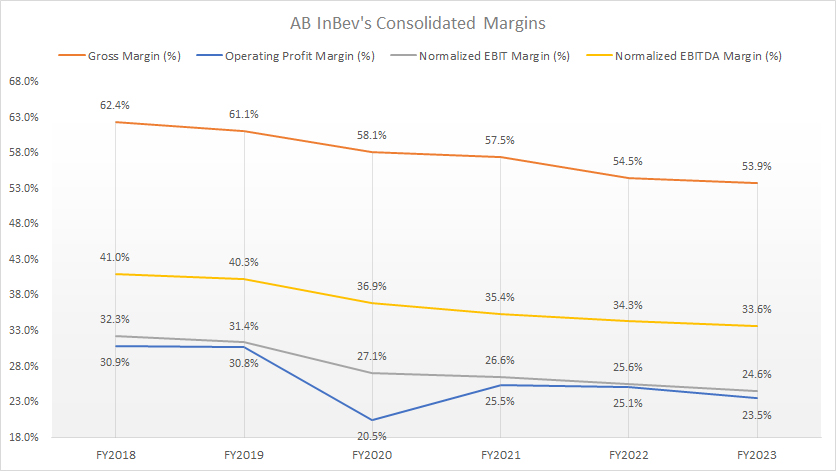
AB InBev experienced a slight decrease in its gross margin, from 54.5% in 2022 to 53.9% in the fiscal year of 2023. Additionally, the company’s operating profit margin saw a decline, falling to 23.5% in 2023 from the previous year.
In terms of non-IFRS margins, normalized EBIT and normalized EBITDA were at 24.6% and 33.6%, respectively, in 2023.
Over the past six years, most margins have significantly decreased. AB InBev’s gross margin has declined by nine percentage points, while the operating profit margin has fallen by eight percentage points during the same period.
Similarly, AB InBev’s normalized EBIT and EBITDA have decreased by seven and eight percentage points since 2016.
Revenue By Region
ABI revenue breakdown by region
(click image to expand)
The definitions of ABI’s regions are available here: North America, Middle Americas, South America, EMEA, and Asia Pacific.
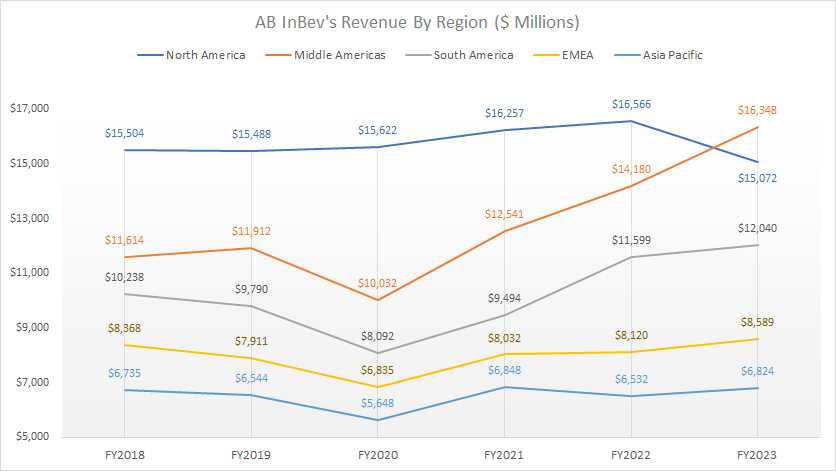
Before 2023, the North American region was responsible for generating the highest revenue for AB InBev. However, in 2023, due to declining sales, it lost its top position to the Middle Americas. In fiscal year 2023, AB InBev’s revenue in North America decreased by 9% to $15.1 billion, while revenue in the Middle Americas increased by 15% to $16.3 billion.
AB InBev’s South America generated $9.5 billion, $11.6 billion, and $12.0 billion in sales in fiscal years 2021, 2022, and 2023, making it the third-largest revenue-generating region.
In the EMEA region, AB InBev earned $8.0 billion, $8.1 billion, and $8.6 billion in regional revenue in fiscal years 2021, 2022, and 2023, respectively.
AB InBev’s Asia Pacific division generated revenue of $6.8 billion, $6.5 billion, and $6.8 billion in fiscal years 2021, 2022, and 2023, respectively.
A significant trend is that AB InBev has experienced increased sales in most regions, including North America, after the COVID-19 pandemic. However, sales in North America saw a sharp decline in 2023.
Revenue Contribution By Region
ABI revenue contribution by region
(click image to expand)
The definitions of ABI’s regions are available here: North America, Middle Americas, South America, EMEA, and Asia Pacific.
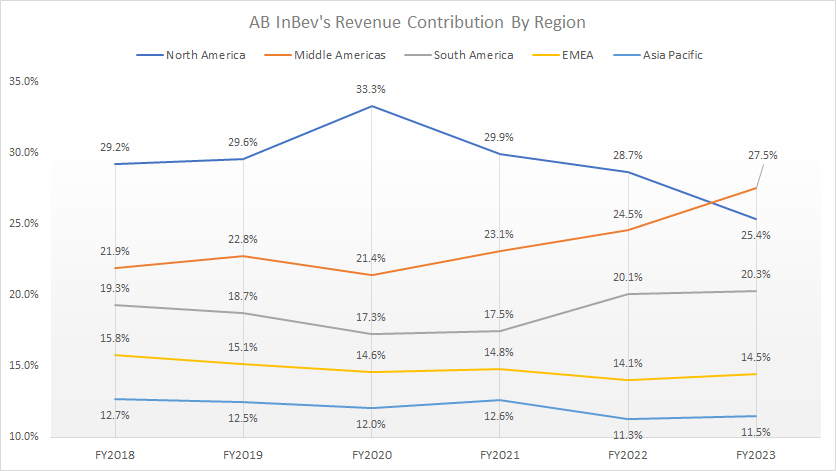
In terms of revenue contribution, AB InBev’s North American region contributed 30% of sales on average to total revenue before 2023, making this region the top revenue-generating segment for the beer maker. However, in 2023, the Middle Americas region surpassed its position as the top revenue earner due to declining sales.
As shown in the chart above, AB InBev’s revenue contribution from North America dropped to 25.4% in 2023, while the Middle Americas rose to 27.5% in the same year.
AB InBev’s revenue contribution from South America and EMEA totaled 20.3% and 14.5%, respectively, as of 2023, making these regions the third- and fourth-highest revenue earners.
AB InBev’s Asia Pacific contributed only 11.5% of sales to total revenue as of 2023, the lowest among all segments under comparison.
A noticeable trend is the significant decrease in revenue contribution from North America in post-COVID periods. The ratio has tumbled from 33.3% in 2020 to 25.4% as of 2023.
Growth Rates Of Revenue By Region
ABI growth rates by region
(click image to expand)
The definitions of ABI’s regions are available here: North America, Middle Americas, South America, EMEA, and Asia Pacific.
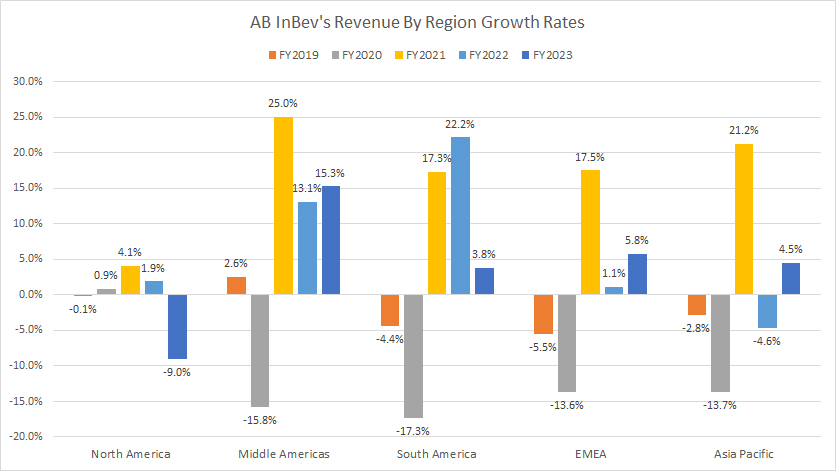
AB InBev’s North America revenue growth averaged -1.0% between 2021 and 2023, while the Middle Americas averaged 17.8% for the same period.
The revenue growth of South America and EMEA regions measured 14.4% and 8.1% on average between 2021 and 2023, while the Asia Pacific reached 8.3% for the same period.
Among all regions, AB InBev’s North America segment has reported the slowest revenue growth between 2021 and 2023.
Gross Profit Contribution By Region
ABI gross profit contribution by region
(click image to expand)
The definitions of ABI’s regions are available here: North America, Middle Americas, South America, EMEA, and Asia Pacific.
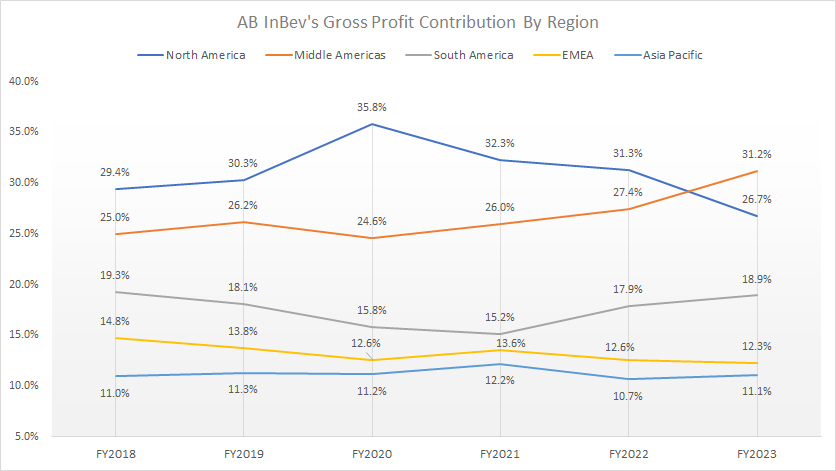
For profitability, AB InBev’s North America used to be a top profit earner. In 2023, its top position was overtaken by the Middle Americas due to declining sales. As seen in the chart above, AB InBev’s gross profit contribution from North America has dropped to 26.7% as of 2023 compared to 31.2% for Middle America.
AB InBev’s South America and EMEA contributed 18.9% and 12.3% of gross profit to the total in fiscal 2023, making them the third- and fourth-highest in terms of profitability.
It is not surprising to see that the Asia Pacific contributes the least profit to the company among all segments because the revenue contribution from this region is the lowest.
Operating Profit Contribution By Region
ABI gross profit contribution by region
(click image to expand)
The definitions of ABI’s regions are available here: North America, Middle Americas, South America, EMEA, and Asia Pacific.
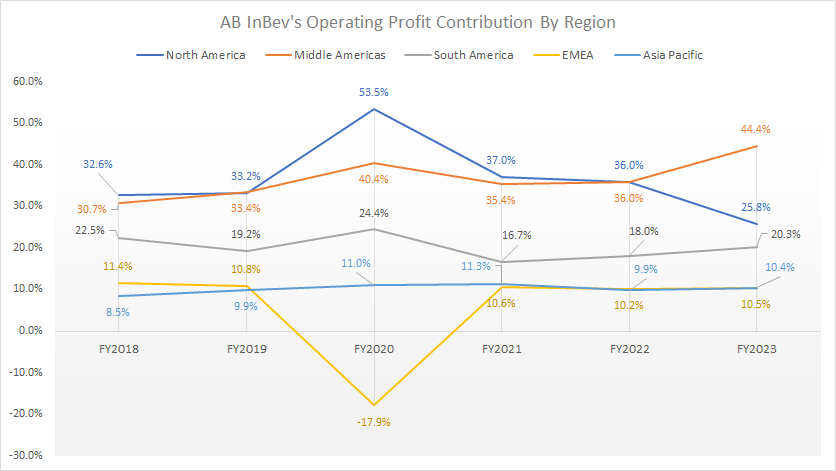
AB InBev’s Middle America operating profit contribution surged to 44.4% as of 2023, far outpacing the 25.8% from North America.
Although the Asia Pacific segment contributes the least revenue and gross profit, its operating profit contribution is comparable with that of the EMEA region.
As seen, the operating profit contribution from the Asia Pacific averaged 10.4% between 2021 and 2023, which was the same as EMEA’s average figure of 10.4%.
Gross Margin By Region
ABI gross margin by region
(click image to expand)
The definitions of ABI’s regions are available here: North America, Middle Americas, South America, EMEA, and Asia Pacific.
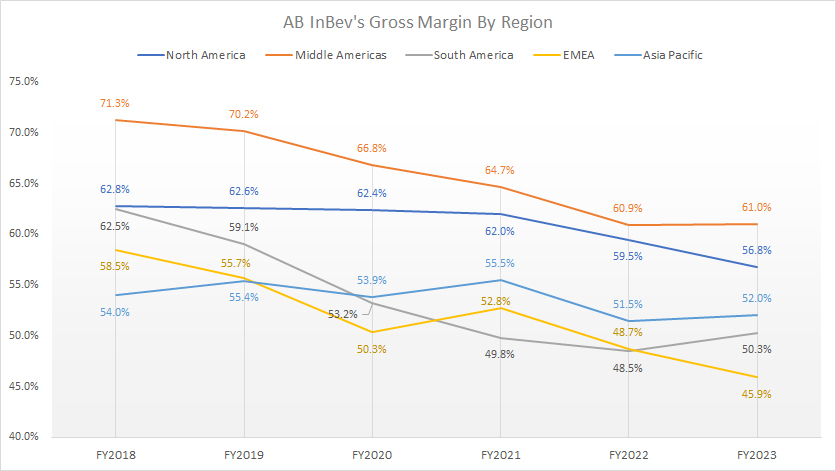
Although ABI’s North America generates some of the highest amounts of revenue and profit, it is not the case when it comes to margin.
As seen in the chart above, AB InBev’s gross margin from the Middle Americas was much better than that of the North America segment. In fiscal 2023, the Middle Americas’ gross margin of 61.0% was significantly higher than North America’s 56.8%.
A surprising trend is that the Asia Pacific segment generates a much better gross margin than South America and EMEA. Between 2021 and 2023, AB InBev’s Asia Pacific segment produced an average gross margin of 53%, while the average figures for South America and EMEA were 49.5% and 49.1%, respectively.
In short, AB InBev’s Middle Americas is the most profitable segment, although it may not produce the highest revenue and profit.
Operating Margin By Region
ab-inbev-operating-profit-margin-by-region
(click image to expand)
The definitions of ABI’s regions are available here: North America, Middle Americas, South America, EMEA, and Asia Pacific.
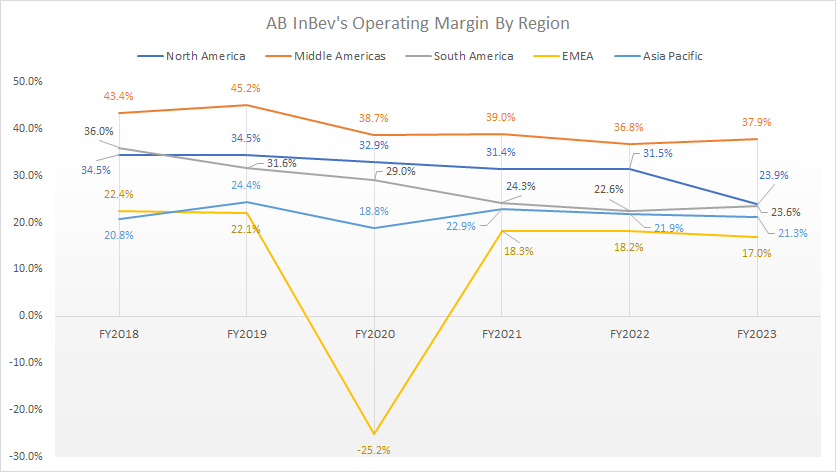
AB InBev’s operating margin in the Middle Americas topped 37.9% as of 2023, making this region the most profitable segment. In fact, the Middle Americas has been ABI’s most profitable segment over the last six years, with the respective operating margins far exceeding the North America segment.
Despite having one of the highest revenue and profit, AB InBev’s North America segment produced an operating margin of 23.9% as of 2023, slightly higher than South America’s 23.6%.
AB InBev’s Asia Pacific region has much better profitability than the EMEA region, with operating margins exceeding 20% in most fiscal years.
AB InBev generates an operating margin of less than 20% in EMEA, making this region the least profitable.
Conclusion
In conclusion, AB InBev’s global revenue has significantly recovered post-COVID, with sales from the Middle Americas surging to a record high in fiscal 2023.
On the other hand, sales from North America tumbled to a new low in fiscal 2023. Meanwhile, revenue in most regions has increased considerably since 2020.
AB InBev’s Middle Americas is the most profitable segment, with the respective gross and operating margins significantly surpassing those of other regions.
Although AB InBev’s consolidated profits have climbed since 2020, margins have gone the other way. For example, the company’s gross and operating margins have reached record lows as of 2023, while the normalized EBIT and normalized EBITDA have also declined.
References and Credits
1. Financial figures in this article were obtained and referenced from AB InBev’s financial statements, earnings releases and reports, which are available in AB InBev Results Center.
2. Pixabay Images
Disclosure
The content in this article is for informational purposes only and is neither a recommendation nor a piece of financial advice to purchase a stock.
If you find the information in this article helpful, please consider sharing it on social media and provide a link back to this article from any website so that more articles like this can be created in the future.
Thank you!

