
Social media apps. Flickr Image.
Facebook (NASDAQ: META), Snapchat (NYSE: SNAP), Twitter, and Pinterest (NYSE: PINS) use the average revenue per user (ARPU) to gauge their business performance. The ARPU metric measures how effectively these platforms monetize their user base.
Each social media platform has its own definition of ARPU, which complicates direct comparisons among Facebook, Snapchat, Twitter, and Pinterest.
Nevertheless, this article aims to compare the ARPUs of Facebook, Pinterest, Twitter, and Snapchat. It attempts to group the platforms with similar ARPU definitions for a more accurate comparison.
You may find related statistic of Meta Platforms, Inc., on these pages:
- Pinterest MAU vs Facebook,
- Snap and Twitter DAU vs Facebook, and
- R&D comparison among Meta, Twitter, Pinterest, and Snapchat.
Let’s take a look!
Please use the table of contents to navigate this page.
Table Of Contents
Definitions And Overview
Global ARPP
O2. Meta Global ARPP
Global ARPU
A1. Facebook Vs Pinterest In Worldwide or Global ARPU
A2. Twitter Vs Snapchat In Worldwide or Global ARPU
North America
B1. Facebook Vs Pinterest In North America ARPU
B2. Twitter Vs Snapchat In North America ARPU
Europe
C1. Europe ARPU
Asia Pacific
Rest Of World
Conclusion And Reference
S1. Conclusion
S2. References and Credits
S3. Disclosure
Definitions
To help readers understand the content better, the following terms and glossaries have been provided.
Meta ARPP: Meta defines the Average Revenue Per Person (ARPP) as its Family Of Apps (FoA) revenue during a given quarter, divided by the average of the number of Daily Active People (DAP) at the beginning and end of the period.
Meta’s daily active people (DAP) is defined as a registered and logged-in user of Facebook, Instagram, Messenger, and/or WhatsApp (collectively, the “Family” of products) who visited at least one of these Family products through a mobile device application or using a web or mobile browser on a given day.
Meta does not require people to use a common identifier or link their accounts to use multiple products in the Family, and therefore must seek to attribute multiple user accounts within and across products to individual people.
The calculations of DAP rely upon complex techniques, algorithms, and machine learning models that seek to estimate the underlying number of unique people using one or more of these products, including by matching user accounts within an individual product and across multiple products when Meta believes they are attributable to a single person, and counting such group of accounts as one person.
Facebook ARPU: Facebook defines its ARPU as total revenue in given geography during a given quarter, divided by the average of the number of MAUs in the geography at the beginning and end of the quarter.
While Facebook’s ARPU includes all sources of revenue, the number of MAUs used in this calculation only includes users of Facebook and Messenger, according to the company’s financial reports.
While the share of revenue from users who are not also Facebook or Messenger MAUs has grown over time, Meta estimates that revenue from users who are Facebook or Messenger MAUs represents the substantial majority of its total revenue.
Difference between ARPU and ARPP: Meta (formerly Facebook) uses two key metrics to measure its financial performance: Average Revenue Per User (ARPU) and Average Revenue Per Person (ARPP).
Here’s the difference between the two:
Average Revenue Per User (ARPU)
- Definition: ARPU measures the average revenue generated per user. It is calculated by dividing the total revenue by the number of active users.
- Usage: This metric is commonly used to assess how well a company is monetizing its user base. It provides insights into the revenue generated from each individual user.
- Application: ARPU is particularly useful for understanding the financial performance of specific platforms or services within Meta, such as Facebook, Instagram, or WhatsApp.
Average Revenue Per Person (ARPP)
- Definition: ARPP measures the average revenue generated per person. It is calculated by dividing the total revenue by the number of people using Meta’s family of apps.
- Usage: This metric provides a broader view of Meta’s monetization efforts across its entire ecosystem of apps. It includes users who may be active on multiple platforms within Meta’s family of apps.
- Application: ARPP is useful for understanding the overall financial performance of Meta as a whole, considering the combined user base of all its platforms.
Key Differences
- Scope: ARPU focuses on individual platforms or services, while ARPP encompasses the entire ecosystem of Meta’s apps.
- Calculation: ARPU is based on active users of a specific platform, whereas ARPP is based on the total number of people using any of Meta’s apps.
- Insight: ARPU provides a more granular view of revenue generation per user on a specific platform, while ARPP offers a holistic view of revenue generation across all platforms.
By using both ARPU and ARPP, Meta can gain a comprehensive understanding of its monetization strategies and financial performance at both the platform-specific and ecosystem-wide levels.
Snap ARPU: Snap defines its ARPU as quarterly revenue divided by the average DAUs.
Snap assesses the health of its business by measuring DAUs and ARPU because it believes that these metrics are important for both management and investors to understand engagement and monitor the performance of our platform.
Pinterest ARPU: Pinterest defines its ARPU as total revenue in a given geography during a period divided by the average of the number of MAUs (Monthly Active Users) in that geography during the period.
Pinterest calculates the average MAUs based on the average number of MAUs measured on the last day of the current period and the last day before the beginning of the current period.
Twitter ARPU: Twitter’s ARPU is defined as the total advertising revenue in a given geography during a period divided by the average monetizable Daily Active Usage or Users (mDAU).
Twitter defines its mDAU as people, organizations, or other accounts who logged in or were otherwise authenticated and accessed Twitter on any given day through twitter.com, Twitter applications that are able to show ads, or paid Twitter products, including subscriptions, according to the 2021 annual report.
Twitter’s average mDAU for a period represents the number of mDAU on each day of such period divided by the number of days for such period.
Meta Global ARPP
Meta-worldwide-average-revenue-per-person-ARPP
(click image to expand)
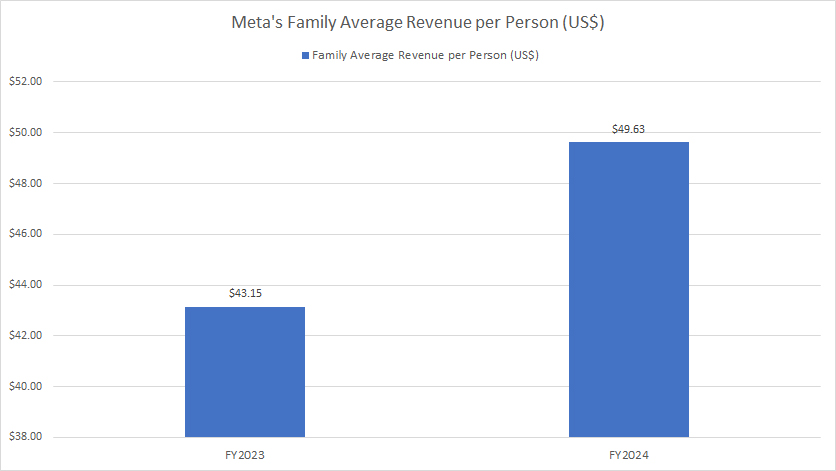
Meta replaced the ARPU with the ARPP starting in fiscal year 2024. You can find the definitions of Meta’s ARPP here: Meta ARPP. The difference between ARPU and ARPP is explained here: ARPU vs ARPP.
Meta reported that its Average Revenue per Person (ARPP) reached nearly $50.00 in fiscal year 2024, marking a significant increase of 15% from the $43.15 ARPP recorded in fiscal year 2023. This impressive growth reflects Meta’s successful strategies in monetizing its user base across its family of apps.
The 15% rise in ARPP indicates Meta’s ability to generate higher revenue from each person using its platforms, driven by factors such as enhanced advertising capabilities, increased user engagement, and the introduction of new revenue streams. Meta’s continuous investment in innovative technologies and targeted advertising has likely contributed to this substantial growth in ARPP.
This upward trend in ARPP also highlights Meta’s effectiveness in leveraging its vast user base to drive revenue growth. By optimizing its platforms to deliver personalized and relevant content, Meta has managed to enhance the overall user experience and increase the value derived from each user.
As Meta continues to expand its ecosystem and introduce new features and services, the potential for further ARPP growth remains promising. The company’s commitment to innovation and user-centric strategies positions it well for sustained financial performance and long-term success.
Facebook Vs Pinterest In Worldwide or Global Average Revenue Per User
Facebook vs Pinterest in worldwide/global ARPU
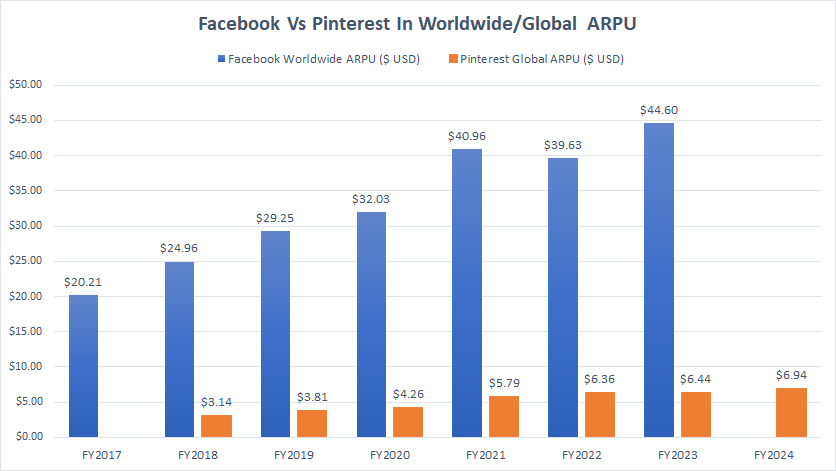
The graph above compares the ARPU of Facebook and Pinterest due to their similar ARPU definitions. You can find the ARPU definitions of Facebook and Pinterest here: Facebook ARPU and Pinterest ARPU.
Meta has replaced ARPU with ARPP as its primary performance metric. Find Meta’s ARPP results here: Meta’s ARPP.
At first look, Facebook’s worldwide ARPU exceeds Pinterest’s by approximately seven times. Since fiscal 2017, Facebook’s ARPU has risen by 120%, from $20.21 in 2017 to $44.60 as of 2023. On the other hand, Pinterest’s global ARPU has climbed 105% from $3.14 in 2018 to $6.44 in 2023.
In fiscal year 2024, Pinterest’s ARPU topped $6.94, marking an increase of 8% from the $6.44 reported in fiscal year 2023.
Compared to Pinterest, Facebook is a more mature social media platform with a broader range of monetization channels. Moreover, Facebook’s user base is much larger than Pinterest’s. That probably explains Facebook’s relatively higher ARPU.
Twitter Vs Snapchat In Worldwide or Global Average Revenue Per User
Twitter vs Snapchat in worldwide/global ARPU
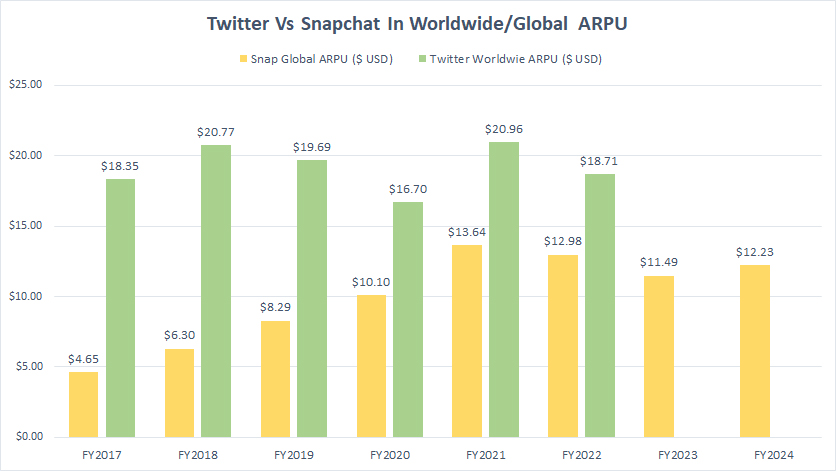
The graph above compares the ARPU of Snap and Twitter to their similar ARPU definitions. You can find the ARPU definitions of Snap and Twitter here: Snap ARPU and Twitter ARPU.
Twitter achieved a much higher global ARPU than Snap’s. A noticeable trend is that Twitter produces consistent average revenue per user in most fiscal years. Between 2020 and 2022, Twitter’s worldwide ARPU averaged $18.79, while Snap’s figure came to $12.24 during the same period.
In fiscal year 2024, Snapchat reported a global ARPU of $12.23, which represented a 6% increase from the $11.49 reported in fiscal year 2023. This upward trend indicates Snapchat’s ability to generate more revenue per user, reflecting improvements in its monetization strategies and user engagement.
However, despite this positive growth, Snapchat’s ARPU in 2024 was still 10% lower compared to its peak ARPU of $13.64 achieved in fiscal year 2021. This decline from the peak suggests that Snapchat has faced challenges in maintaining its highest levels of revenue per user.
Several factors could contribute to this, including increased competition in the social media landscape, changes in user behavior, or shifts in advertising spending patterns.
Meanwhile, Twitter’s worldwide ARPU of $18.71 in 2022 was 10% lower than the 2021 result.
Facebook Vs Pinterest In North America Average Revenue Per User
Facebook vs Pinterest in North America ARPU
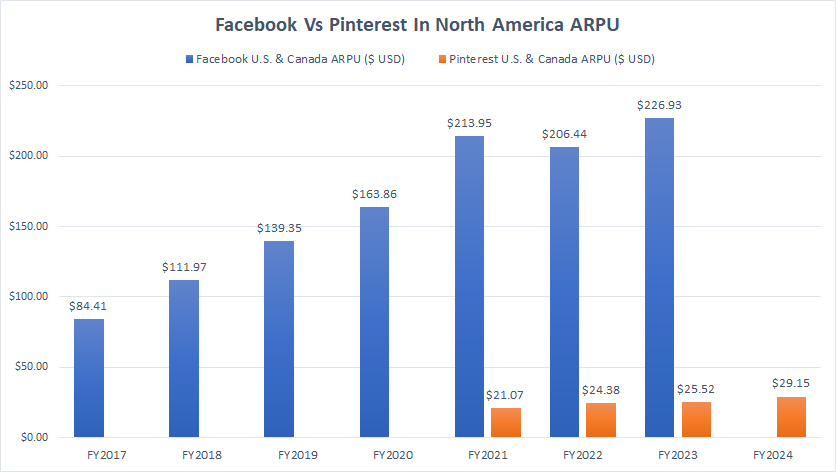
The graph above compares the ARPU of Facebook and Pinterest due to their similar ARPU definitions. You can find the ARPU definitions of Facebook and Pinterest here: Facebook ARPU and Pinterest ARPU.
Meta has replaced ARPU with ARPP as its primary performance metric. Find Meta’s ARPP results here: Meta’s ARPP.
Facebook’s U.S. and Canada ARPU averaged $215.77 between 2021 and 2023, while Pinterest’s figure landed at $23.66 for the same period. Facebook’s U.S. and Canada ARPU is roughly nine times higher than Pinterest’s figure.
In fiscal 2023, Facebook earned $226.93 in average revenue per user in North America. On the other hand, in fiscal year 2024, Pinterest made only $29.15 in average revenue per user in the North American region, an increase of an impressive 14% from 2023.
A noticeable trend over the past three years is the substantial increase in ARPU for both Facebook and Pinterest. For instance, Facebook’s ARPU in the U.S. and Canada has grown by 6% from 2021 to 2023. This steady increase indicates Facebook’s ability to consistently enhance its monetization strategies and effectively capitalize on its user base in these key markets.
In comparison, Pinterest has demonstrated an even more impressive growth trajectory. Its ARPU in the U.S. and Canada surged by 38% from 2021 to 2024. This significant rise over the four-year period underscores Pinterest’s rapid advancements in user engagement and advertising capabilities. The platform’s innovative features, targeted marketing strategies, and focus on personalized content have likely contributed to this remarkable growth.
The considerable increase in ARPU for both platforms highlights their success in leveraging user data and optimizing ad placements to drive higher revenue per user. As social media platforms continue to evolve and introduce new monetization opportunities, ARPU is expected to remain a critical metric for measuring financial performance.
Twitter Vs Snapchat In North America Average Revenue Per User
Snapchat vs Twitter in North America ARPU
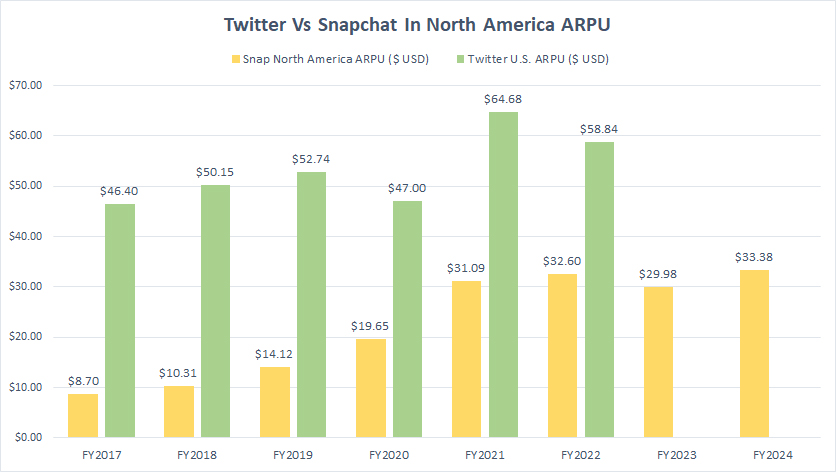
The graph above compares the ARPU of Snap and Twitter due to their similar ARPU definitions. You can find the ARPU definitions of Snap and Twitter here: Snap ARPU and Twitter ARPU.
Twitter’s ARPU in the U.S. significantly outpaces Snapchat’s results in North America. Between 2020 and 2022, Twitter earned an impressive $56.84 in average revenue per user in the U.S. By contrast, Snapchat’s ARPU in North America was $31.22 between 2021 and 2023. This means that Twitter’s ARPU in the U.S. is nearly double that of Snapchat’s in North America, highlighting Twitter’s stronger monetization capabilities in its primary market.
In fiscal year 2024, Snapchat achieved an ARPU of $33.38 for the North America region, reflecting an approximate 11% increase from its 2023 result. This growth indicates Snapchat’s ongoing efforts to enhance its revenue per user, possibly through improved ad targeting, new features, and increased user engagement.
While Twitter’s ARPU remains considerably higher, Snapchat’s recent gains in ARPU suggest a positive trend and potential for further growth. Both platforms continue to innovate and adapt their monetization strategies to maximize revenue from their user bases, making ARPU a critical metric for evaluating their financial performance and competitive positioning.
Europe Average Revenue Per User
Europe ARPU
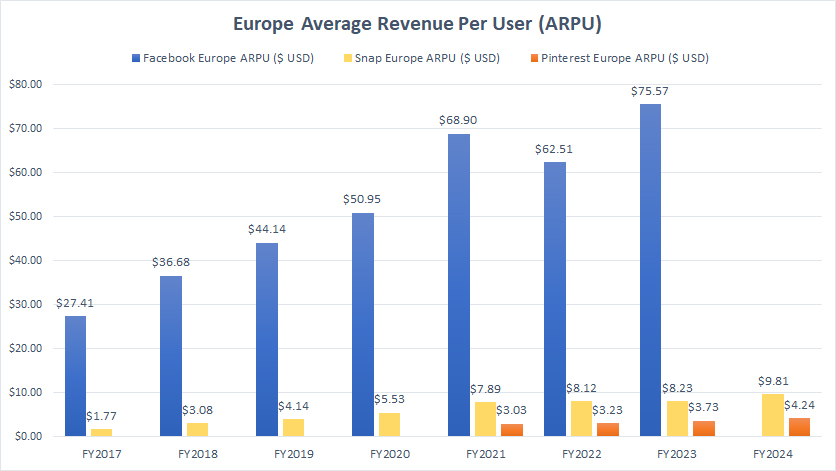
Facebook, Pinterest and Snap’s Europe ARPU numbers may not be comparable on an apple-to-apple basis due to the difference in ARPU definitions. You can find the ARPU definitions of Facebook, Pinterest, and Snap here: Facebook ARPU, Pinterest ARPU, and Snap ARPU.
Meta has replaced ARPU with ARPP as its primary performance metric. Find Meta’s ARPP results here: Meta’s ARPP.
Facebook generates a significantly higher average revenue per user (ARPU) in Europe than Pinterest and Snapchat. In fiscal 2023, Facebook’s Europe ARPU landed at a record figure of $75.57, up 21% over 2022. Between 2021 and 2023, Facebook’s average revenue per user in Europe totaled $69.00.
On the other hand, from fiscal year 2022 to 2024, Snap’s and Pinterest’s ARPUs in Europe were much lower, averaging only $8.72 and $3.33, respectively.
In fiscal year 2024, Snapchat generated an average revenue of $9.81 per user in Europe, while Pinterest earned $4.24 per user. Both social media platforms saw significant growth in revenue per user in 2024 compared to 2023, notably at 19% and 14%, respectively.
Twitter does not break down its ARPU in Europe.
A noticeabletrend is that Europe is the second-most lucrative region after North America for most social media platforms.
Asia Pacific Average Revenue Per User
Asia Pacific ARPU
Meta has replaced ARPU with ARPP as its primary performance metric. Find Meta’s ARPP results here: Meta’s ARPP.
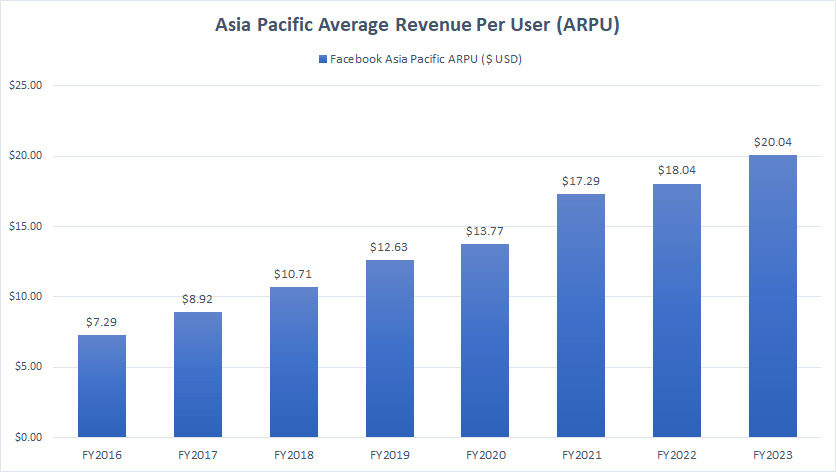
Facebook’s average revenue per user (ARPU) in the Asia Pacific region reached a record high of $20.04 in fiscal 2023, marking a 10% increase from $18.22 in 2022. This impressive growth reflects Facebook’s continued efforts to enhance monetization strategies in one of its largest user bases.
Since 2016, Facebook’s ARPU in the Asia Pacific has seen significant growth. Back in fiscal 2016, the ARPU was only $7.29. This figure has nearly tripled by 2023, illustrating the company’s success in increasing revenue from users in this region.
Despite this substantial improvement, Facebook’s ARPU in the Asia Pacific remains relatively low compared to other regions. It is only a quarter of the ARPU in Europe and a tenth of the ARPU in North America. This disparity highlights that, while the Asia Pacific is one of Facebook’s largest markets, it is also one of the least monetized. Similar trends can likely be observed for other social media platforms like Snapchat and Pinterest.
Given the large and growing population in the Asia Pacific, coupled with the relatively low ARPU, there is significant potential for Facebook to further increase its revenue per user in this region. By continuing to invest in tailored advertising solutions, localized content, and innovative features, Facebook can capitalize on this opportunity to drive future growth.
As the digital landscape evolves, the Asia Pacific region presents a promising avenue for Facebook and other social media platforms to enhance their monetization efforts and achieve higher ARPU. The ongoing focus on market-specific strategies and engagement initiatives will be key to unlocking this potential.
Rest Of World Average Revenue Per User
rest-of-world ARPU
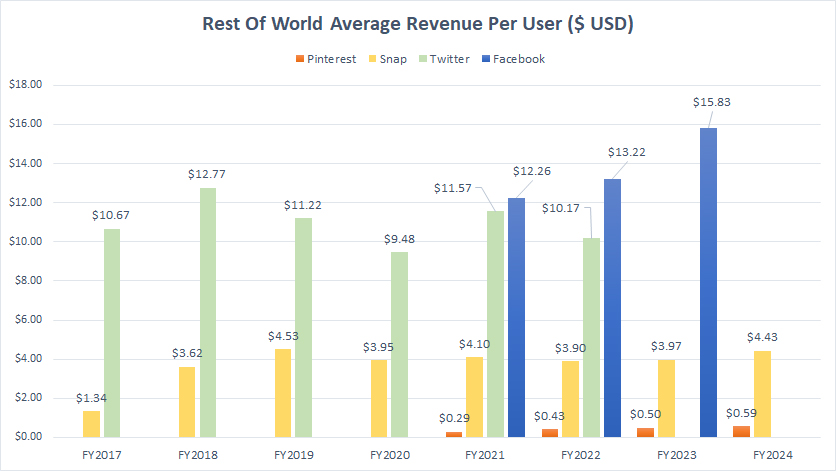
Facebook, Pinterest, Twitter, and Snap’s Rest Of World ARPU numbers may not be comparable on an apple-to-apple basis due to the difference in ARPU definitions. You can find the ARPU definitions of Facebook, Pinterest, Twitter, and Snap here: Facebook ARPU, Pinterest ARPU, Twitter ARPU, and Snap ARPU.
Meta has replaced ARPU with ARPP as its primary performance metric. Find Meta’s ARPP results here: Meta’s ARPP.
For Rest Of World, Facebook topped the chart at $15.83 in ARPU in fiscal year 2023, the highest among all social media platforms in comparison, despite having Europe and the Asia Pacific regions excluded in ARPU measurement.
Twitter’s Rest Of World ARPU topped $10.17 in 2022, the second highest after Facebook. Snap earned $4.43 in average revenue per user in Rest Of World, while Pinterest’s latest result reached $0.59.
Pinterest’s Rest Of World ARPU is significantly lower than the results of other social media platforms. On the other hand, Facebook’s ARPU in Rest Of World has risen by nearly 30% in three years.
Conclusion
North America, particularly the United States, is the most profitable market for Facebook, Pinterest, Twitter, and Snap. The average revenue per user (ARPU) in this region is the highest despite the online advertising market in North America being large and mature. The social media companies are experiencing incredible revenue growth in this region.
Europe is the second most lucrative market for Facebook, Pinterest, and Snapchat, contributing the second highest ARPU to these companies.
Facebook has the lowest ARPU in the Asia Pacific compared to other regions and countries. Despite the size of the population in the Asia Pacific, it is still under-explored and untapped by most social media companies like Facebook, Snap, Twitter, and Pinterest.
Although Facebook has the largest ARPU figures, smaller players like Snap and Pinterest are experiencing significant growth in ARPU numbers in all regions of the world.
References and Credits
1. Financial figures for all companies discussed above were obtained and referenced from their respective financial statements, which can be obtained from the following links:
a) Facebook Investor Relations
b) Snap Investor Relations
c) Pinterest Investor Relations
d) Twitter Investor Relations
2. Flickr Images.
Disclosure
We may use the assistance of artificial intelligence (AI) tools to produce some of the text in this article. However, the data is directly obtained from original sources and meticulously cross-checked by our editors multiple times to ensure its accuracy and reliability.
If you find the information in this article helpful, please consider sharing it on social media. Additionally, providing a link back to this article from any website can help us create more content like this in the future.
Thank you for your support and engagement! Your involvement helps us continue to provide high-quality, reliable content.

It is remarkable that these mega platforms can continue to grow at very healthy rates. I created a new platform, dedicated to helping people settle a difference of opinion in a fun, entertaining and safe environment. I’m very excited to see that the market is still growing, and there is room for competition, or in my case niche platforms offering something new.