AI. Pexels Image.
Nvidia’s inventory typically refers to the range of products and components the company holds in stock for sale and production.
This can include a variety of items such as graphics processing units (GPUs), system on a chip units (SoCs) for the mobile computing and automotive market, and other related products and services aimed at the gaming, professional visualization, data center, and automotive markets.
Nvidia’s inventory is crucial for meeting consumer demand and ensuring timely delivery of products to various market segments. Inventory management is essential for Nvidia to balance supply and demand, minimize holding costs, and maintain efficient production and distribution operations.
This article delves into the statistics of Nvidia’s inventory, which include the total inventory numbers, inventory by components, inventory turnover ratio, and days of inventory, as well as ratios to revenue and current assets.
Let’s look at the numbers!
Investors interested in Nvidia’s revenue by market and product segment may find more resources on this page: Nvidia revenue by market and product segment.
Please use the table of contents to navigate this page.
Table Of Contents
Definitions And Overview
- Inventory To Current Assets Ratio
- Inventory To Revenue Ratio
- Inventory Turnover Ratio
- Inventory Days
- Raw Materials
- Work In Process
- Finished Goods
O2. How Does Nvidia Manage Its Inventory?
O3. What Makes Up Nvidia’s Inventory?
Consolidated Inventory
A1. Total Inventory
A2. Inventory YoY Growth Rates
Breakdown Of Inventory
B1. Inventory By Components
B2. Inventory By Components In Percentage
Total Inventory To Assets And Revenue Ratios
C1. Inventory To Current Assets Ratio
C2. Inventory To Revenue Ratio
Inventory Turnover And Days Ratios
D1. Inventory Turnover Ratio
D2. Days Of Inventory
Finished Goods Inventory Turnover And Days Ratios
E1. Finished Goods Inventory Turnover Ratio
E2. Finished Goods Days Of Inventory
Summary And Reference
S1. Summary
S2. References and Credits
S3. Disclosure
Definitions
To help readers understand the content better, the following terms and glossaries have been provided.
Inventory To Current Assets Ratio: The inventory to current asset ratio is a financial metric that compares a company’s inventory to its current assets. This ratio is calculated by dividing the inventory value by the total value of current assets. The formula looks like this:
Inventory to Current Asset Ratio = {Inventory} / {Current Assets}
This ratio provides insights into how much of a company’s current assets are tied up in inventory. It’s an important measure for understanding liquidity and operational efficiency.
A higher ratio may indicate that a significant portion of the company’s resources is invested in inventory, which might suggest issues with inventory management or sales.
Conversely, a lower ratio suggests that the company has a diversified range of current assets, potentially indicating better liquidity and less risk of inventory obsolescence. This ratio is particularly relevant in industries where inventory management is crucial, such as retail, manufacturing, and distribution.
Inventory To Revenue Ratio: The inventory-to-revenue ratio is a financial metric used to evaluate how efficiently a company manages its inventory relative to its sales. It is calculated by dividing the ending inventory balance by the total revenue for the same period. The formula looks like this:
Inventory to Revenue Ratio = {Inventory} / {Revenue}
This ratio helps to understand the proportion of a company’s inventory compared to its revenue. A lower ratio is generally preferred as it indicates that the company is efficiently converting its inventory into sales.
Conversely, a higher ratio may suggest overstocking or inefficiencies in managing inventory, potentially leading to higher holding costs or obsolescence risks. It’s an important indicator for businesses to monitor, especially those in the retail or manufacturing sectors, as it can significantly impact their cash flow and profitability.
Inventory Turnover Ratio: The inventory turnover ratio is a financial metric measuring how often a company’s inventory is sold and replaced over a specific period, typically a year. It is calculated by dividing the cost of goods sold (COGS) by the average inventory.
This ratio helps businesses understand how efficiently they manage their inventory, indicating whether they effectively sell their stock without overstocking or understocking.
A higher inventory turnover ratio implies that a company is selling its inventory quickly and is generally seen as positive, indicating strong sales or effective inventory management. Conversely, a low turnover ratio could suggest weak sales or excessive inventory levels.
Inventory Days: Inventory days, also known as days inventory outstanding (DIO), is a financial metric that measures the average number of days a company takes to sell its entire inventory over a specific period, typically a year.
It reflects how efficiently a company manages its inventory, indicating how quickly it can convert its inventory into sales. A lower number of inventory days suggests that a company is more efficient at selling its inventory, while a higher number suggests slower sales.
To calculate inventory days, you divide the ending inventory by the cost of goods sold (COGS) for the period, then multiply the result by the number of days in the period.
Raw Materials: Raw materials in inventory refer to the basic substances or components used in manufacturing to produce finished goods. These materials are still in their natural, unprocessed, or minimally processed state, awaiting to be transformed through production operations.
They are essential assets that companies hold as part of their inventory. They play a critical role in the production cycle, acting as the foundational elements from which all other products are made. Examples of raw materials can include metals, plastics, fabrics, wood, and crude oil. Recognizing and managing these materials efficiently is crucial for maintaining a cost-effective and smooth manufacturing process.
Work In Procress: Work-in-process (WIP) inventory refers to the materials and items being manufactured but not yet completed products. It includes all the costs incurred during the manufacturing process, such as raw materials, labor, and overhead costs, up to that point in the production process.
WIP is considered an asset on a company’s balance sheet and is a critical part of the inventory for manufacturing and construction companies, as it provides insight into production efficiency, operational flow, and the potential value of unfinished goods. Proper management of WIP inventory is essential for accurate financial reporting and effective supply chain management.
Finished Goods: Finished Goods Inventory refers to the stock of completed products that are ready for sale but have not yet been sold. These products have undergone the entire production process, from raw materials to final goods, and are waiting to be distributed to retailers or consumers.
This type of inventory is a crucial component of a manufacturing company’s assets, reflecting both the value of the labor and materials invested in the products. Monitoring and managing finished goods inventory effectively is essential for meeting customer demand, optimizing sales, and maintaining efficient production cycles.
How Does Nvidia Manage Its Inventory?
Like many technology companies, Nvidia employs a strategic process to manage its inventory. This process involves several key components to ensure the supply chain operates efficiently, aligns with market demand, and minimizes costs. Here are several strategies Nvidia might use to manage its inventory effectively:
1. **Demand Forecasting**: Nvidia likely utilizes advanced analytics and machine learning algorithms to predict future product demand. Accurate demand forecasting helps the company maintain an optimal inventory level, preventing overstocking and stockouts.
2. **Just-In-Time (JIT) Inventory Management**: This approach involves keeping inventory levels as low as possible and ordering parts only when they are needed for production. JIT helps reduce inventory holding costs and can improve cash flow. However, it requires a highly reliable supply chain.
3. **Supplier Relationship Management**: Building strong relationships with suppliers is crucial for Nvidia to ensure a reliable flow of materials. This may involve long-term contracts, collaboration on inventory planning, and even supporting suppliers to meet Nvidia’s quality and delivery expectations.
4. **Use of Technology and Automation**: Nvidia likely leverages sophisticated inventory management systems (IMS) and Enterprise Resource Planning (ERP) systems. These technologies provide real-time inventory level data, track supply chain supplies, and automate ordering processes. Automation in warehouses for sorting and storing inventory can also enhance efficiency.
5. **Segmentation**: Nvidia might segment its inventory based on various factors like product value, demand variability, and sales volume. This allows for more tailored inventory strategies for different product categories, optimizing overall inventory management.
6. **Safety Stock Management**: Even with accurate demand forecasting, unforeseen events can disrupt supply chains. Maintaining a certain safety stock level for critical components can help buffer against such disruptions.
7. **Continuous Improvement**: Nvidia likely employs a culture of constant evaluation and improvement of inventory processes, adopting lean manufacturing principles and other methodologies to reduce waste and improve efficiency.
These strategies, combined with Nvidia’s insights into the tech industry and its market dynamics, support its ability to manage inventory levels effectively, ensuring it can meet customer demand without incurring unnecessary costs.
What Makes Up Nvidia’s Inventory?
Nvidia Inventory Components ($ Millions)
| Fiscal Years | |||||||
|---|---|---|---|---|---|---|---|
| FY2025 1Q | FY2024 | FY2023 | FY2022 | FY2021 | FY2020 | FY2019 | |
| Raw Materials | $1,991 | $1,719 | $2,430 | $791 | $632 | $249 | $613 |
| Work In Process | $1,625 | $1,505 | $466 | $692 | $457 | $265 | $238 |
| Finished Goods | $2,248 | $2,058 | $2,263 | $1,122 | $737 | $465 | $724 |
Nvidia’s inventory consists of the following components:
- 1. Raw Materials
- 2. Work In Process
- 3. Finished Goods
Raw materials: Nvidia’s raw material inventory primarily consists of the components and parts essential for producing their products, including graphics processing units (GPUs), system-on-a-chip units (SoCs), and other semiconductor-related components. This inventory can include:
1. **Silicon Wafers**: The foundational material used in semiconductor devices. They are the substrates from which individual semiconductor chips or integrated circuits are fabricated.
2. **Memory Chips**: These are critical for GPU and other product functionalities, including GDDR6 (or newer versions) for graphics cards and DRAM for various computing products.
3. **Electronic Components**: Such as resistors, capacitors, and inductors essential for circuit designs.
4. **PCBs (Printed Circuit Boards)**:** The boards to which the semiconductor chips and other components are mounted.
5. **Connectors and Sockets**: For interfacing the semiconductor devices with other system components.
6. **Cooling Solutions**: Including fans, heat sinks, and liquid cooling systems essential for maintaining optimal operating temperatures for high-performance computing products.
7. **Packaging Materials**: Used for the final packaging of chips, GPUs, and other components. This can include the materials for the encapsulation of semiconductor chips.
According to Nvidia’s FY2024 annual report, while it may directly procure certain raw materials used in the production of its products, such as memory, substrates, and a variety of components, its suppliers are responsible for procurement of most raw materials used in the production of its products.
As a result, Nvidia can focus its resources on product design, quality assurance, marketing, and customer support. In periods of growth, it may place non-cancellable inventory orders for certain product components in advance of historical lead times, pay premiums, or provide deposits to secure future supply and capacity and may need to continue to do so.
Finished products: Nvidia’s finished goods inventory comprises primarily GPU (graphics processing unit) products ready for sale, including those designed for gaming, professional visualization, data centres, and automotive applications.
This would also encompass chips or cards tailored explicitly for artificial intelligence (AI), deep learning, and high-performance computing tasks.
Along with GPUs, finished goods might include Nvidia’s system-on-a-chip units (such as those found in automotive applications and mobile computing), networking hardware from its acquisition of Mellanox Technologies, and any associated software or bundled services that are sold as a complete product.
These items have completed the manufacturing process and are ready to be shipped to retailers, distributors, or directly to customers upon sale.
Supply Chain: Nvidia’s supply chain is concentrated in the Asia-Pacific region. It utilizes foundries, such as Taiwan Semiconductor Manufacturing Company Limited, or TSMC, and Samsung Electronics Co., Ltd., or Samsung, to produce its semiconductor wafers.
In addition, Nvidia purchases memory from Micron Technology, Inc., SK Hynix Inc., and Samsung. It utilizes CoWoS technology for semiconductor packaging.
Nvidia engages with independent subcontractors and contract manufacturers such as Hon Hai Precision Industry Co., Ltd., Wistron Corporation, and Fabrinet to perform assembly, testing and packaging of its final products.
Total Inventory
Nvidia-total-inventory
(click image to expand)
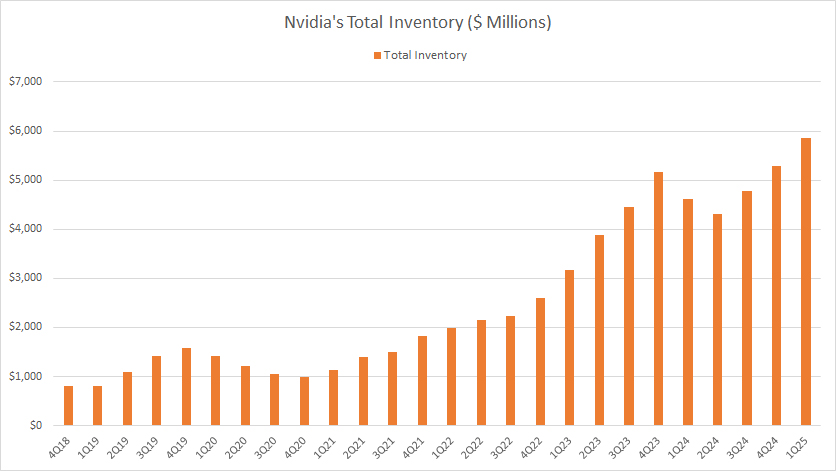
Nvidia’s total inventory reached nearly $6 billion as of 1Q 2025, an all-time high and up by more than $1 billion from a year ago or over $2 billion from 1Q 2023.
Since FY2018, Nvidia’s inventory has risen by over 500%. The significant rise in Nvidia’s inventory underscores the increasing demand for the company’s flagship products which comprise mostly graphic processing units (GPUs).
Inventory YoY Growth Rates
Nvidia-yoy-growth-rates-of-total-inventory
(click image to expand)
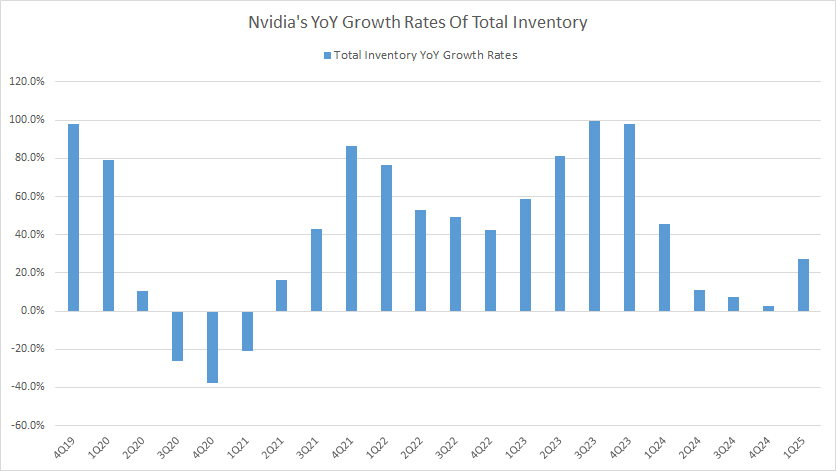
The growth rate chart above illustrates that Nvidia’s inventory levels have registered mostly positive growth. As seen, Nvidia’s inventory levels have hardly decreased, except in the earlier fiscal years between FY2020 and FY2021 when the COVID-19 pandemic just started.
In post-pandemic time, Nvidia’s inventory has grown even more, highlighting the significant rise in demand for the chipmaker’s GPUs during post-COVID periods.
On average, Nvidia’s inventory has grown by 19% year-over-year in each quarter since fiscal 1Q 2024.
Inventory By Components
Nvidia-inventory-by-components
(click image to expand)
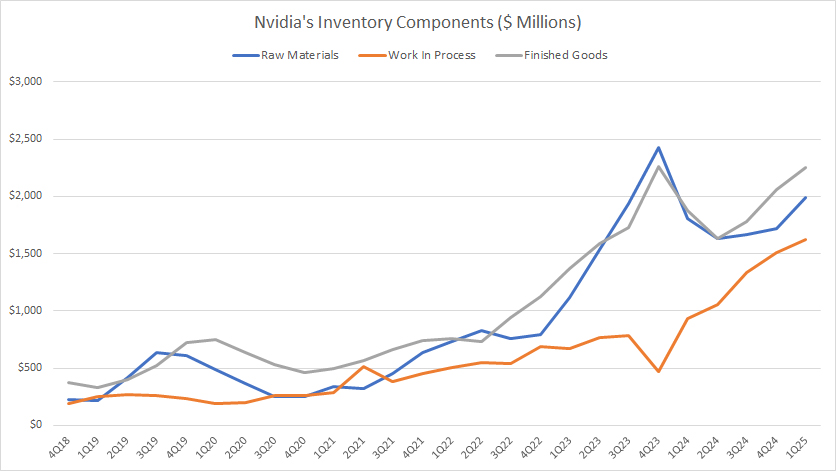
Nvidia’s total inventories are broken down into three components: (1) finished products and (2) work in process, and (3) finished goods. The definitions of Nvidia’s inventory components are available here: raw materials, work-in-process, and finished-goods.
Nvidia’s finished goods have historically been making up the majority of its total inventory in most periods, as seen in the chart above. This trend also has been true recently.
On the other hand, Nvidia’s raw materials inventory is trailing slightly below the finished goods, while the work-in-process inventory sits significantly below the two inventory components.
Inventory By Components In Percentage
Nvidia-inventory-by-components-in-percentage
(click image to expand)
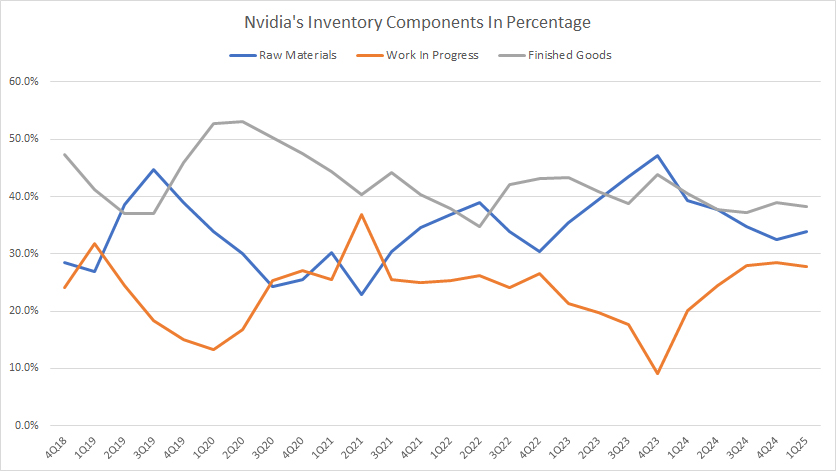
The definitions of Nvidia’s inventory components are available here: raw materials, work-in-process, and finished-goods.
Percentage-wise, Nvidia’s raw material and finished goods inventories have historically comprised nearly the same levels, totaling close to 40% each.
On the other hand, Nvidia’s work-in-process inventory has sat at 20%+ on average, making this compoenent the smallest among the three.
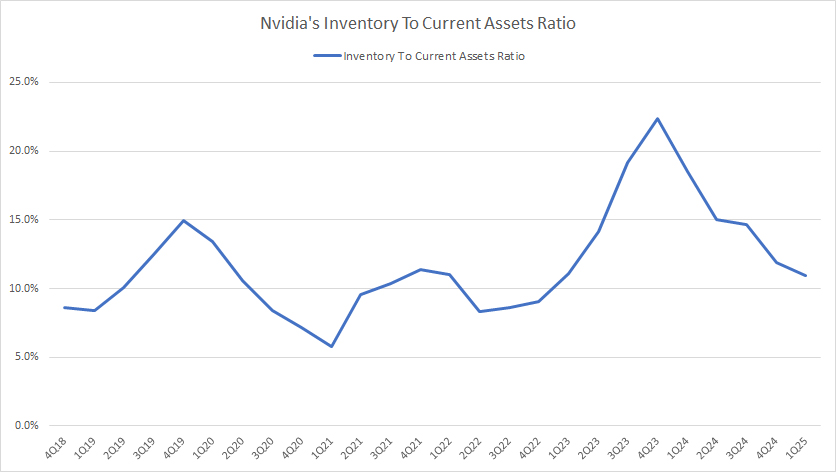
Inventory To Current Assets Ratio
Nvidia-inventory-to-current-assets-ratio
(click image to expand)
The definition of inventory to current assets ratio is available here: inventory to current assets ratio.
Although Nvidia’s inventory levels have been increasing, its ratio to curren assets has remained relatively constant, as depicted in the chart above.
On average, Nvidia’s inventory to current assets ratio has remained at 14% in the five most recent quarters since fiscal 1Q 2024, a relatively low ratio. The low ratio implies that Nvidia carries very little inventory as working capital within its current assets.
In addition, Nvidia’s consistent ratio to current assets suggests that its current assets also have been increasing, usually a positive sign which indicates expansion and growth of a company.
In other words, Nvidia’s expanding inventory is a positive indicator of growth and expansion rather than an inventory glut, as given by the consistent inventory to current assets ratio.
Inventory To Revenue Ratio
Nvidia-inventory-to-revenue-ratio
(click image to expand)
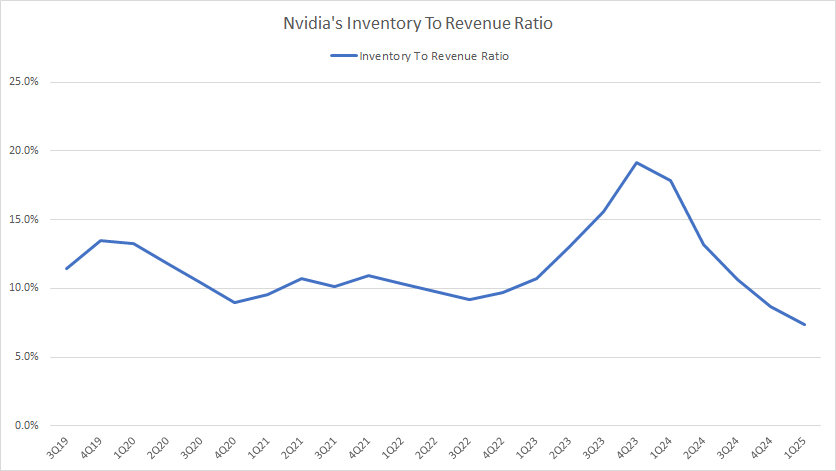
The definition of inventory to revenue ratio is available here: inventory to revenue ratio.
The inventory to revenue ratio is another ratio measuring if there is an issue or problem with a company’s rising inventory.
Again, the chart above shows that Nvidia’s ratio of inventory to revenue has remained relatively constant throughout most periods despite having an increasing inventory level.
On average, the ratio of Nvidia’s inventory to revenue has amounted to just 11.5% in the five most recent quarters since fiscal 1Q 2024, roughly the same as its historical levels.
Nvidia’s consistent ratio of inventory to revenue in most periods implies that its revenue has risen at roughly the same rate as its inventory, if not faster than it.
Again, the ratio of Nvidia’s inventory to revenue has confirmed that the chipmaker’s expanding inventory is a positive sign of growth and expansion rather than an inventory problem.
Inventory Turnover Ratio
Nvidia-inventory-turnover-ratio
(click image to expand)
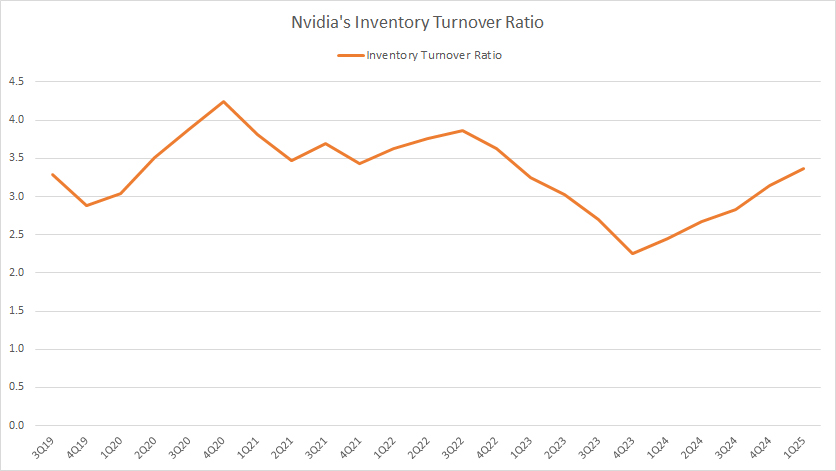
The inventory turnover ratio formula is shown below:
Inventory Turnover Ratio = Cost of Sales / Closing Inventory
The definition of inventory turnover ratio is available here: inventory turnover ratio.
Nvidia has relatively long lead time for its inventory as the inventory turnover ratio has averaged just 3.0X in the five most recent quarters since fiscal 1Q 2024. Nvidia’s long lead time is probably the norm in the semiconductor industry as chipmaking, which goes from raw materials to finished goods, is a complex and long process.
The good news is that this lead time has remained relatively unchanged throughout most periods shown in the chart. You may see some deviations from the average ratio of 3.0X but they have quickly normalized to the average figure, reflecting the company’s swift and flexible adjustment in managing its inventory.
Days Sales In Inventory
Nvidia-inventory-days
(click image to expand)
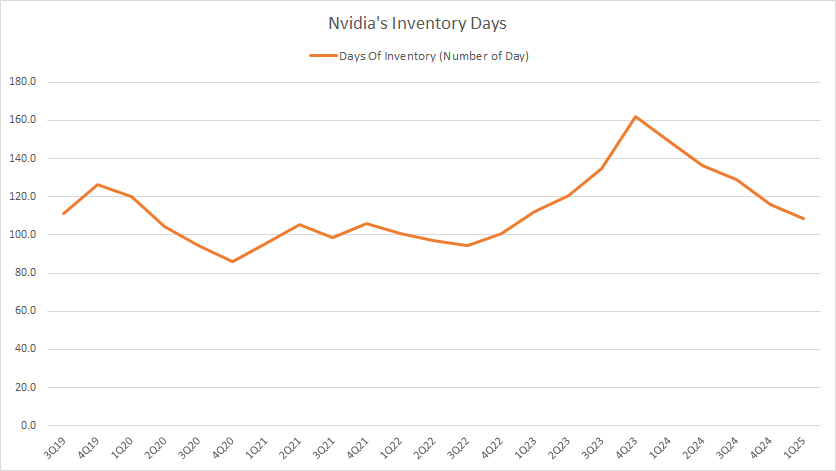
The days of sales in inventory are similar to the inventory turnover ratio except that it is in numbers of days. The definition of inventory days ratio is available here: inventory days.
In terms of number of days, Nvidia’s lead time for its inventory has taken an average of 128 days or roughly 4 months to complete, as depicted in the chart above.
Again, the relatively long lead time for Nvidia’s inventory is due to the complex and long process of chip manufacturing.
Finished Goods Inventory Turnover Ratio
Nvidia-finished-products-inventory-turnover-ratio
(click image to expand)
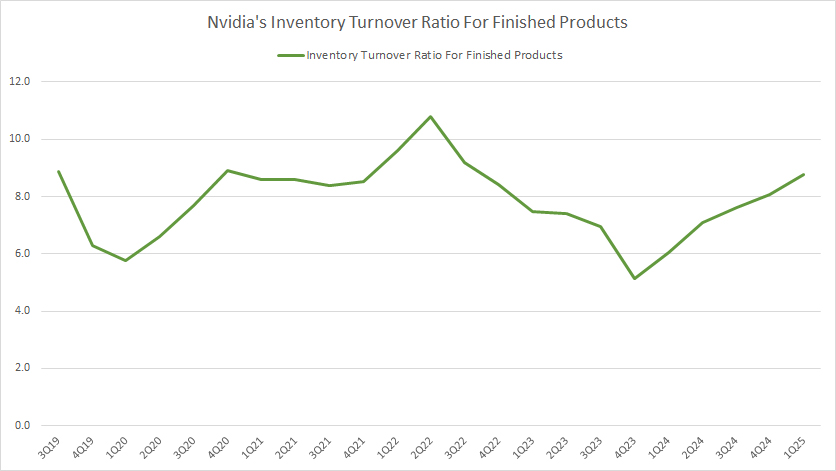
If we look at just the finished goods inventory, Nvidia’s inventory turnover ratio is much higher than that of the total inventory.
As illustrated in the chart above, Nvidia’s finished goods inventory turnover ratio has consistently hovered above 6.0X, which is about twice the number of the total inventory. The higher inventory turnover ratio indicates a much better lead time for Nvidia’s finished goods inventory compared to total inventory.
Finished Product Inventory Days
Nvidia-finished-products-inventory-days
(click image to expand)
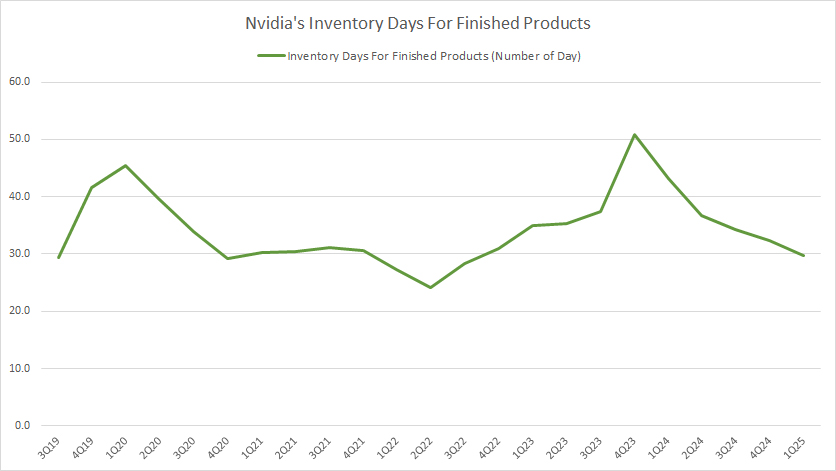
An industry standard that is used by most companies in measuring inventory turnover is the inventory days on hand for finished products.
For your information, the finished product inventory may refer to new and used inventories as well as service parts.
The formula to calculate the inventory days is shown below:
Days of sales for finished products = (new and old inventory / trailing deliveries ) X 261 working days
To calculate the lead time of Nvidia’s finished goods, I have slightly modified the above equation. I have replaced the new and used inventory with Nvidia’s finished products to include new and used inventory.
Therefore, Nvidia’s lead time for finished products has come to around 35 days or slightly over a month on average. In other words, it takes Nvidia only a month to clear its finished goods, which is much better than the lead times all the way from raw materials to finished goods.
Conclusion
To recap, Nvidia’s total inventory has ballooned significantly to record figures in recent periods, totaling close to $6 billion as of fiscal 1Q 2025.
Although Nvidia’s inventory has risen considerably, the ratios of inventory to current assets and revenue have indicated no significant deviations, suggesting that the company’s expanding inventory is a sign of vertical growth and expansion rather than an inventory issue.
References and Credits
1. All financial figures presented in this article were obtained and referenced from Nvidia’s SEC filings, quarterly and annual reports, earnings calls, presentations, webcast, etc., which are available in Nvidia Financial Reports.
2. Pexels Images.
Disclosure
References and examples such as tables, charts, and diagrams are constantly reviewed and cross-checked to avoid errors.
The content in this article is for informational purposes only and is neither a recommendation nor a piece of financial advice to purchase a stock.
If you find the information in this article helpful, please consider sharing it on social media and also provide a link back to this article from any website so that more articles like this one can be created in the future.
Thank you!


