Social media companies. Pixabay Image.
This article presents the revenue, profit, and margins of Snap Inc. (NYSE: SNAP).
Snap Inc. provides a detailed breakdown of its revenue by segments and regions. The revenue segment that we will cover in this article includes the company’s advertising revenue.
For the revenue by region, Snap Inc. provides the sales numbers from North America, Europe, and the Rest of World.
The North American region includes Mexico, the Caribbean, and Central America. On the other hand, the European region includes Russia and Turkey. Effective March 2022, Snap halted advertising sales to Russian and Belarusian entities.
The Rest Of World region includes countries outside of North America and Europe.
Let’s look at the numbers!
Please use the table of contents to navigate this page.
Table Of Contents
Definitions And Overview
O2. Snap Business Strategy
O3. How Does Snap Grow Its Revenue?
Consolidated Revenue
A1. Revenue By Year
A2. Revenue By Quarter
A3. Revenue By TTM
A4. YoY Growth Rates Of Revenue By TTM
Consolidated Profits And Margins
B1. Gross, Operating, Net Profit And Adjusted EBITDA
B2. Gross, Operating, Net Profit And Adjusted EBITDA Margin
Segment Revenue
C1. Advertising Revenue
C2. Advertising Revenue In Percentage
Regional Revenue
D1. North America, Europe, And Rest Of World Revenue
D2. North America, Europe, And Rest Of World Revenue In Percentage
D3. Growth Rates Of North America, Europe, And Rest Of World Revenue
Summary And Reference
S1. Conclusion
S2. References and Credits
S3. Disclosure
Definitions
To help readers understand the content better, the following terms and glossaries have been provided.
Adjusted EBITDA: Adjusted EBITDA refers to Earnings Before Interest, Taxes, Depreciation, and Amortization, adjusted for one-time, irregular, or non-recurring charges or credits.
This financial metric provides a clearer picture of a company’s operating performance and cash flow generation capability by removing the effects of financing, accounting, tax treatments, and any non-operating or non-recurring items.
Investors and analysts often use adjusted EBITDA to compare profitability between companies and industries, as it focuses on the core operations of a business.
AR Ads: AR Ads stands for augmented reality advertisement. It is one of Snap Inc.’s advertising products.
AR ads take advantage of the reach and scale of Snap’s augmented reality platform to create visually engaging 3D experiences, including the ability to visualize and try on products such as beauty, apparel, accessories, and footwear.
Snap Ads: Snap Ads is another Snap Inc’s advertising products. It includes conventional advertisements such as single images or video ads.
Revenue By Region: According to Snap Inc., revenue for geographic reporting is apportioned to each region based on Snap’s determination of the geographic location in which advertising impressions are delivered, as this approximates revenue based on user activity.
This allocation is consistent with how ARPU is determined.
Snapchat: Snapchat is the flagship product of Snap Inc. It is the company’s core mobile device application and visual messaging app.
According to Snap Inc., the primary purpose of Snapchat is to enhance user experience with friends, family, and the world through augmented reality, video, voice, messaging, and creative tools.
Users can interact with each other through five primary products within the Snapchat app: Camera, Visual Messaging, Snap Map, Stories, and Spotlight.
Snap Business Strategy
Snap Inc.’s business strategy primarily focuses on leveraging its innovative technology to engage a youthful audience through ephemeral content, augmented reality (AR), and interactive media. This strategy encompasses several key components:
1. **Engagement Through Ephemeral Content**: Snap Inc., through its flagship product Snapchat, introduced the concept of photos and messages that disappear after being viewed. This encourages more spontaneous and natural communication among users, differentiating it from other social media platforms focusing on permanent content.
2. **Innovation in Augmented Reality**: Snap has been at the forefront of integrating AR technology into social media. It offers users various AR filters and lenses to enhance their photos and videos, driving user engagement and opening up new advertising opportunities.
3. **Focus on a Young Demographic**: Snap Inc. targets younger audiences, particularly those between 13 and 34. This demographic attracts advertisers looking to influence brand preferences and purchase decisions.
4. **Monetization Through Advertising**: The company’s revenue primarily comes from advertising. Snap offers a variety of ad products, including Snap Ads, Sponsored Lenses, and Geofilters, which allow brands to interact with users in a fun and engaging way.
5. **Content and Media Partnerships**: Snap has partnerships with various media organizations and content creators to offer a wide range of content within the app. This includes news stories, entertainment, and sports highlights, which keep users engaged and returning to the platform.
6. **Privacy and Security**: Recognizing the importance of privacy to its users, Snap Inc. has ensured that communication on Snapchat is secure and that personal data is protected. This emphasis on privacy is also a part of its strategy to maintain and grow its user base.
7. **Continuous Improvement and Innovation**: Snap Inc. invests heavily in research and development to continually improve its existing products and develop new technologies. This commitment to innovation helps the company stay ahead in a rapidly evolving digital environment.
By focusing on these strategic areas, Snap Inc. aims to maintain its relevance and popularity among young users while exploring new revenue streams and growth opportunities in the digital landscape.
How Does Snap Grow Its Revenue?
Snap Inc., the parent company of Snapchat, has implemented several strategies to grow its revenue. Here are some key ways the company achieves this:
1. **Advertising**: Most of Snap Inc.’s revenue comes from advertising. Snapchat offers various ad formats, including Snap Ads (full-screen video ads), Sponsored Lenses (which allow users to interact with augmented reality effects), and Sponsored Geofilters (custom overlays for snaps that can only be accessed in specific locations). By continually innovating and offering engaging ad formats, Snap attracts advertisers looking to reach the platform’s predominantly young audience.
2. **Discover Section**: This section of Snapchat features content from media partners and creators, including news stories, entertainment, and lifestyle articles. Snap Inc. monetizes this section by sharing ad revenue with content creators, encouraging high-quality content production that, in turn, attracts more users and advertisers.
3. **Snapchat Plus**: Introduced as a premium subscription service, Snapchat Plus offers users access to exclusive, experimental, and pre-release features in exchange for a monthly fee. This subscription model provides an additional revenue stream beyond advertising.
4. **Augmented Reality (AR) Technology**: Snap has invested heavily in AR technology, allowing brands to create interactive experiences through Sponsored Lenses. This provides a unique advertising opportunity and positions Snap as a leader in AR, potentially opening up new revenue streams through technology licensing or partnerships.
5. **Snapchat Spotlight**: Spotlight is a platform within Snapchat that showcases user-generated content. It encourages content creation by offering financial incentives to creators whose posts perform well. While directly monetizing Spotlight might not be the primary focus, it helps retain and engage users, thereby increasing the platform’s attractiveness to advertisers.
6. **International Expansion**: By expanding its user base in untapped international markets, Snap can increase its overall audience, thus becoming more attractive to global advertisers and partners.
7. **E-commerce and In-app Purchases**: Although in its early stages, Snap has begun experimenting with in-app purchases and e-commerce features, such as allowing users to buy products directly through advertisements or branded content. This provides a direct revenue stream and enhances the value proposition for advertisers.
By diversifying its revenue sources and continually innovating to keep its user base engaged and growing, Snap Inc. maintains its position as a significant player in the social media and digital advertising landscape.
Revenue By Year
Snap-Inc-revenue-by-year
(click image to expand)
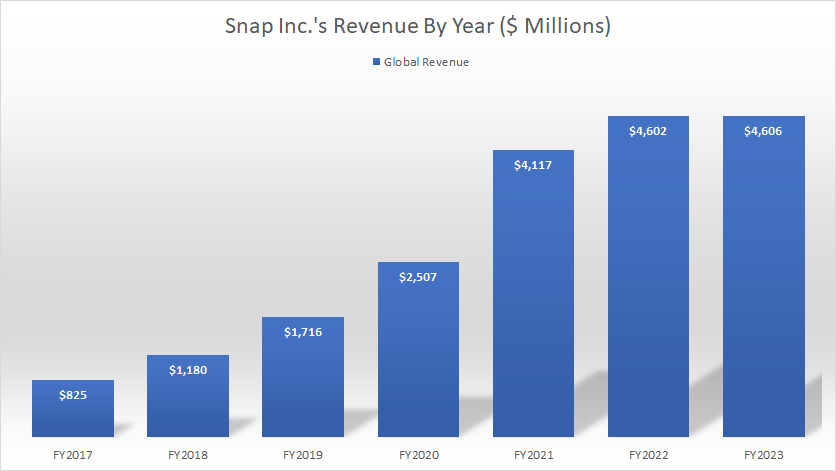
Snap’s global revenue remained flat at $4.6 billion in fiscal year 2023 compared to the result in 2022. However, it was up 12% over 2021.
Since 2017, Snap’s global revenue has multiplied by nearly sixfold, driven primarily by the growth in its user base and an increase in engagement among its current users, as seen in this article – Snapchat DAU versus Facebook.
Additionally, Snap has introduced new ad formats, improving ad targeting capabilities, and offering enhanced analytics tools to advertisers. These improvements has made the platform more attractive to advertisers, leading to increased spending, and therefore the rise in revenue.
Revenue By Quarter
Snap-Inc-revenue-by-quarter
(click image to expand)
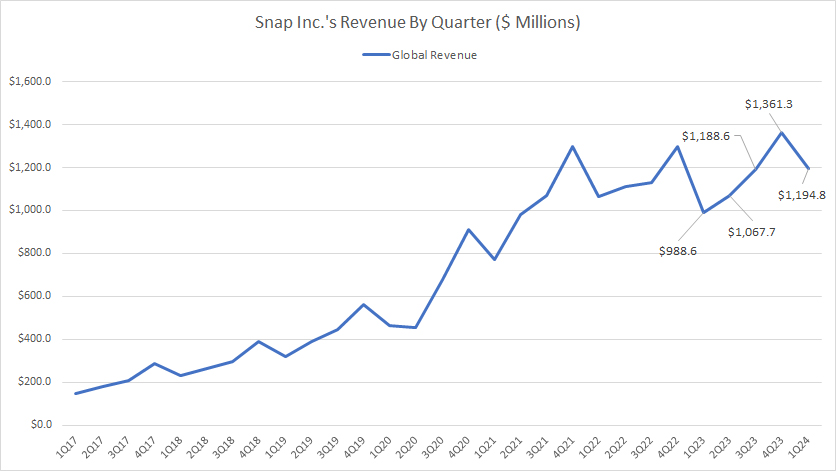
Snap earned $1.2 billion, $1.4 billion, and $1.2 billion in quarterly revenue in fiscal 3Q 2023, 4Q 2023, and 1Q 2024, respectively. The 1Q 2024 revenue represents a rise of 21% over the same quarter a year ago.
On average, Snap Inc. earned $1.2 billion in quarterly revenue between 1Q 2023 and 1Q 2024.
Revenue By TTM
Snap-Inc-revenue-by-ttm
(click image to expand)
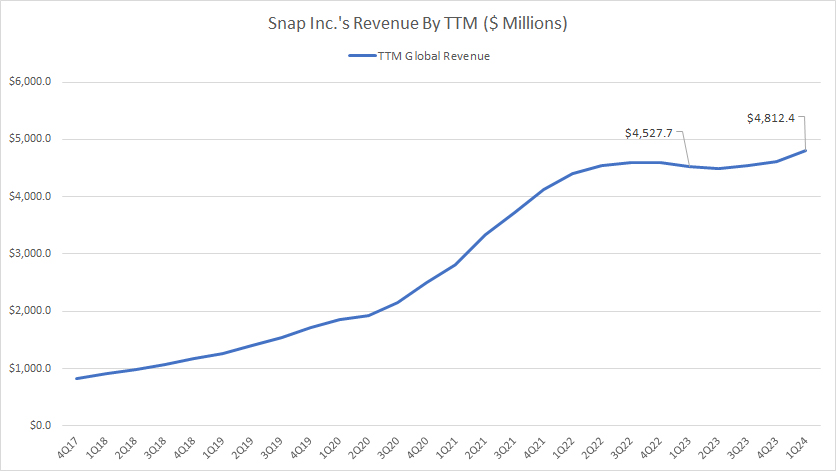
The TTM plot above looks much smoother than the quarterly plot and illustrates the incredible growth of Snap’s global revenue in the earlier years.
However, Snap’s revenue has remained relatively flat in the post-pandemic era since 2022, as shown in the TTM chart above. As of 1Q 2024, Snap’s TTM revenue reached $4.8 billion, up 6% from a year ago.
YoY Growth Rates Of Revenue By TTM
Snap-Inc-growth-rates-of-revenue-by-ttm
(click image to expand)
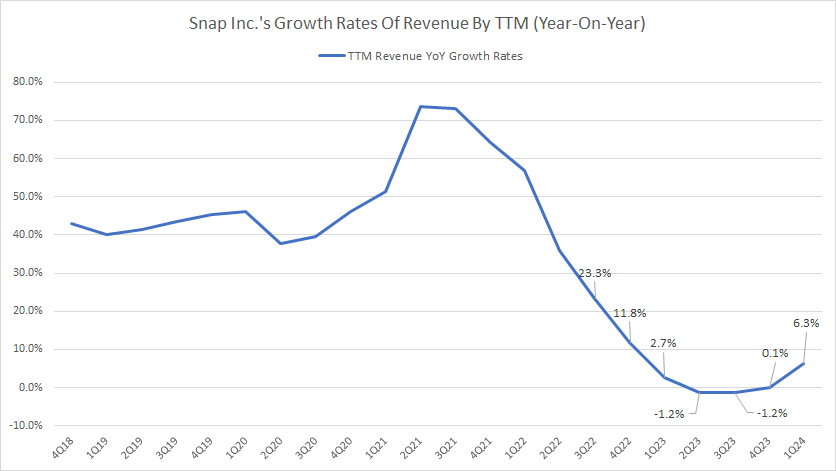
The growth rate plot above clearly shows that Snap’s revenue growth has significantly declined in post-pandemic periods.
After reaching the peak in 2021, Snap’s revenue growth has slowed, as presented in the chart. Snap’s revenue growth has been in low single-digits in most periods during post-COVID era. As of 1Q 2024, Snap’s revenue grew 6.3% compared to 2.7% a year ago.
Gross, Operating, Net Profit And Adjusted EBITDA
Snap-Inc-profitability
(click image to expand)
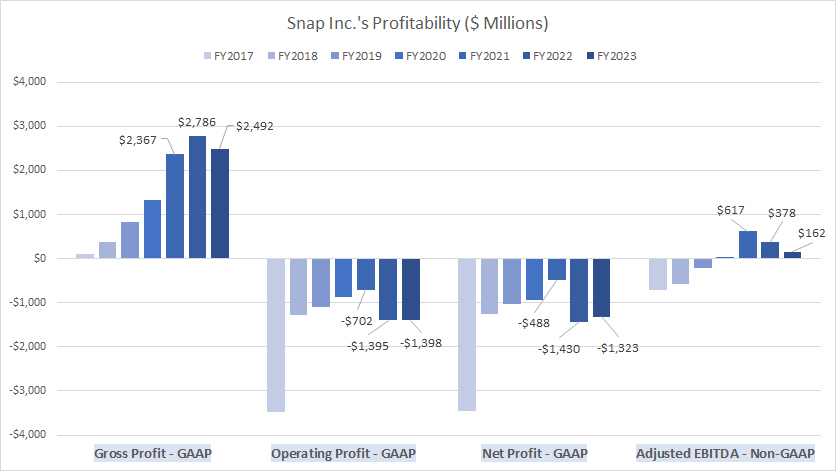
The definition of Snap’s adjusted EBITDA is available here: adjusted EBITDA. At first look, Snap Inc. is not a profitable company.
Snap Inc.’s gross profit totaled $2.5 billion in fiscal year 2023, and has averaged $2.5 billion between 2021 and 2023. Although Snap produces significant number of gross profit, it has never produced an operating profit and net profit.
As the chart shows, Snap has consistently experienced operating and net losses in all fiscal years. Snap’s operating loss has averaged -$1.2 billion in the last three years, while net loss has measured roughly the same.
In addition, the company’s adjusted EBITDA has significantly deteriorated, suggesting that it may be facing operational challenges that are impacting its profitability. In this aspect, Snap has incurred high operating costs. The high operating costs have led to the poor adjusted EBITDA, indicating that the company is not managing its expenses well relative to its revenue.
Despite the poor profitability, Snap has been generating positive cash flow.
Gross, Operating, Net Profit And Adjusted EBITDA Margin
Snap-Inc-margins
(click image to expand)
The definition of Snap’s adjusted EBITDA is available here: adjusted EBITDA. As shown in the chart above, Snap Inc. has poor margins.
Although Snap’s gross margin reached over 60% in 2022, it plummeted significantly to 54% in 2023. Besides, it has never had a positive operating and net profit margin. Snap has never made a profit.
Snap’s operating margin has averaged -26% between 2021 and 2023, while the net profit margin came in at -24% during the same period. In addition, Snap’s adjusted EBITDA margins decreased to just 3.5% in fiscal year 2023, compared to 15% and 8% in 2021 and 2022, respectively.
Again, Snap Inc. is not profitable and has poor margins.
Advertising Revenue
Snap-Inc-advertising-revenue
(click image to expand)
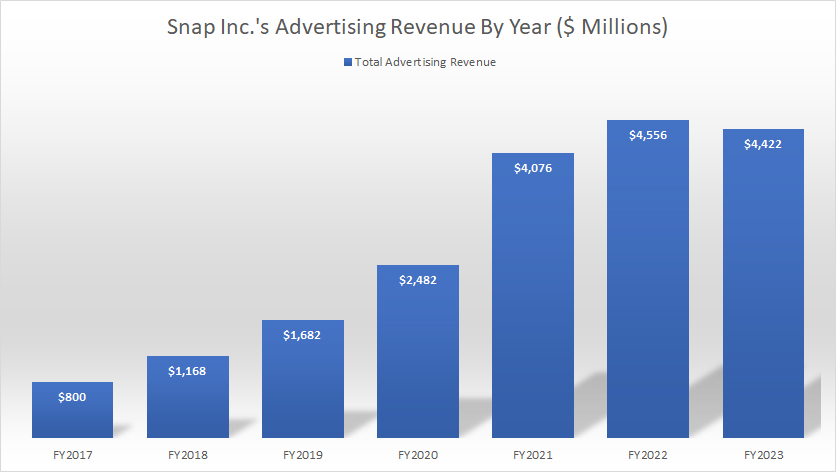
Snap makes the majority of its money from advertising revenue, as shown in the chart above.
In fiscal 2023, Snap Inc. earned $4.4 billion in advertising revenue, down 3% over 2022 but up 8% over 2021. Since 2017, Snap’s advertising revenue has grown by 470%, a clear testament of its successful and effective business strategy.
On average, Snap’s advertising revenue has measured $4.4 billion annually between fiscal year 2021 and 2023.
Advertising Revenue In Percentage
Snap-Inc-advertising-revenue-to-total-revenue-ratio
(click image to expand)
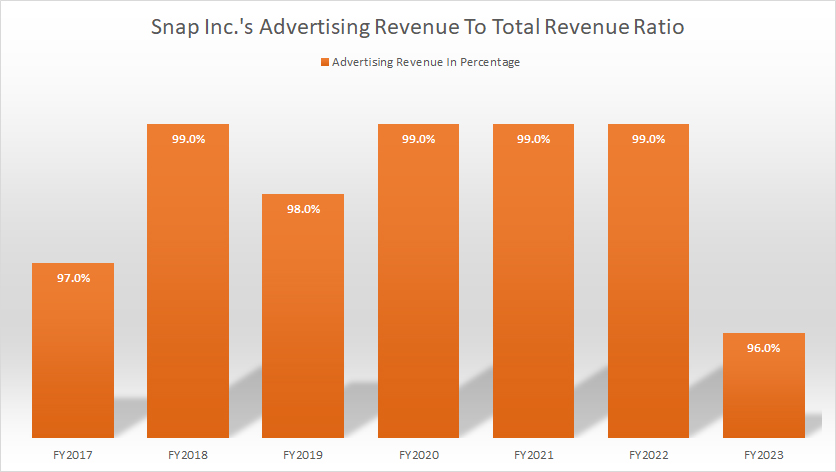
As shown in the chart above, Snap Inc. derives the majority of its revenue from advertising sales, totaling over 96% in 2023.
On average, Snap’s advertising revenue has accounted for 98% of its total revenue between fiscal year 2021 and 2023. Moreover, this ratio has remained relatively unchanged since 2017, suggesting the importance of advertising revenue to the company.
Although Snap has introduced other revenue streams, including a subscription model for one of its products, Snap expects this trend to continue for the foreseeable future. According to Snap’s annual reports, most advertisers do not have long-term advertising commitments with the company, and the efforts to establish long-term commitments may not succeed.
Snap’s advertising customers range from small businesses to well-known brands, and may include advertising resellers. In addition, some advertisers may view some of Snap’s advertising solutions as experimental and unproven, or prefer certain products over others.
If Snap does not deliver advertisements in an effective manner, or if advertisers do not believe that their investment in advertising with Snap will generate a competitive return relative to other alternatives, they will not continue to do business with Snap.
Therefore, Snap must deliver advertising in an effective manner, including introducing new ad formats, improving ad targeting capabilities, and offering enhanced analytics tools to advertisers.
North America, Europe, And Rest Of World Revenue
Snap-Inc-revenue-by-region
(click image to expand)
The definition of Snap’s revenue by region is available here: revenue or sales by user geographical region.
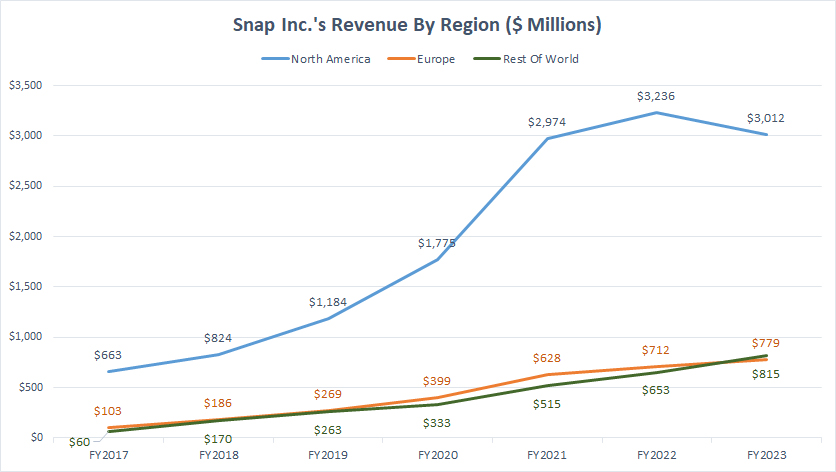
Snap derives the majority of its revenue from North America, as shown in the chart above. Snap’s North America revenue is significantly higher than those from other regions, including Europ and Rest Of World.
In fiscal 2023, Snap earned $3 billion in revenue from North America, down 7% over 2022. Snap’s revenue from North America has averaged $3.1 billion over the last three years.
On the other hand, Snap has earned an average of $706 million annually from Europe between 2021 and 2023, while the Rest Of World region has measured $661 million annually during the same period.
A noticeable trend is Snap’s rising revenue in all geographical regions. For example, Snap’s revenue from North America has increased nearly four-fold since 2017, while sales from Europe have grown by 600% over the last seven years.
Snap’s revenue from the Rest Of World region has grown at an even more impressive rate, totaling more than 1000% since 2017.
North America, Europe, And Rest Of World Revenue In Percentage
Snap-Inc-revenue-by-region-in-percentage
(click image to expand)
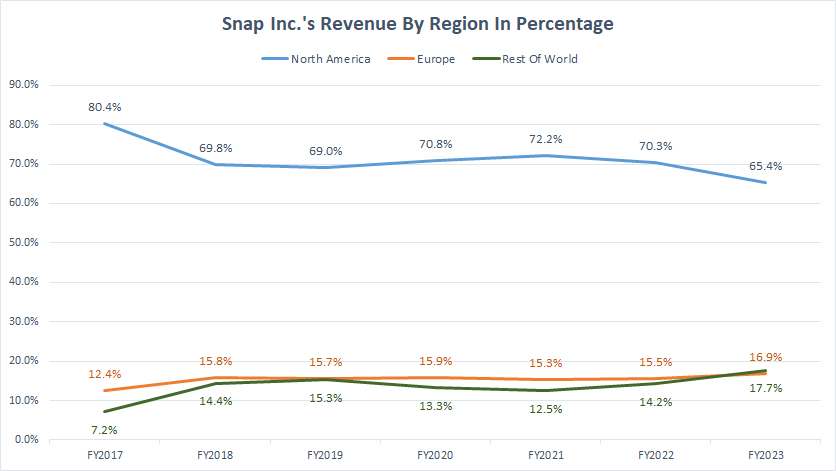
The definition of Snap’s revenue by region is available here: revenue or sales by user geographical region.
Snap derived as much as 65% of revenue from North America in 2023, the largest among all regions under comparison. This ratio has slightly decreased since 2017 but has remained relatively stable over the last several years. On average, Snap’s revenue from North America has accounted for 69% of its total between 2021 and 2023.
On the other hand, Snap’s revenue from Europe accounted for 16.9% of its total revenue in 2023, while the Rest Of World region contributed about 17.7% of sales to total revenue in the same period. For the first time in the last seven years in 2023, the Rest Of World region contributed more revenue than Europe.
Moreover, the ratios from Europe and Rest Of World have significantly increased since 2017, indicating the growing presence of Snapchat in these regions.
YoY Growth Rates Of North America, Europe, And Rest Of World Revenue
Snap-Inc-growth-rates-of-revenue-by-region
(click image to expand)
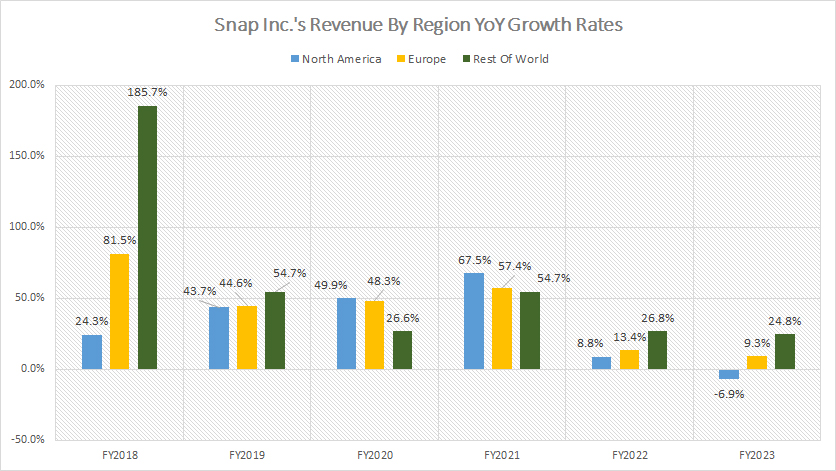
The definition of Snap’s revenue by region is available here: revenue or sales by user geographical region. On a YoY basis, Snap’s revenue growth has significantly slowed in post-COVID periods.
For example, Snap’s North American revenue growth in 2023 was a decrease of 7%, while revenue growth in Europe plummeted to 9.3%. Rest Of World’s revenue growth also has stalled in post-COVID time. It measured just 24.8% in 2023, compared to 26.8% in 2022 and 54.7% in 2021.
To put it briefly, Snap Inc. witnessed the most sluggish growth in revenue in 2023 as compared to the years since 2017. Since 2017, the Rest Of World region has had the highest average growth rate of 35% in the last three years, compared to Europe at 27% and North America at 23%.
Summary
In summary, Snap is a social media company that generates the majority of its revenue from advertising. Snap’s advertising revenue has accounted for 98% of the total on average over the last three years.
Although revenue has significantly grown, Snap is not a profitable company and has consistently experienced operating and net losses.
Snap’s North America has been the company’s largest revenue source, generating up to 65% of the company’s total sales or US$3.0B in 2023. Among all regions, the Rest Of World region has outperformed North America and Europe in revenue growth in most fiscal years.
Snap’s revenue growth is an important indicator of the company’s financial health and its ability to attract and retain users, sell advertising space, and introduce new products or services.
References and Credits
1. All financial figures presented in this article are obtained and referenced from Snap Inc.’s quarterly and annual reports, earnings releases, webcast, investor letters, SEC filings, press releases, presentations, etc., which are available in Snap Investor Relation.
2. Snapchat userguides, advertising information, and business strategy are ontained and referenced from Snapchat Support and Snapchat Business Help Center.
3. Pixabay Images.
Disclosure
References and examples such as tables, charts, and diagrams are constantly reviewed to avoid errors, but we cannot warrant the total correctness of all content.
The content in this article is for informational purposes only and is neither a recommendation nor a piece of financial advice to purchase a stock.
If you find the information in this article helpful, please consider sharing it on social media and provide a link to this article from any website so that more articles like this can be created.
Thank you!

