Cash flow. Pixabay Image.
Cash is the lifeline of a business. It is no exception for General Motors (NYSE: GM).
GM needs a lot of cash for its businesses as automobile manufacturing is generally a capital-intensive operation. Therefore, cash has become critical for the automaker.
In this article, we will look at several cash-related statistics of General Motors, which include the cash on hand, cash flow from operations, free cash flow, cash margins, net cash from financing activities, etc.
Let’s look at GM’s cash statistics.
Please use the table of contents to navigate this page.
Table Of Contents
Definitions And Overview
- Cash Equivalents and Restricted Cash
- Marketable Securities
- Cash Flow Margin
- Net Cash From Financing Activities
O2. How Does General Motors Use Its Cash?
Consolidated Results
Type Of Cash
Ratio
C1. Cash On Hand To Current Assets Ratio
Cash Flow
D1. Net Cash From Operations
D2. Free Cash Flow
Cash Flow Margins
E1. Operating Cash Flow Margin
E2. Free Cash Flow Margin
Cash From Debt Borrowing And For Debt Repayment
F1. Net Cash From Financing Activities
Conclusion And Reference
S1. Conclusion
S2. References and Credits
S3. Disclosure
Definitions
To help readers understand the content better, the following terms and glossaries have been provided.
Cash Equivalents And Restricted Cash: According to GM’s annual reports, cash equivalents are defined as short-term, highly-liquid investments with original maturities of 90 days or less.
Certain operating agreements require GM to post cash as collateral. Cash and cash equivalents subject to contractual restrictions and not readily available areclassified as restricted cash. Restricted cash is invested in accordance with the terms of the underlying agreements and include amounts related to various deposits, escrows and other cash collateral.
Restricted cash is included in Other current assets and Other assets in the consolidated balance sheets.
Marketable Securities: Marketable securities are financial instruments and assets that can be quickly converted into cash without significantly affecting their value. These are highly liquid assets traded on public markets, making it easy for individuals and companies to buy and sell them.
Marketable securities include stocks, bonds, mutual funds, exchange-traded funds (ETFs), and government securities. Their high liquidity and short maturity periods make them an attractive option for investors looking for temporary investments or a place to park cash that can be easily accessed.
Cash Flow Margin: Cash flow margin is a financial metric that measures the ability of a company to convert sales into cash. It is calculated by dividing the cash flows from operating activities by the net sales or revenue of the company and then multiplying the result by 100 to express it as a percentage.
This ratio indicates how efficiently a company generates cash from its sales, which is crucial for covering its expenses, paying off debts, and investing in growth opportunities. A higher cash flow margin reflects a company’s strong financial health and operational efficiency, whereas a lower margin may signal financial challenges or inefficiencies in managing its operations and resources.
Net Cash From Financing Activities: Net cash from financing activities is a section of a company’s cash flow statement, which shows the cash flows used to fund the company. This includes transactions involving equity, debt, and dividends.
Specifically, it encompasses the inflow of cash from investors such as banks and shareholders when they provide capital or loans to the company and the outflow of cash to shareholders as dividends or to creditors as debt repayments.
The net figure can indicate whether a company is generating more cash than it uses to finance its operations or relies on external financing (through debt or issuing more shares) to maintain or expand its activities.
How Does General Motors Use Its Cash?
Like any large corporation, General Motors (GM) strategically utilizes its cash reserves and cash flows in various ways to ensure the company remains competitive, profitable, and capable of growth. Here are the primary methods through which GM uses its cash:
1. **Investment in Research and Development (R&D)**: GM invests a significant portion of its cash in R&D to innovate and develope new automotive technologies, electric vehicles (EVs), and autonomous vehicles and improve existing car models. This investment is crucial for staying ahead in a highly competitive and rapidly evolving industry.
Investors interested in General Motors’ R&D budget may find more information on this page: GM R&D Spend Versus Tesla.
2. **Capital Expenditures**: This includes investments in new manufacturing plants, equipment, and technology upgrades to improve production efficiency and capacity. By maintaining and enhancing its manufacturing capabilities, GM ensures it can meet market demand and reduce production costs.
3. **Dividends**: GM returns value to its shareholders by paying dividends. This use of cash is a way to share the company’s profits with its investors and maintain investor confidence and loyalty.
Investors interested in the safety of General Motors’ dividends may find more information on this page: 6 Reasons GM Dividend Is Safe And 5 It Is Not.
4. **Debt Repayment**: GM uses part of its cash to service its debt, which includes paying interest and repaying principal amounts on loans and bonds. Effective debt management is crucial for maintaining financial health and stability.
Can GM service and repay its debt? Read more about GM’s interest expenses and debt here: GM interest expenses and debt.
5. **Share Buybacks**: At times, GM may use its cash to buy back its shares from the market. Share buybacks can help increase the value of remaining shares because they reduce the number of shares outstanding, potentially making each share worth a larger fraction of the company.
GM has resumed its share buyback in post-COVID periods, according to this article – General Motors Share Buyback History.
6. **Strategic Acquisitions**: GM may use its cash to acquire other companies that can complement its existing business, provide new technologies, or open new markets. Such strategic acquisitions can be a fast track to growth and diversification.
7. **Operational Expenses**: Day-to-day operational expenses, including salaries, benefits, materials, and other overhead costs, are covered by the company’s cash flows. Managing these expenses efficiently is vital for sustaining operations and profitability.
8. **Contingency Reserves**: Setting aside cash reserves to deal with unexpected challenges or opportunities is another prudent use of cash. These reserves can help the company navigate economic downturns, supply chain disruptions, or sudden market changes without compromising its strategic goals.
GM’s liquidity ratio is available on this page: General Motors liquidity ratio.
By balancing these uses of cash, General Motors aims to maintain its position as a leading global automotive manufacturer, drive innovation, reward its shareholders, and ensure long-term sustainability and growth.
Total Cash On Hand
GM’s cash on hand
(click image to expand)
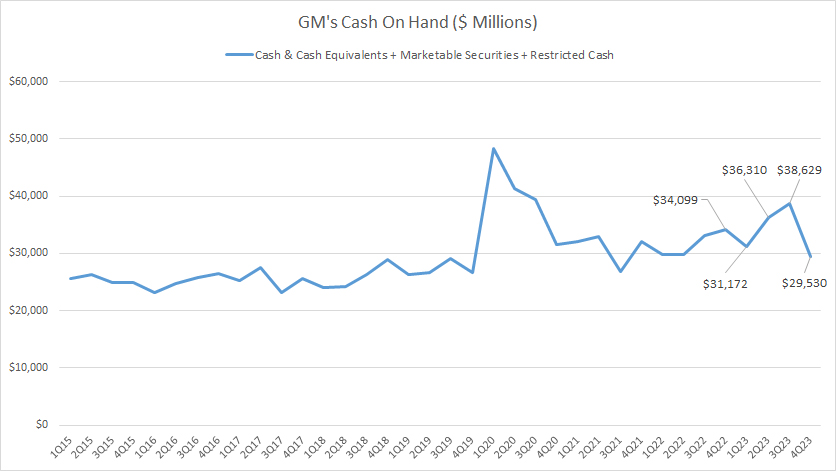
GM’s total cash on hand consists of cash & cash equivalents, marketable securities (investments), and a current portion of restricted cash. The definitions of GM’s cash equivalents, restricted cash, and marketable securities are available here: cash equivalents and restricted cash and marketable securities.
GM invests a big part of its cash and cash equivalents in fixed deposits, U.S. government bonds, and corporate and sovereign debts which are relatively safe. Similarly, GM’s marketable securities are invested in US government bonds, corporate and sovereign debt as well as a small amount of mortgage-backed securities.
These investments produce interest incomes for General Motors and are liquid assets that can be converted to cash immediately whenever the company needs them.
That said, GM’s cash on hand has been on a steady rise, as shown in the plot above. As of 4Q 2023, GM’s total cash on hand reached $29.5 billion, down 13% from a year ago. On average, GM’s total cash on hand measured $32.2 billion per quarter between 2021 and 2023.
A noticeable trend is the significant increase in GM’s cash on hand during the onset of the COVID crisis in 2020. As shown in the plot above, GM’s total cash assets hit nearly $50 billion in 1Q 2020. However, this amount had slowly declined in subsequent quarters.
General Motors maintained a significant cash position in 2020 to remain highly liquid and flexible in case of a credit crunch.
Cash On Hand Breakdown
GM’s cash on hand breakdown
(click image to expand)
The definitions of GM’s cash equivalents, restricted cash, and marketable securities are available here: cash equivalents and restricted cash and marketable securities.
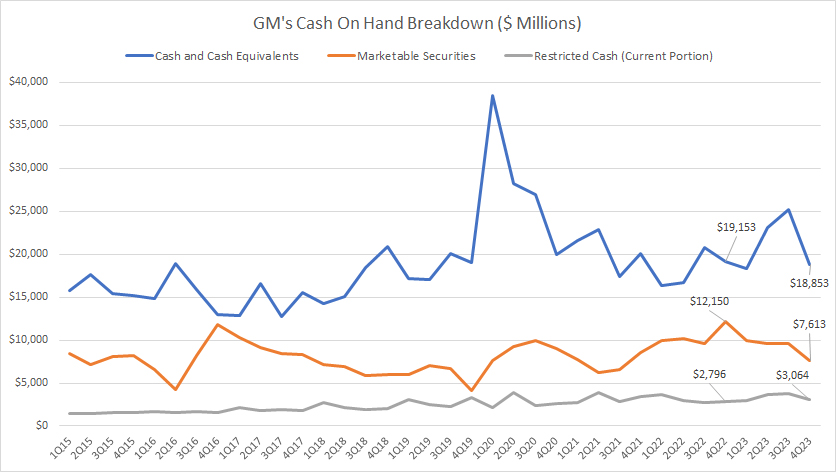
As shown in the chart above, GM’s cash on hand consists of mostly cash and cash equivalents. Marketable securities also make up a big portion of GM’s cash but not as much as cash equivalents.
In fiscal 4Q 2023, GM carried cash and cash equivalents totaling nearly $19 billion, while marketable securities reached $7.6 billion. Restricted cash totaled just $3.1 billion, the least among all cash assets.
GM’s marketable securities have been relatively stable. On the other hand, its cash equivalents and restricted cash have sligthly ticked up since 2015, indicating the growing demand for highly liquid assets such as cash in GM’s businesses.
On average, GM’s cash equivalents totaled $20 billion per quarter between 2021 and 2023, while restricted cash hit $3.2 billion per quarter over the past three years.
Ratio Of Cash On Hand To Current Assets
GM’s cash on hand to current assets ratio
(click image to expand)
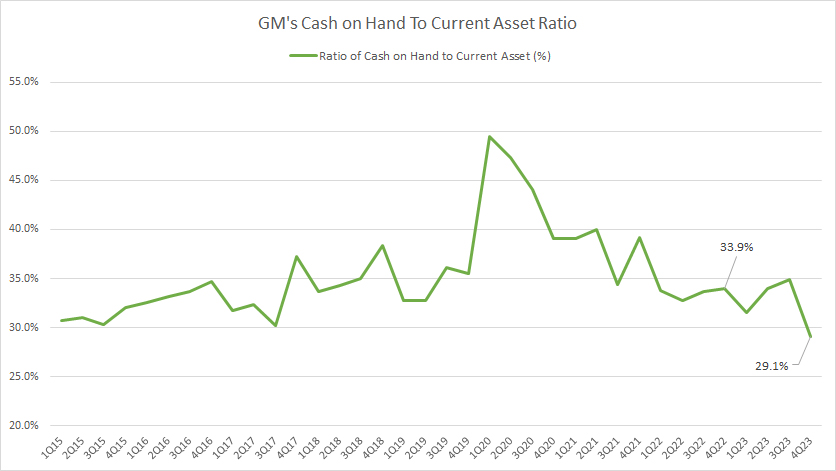
GM’s ratio of total cash on hand to current assets has remained relatively stable in the periods shown.
On average, the ratio measured 35% per quarter between 2021 and 2023. This ratio is sligthly higher than pre-COVID level which averages 33% per quarter between 2015 and 2019. Therefore, GM has carried more cash post-pandemic.
Net Cash From Operations
GM’s net cash from operations
(click image to expand)
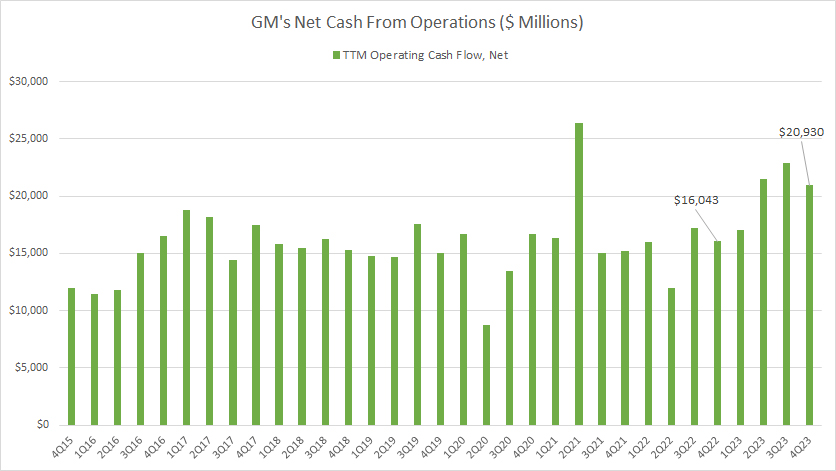
The discussion of GM’s cash flow cannot be meaningful without considering the company’s operating cash flow, as having a large cash reserve does not matter if the automaker is losing significant amounts of money.
That said, GM appears capable of generating strong operating cash flow. On average, GM has produced $18 billion in net cash from operations on a TTM basis over the past three years. This cash amount seems rather massive for a company with a market cap of just $50 billion.
As of fiscal 2023 Q4, GM generated $20.9 billion in net cash from operations on a TTM basis, a significantly higher figure compared to the three-year average.
Also, GM’s cash flow from operations had remained intact during the COVID-19 pandemic, implying the strong cash flow generating capability of the company under any circumstances, including a high-inflationary and high-interest-rate environment, shortages of materials, high costs of materials, etc.
In short, GM runs a solid business that produces strong operating cash flow.
Free Cash Flow
GM’s free cash flow
(click image to expand)
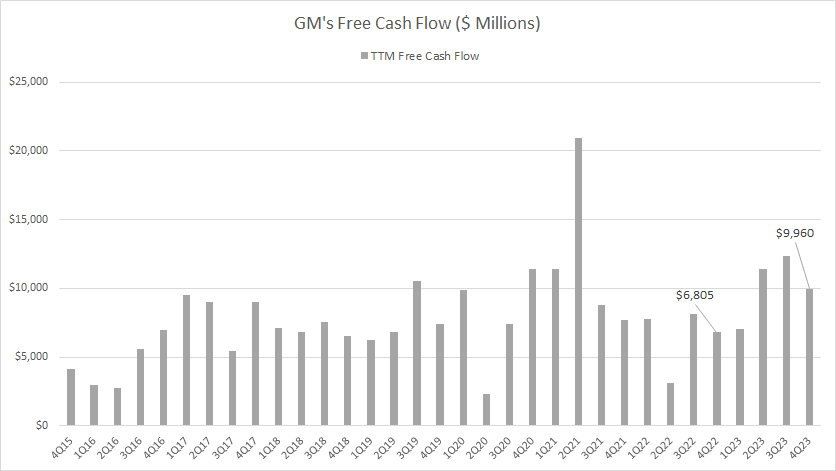
Similar to net cash from operations, GM generates solid free cash flow. On average, GM has produced about $9.6 billion in free cash flow on a TTM basis between 2021 and 2023.
As of 4Q 2023, GM’s free cash flow came to $10 billion on a TTM basis, a record figure in the last several quarters, and much higher than the figure a year ago.
Also, GM’s free cash flow looks intact in most periods shown in the chart. Although free cash flow was down in some quarters, they were mostly solid in most quarters, indicating the strong free cash flow generation capability of the company.
In short, GM’s free cash flow had been nearly immune to most disruptions, including the COVID-19 pandemic, and any other adversities encountered.
Operating Cash Flow Margin
GM’s operating cash flow margin
(click image to expand)
The definitions of GM’s cash flow margin is available here: cash flow margin.
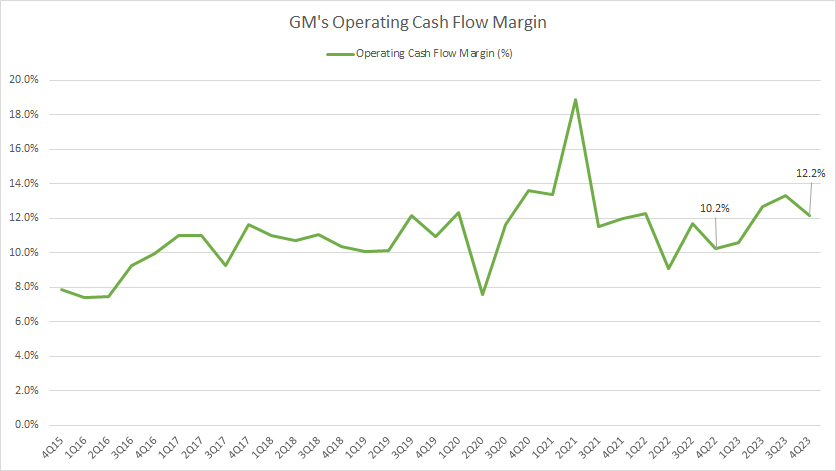
GM’s operating cash flow margin reached a record figure of 12.7% in fiscal 4Q 2023, a much higher ratio than a year ago. On average, GM’s operating cash flow margin measured 12.3% between 2021 and 2023.
Since 2015, GM’s operating cash flow margin has slightly increased, implying GM’s growing efficiency in producing operating cash flow.
Compared to other automakers such as Tesla and Ford, GM’s ratio is nearly at the same level of efficiency, as shown in these article – Tesla cash on hand and Ford cash on hand.
Free Cash Flow Margin
GM’s free cash flow margin
(click image to expand)
The definitions of GM’s cash flow margin is available here: cash flow margin.
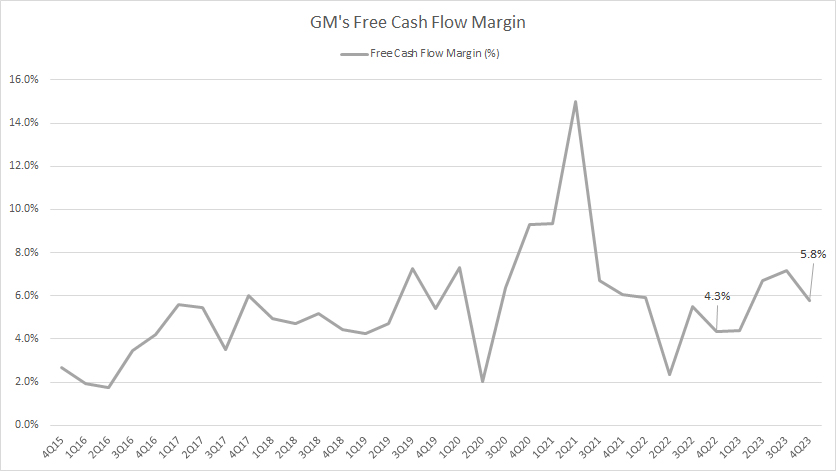
Similarly, GM has been quite efficient in producing free cash flow, as depicted by the free cash flow margin shown in the chart. On average, GM’s free cash flow margin topped 6.6% between 2021 and 2023. As of Q4 2023, GM’s free cash flow margin reached 5.8%, slightly higher from a year ago.
GM’s free cash flow margin is comparable with peers such as Tesla and Ford , as presented in these articles – Tesla cash on hand and Ford cash on hand.
Net Cash From Financing Activities
GM’s net cash from financing activities
(click image to expand)
The definitions of GM’s net cash from financing activities is available here: net cash from financing activities.
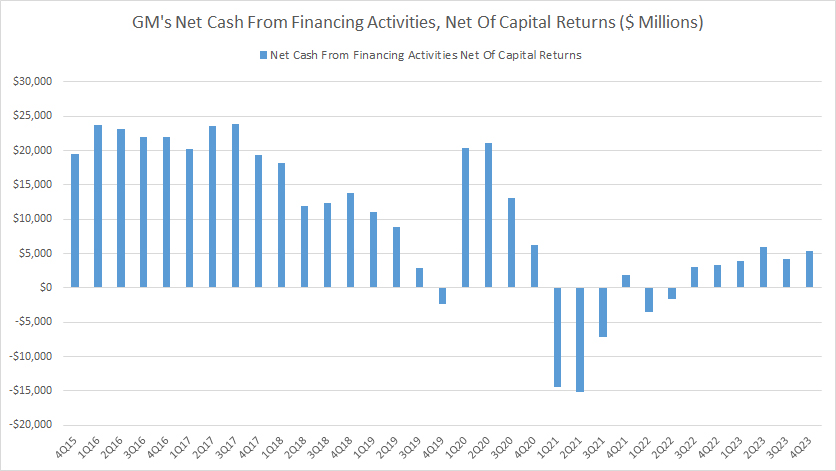
The net cash from financing activities depicts whether cash is used for debt repayment (negative numbers) or cash is added from debt borrowings (positive numbers).
The data presented in the plot above is net of cash arising from capital returns such as dividend payments and share buyback to rule out the effect of capital returns.
That said, GM’s net cash from financing activities is mostly positive in most quarters, implying that the company has been piling up debt.
GM has only managed to pay back its debt in several quarters, shown as negative figures, as depicted in the chart. In most periods, the automaker has taken on debt.
As a result, GM’s total debt has ballooned to $120 billion as of 2023.
Although net cash from financing activities has been mostly positive, it has significantly decreased in magnitude compared to pre-COVID levels. As shown in the chart, GM’s net cash from financing activities were much bigger during pre-pandemic time. In post-pandemic periods, the positive figures were much lower.
Summary
In short, General Motors produces solid cash flow and carries tonnes of cash on hand. The majority of the cash is cash equivalents.
More importantly, the company’s cash flow generation looked intact during most crises, including the COVID-19 disruptions, a material shortage, high costs and interest rate environement, and an ongoing war in Ukraine.
Although the automaker is a cash cow, it has been piling up debt instead of paying back debt, as depicted in the positive net cash from financing activities in most periods.
Investors concerned with GM’s debt may find more information on these pages – GM’s $120 billion debt problem and debt to equity ratio.
References and Credits
1. All financial figures presented in this article were obtained and referenced from GM’s SEC filings, earnings reports, news releases, shareholder presentations, quarterly and annual reports, etc., which are available in GM SEC Filings.
2. Featured images in this article are used under a Creative Commons license and sourced from the following websites: raymondclarkeimages.
Disclosure
References and examples such as tables, charts, and diagrams are constantly reviewed to avoid errors, but we cannot warrant the full correctness of all content.
The content in this article is for informational purposes only and is neither a recommendation nor a piece of financial advice to purchase a stock.
If you find the information in this article helpful, please consider sharing it on social media and also provide a link back to this article from any website so that more articles like this one can be created in the future.
Thank you!

