Ford Motor Company World Headquarters. Source: Flickr Image
This article presents the profitability of Ford Motor Company (NYSE:F).
We will explore several aspects of the profitability of Ford Motor, including the consolidated profit, profit by segment, profit by region and profit per vehicle.
Ford Motor must remain profitable because it pays a dividend and buys back its stocks.
Investors interested in Ford’s margins may visit this article – Ford Margins.
Please use the table of contents to navigate this page.
Table Of Contents
Definitions And Overview
Consolidated Results
A1. Operating Profit
A2. Adjusted EBIT
A3. Adjusted Earning Per Share
Results By Segment (New)
B1. Ford Blue, Ford Model e, Ford Pro, Ford Next, And Ford Credit
Results By Segment (Legacy)
B2. Automotive, Mobility, And Ford Credit
Results By Region (Legacy)
B3. North America, South America, Europe, China, And IMG
Results Per Car
C1. Consolidated Profit Per Vehicle
Results Per Car By Segment (New)
D1. Profit Per Vehicle In Ford Blue, Ford Model e, And Ford Pro
Results Per Car By Region (Legacy)
E1. Profit Per Vehicle In North America
E2. Profit Per Vehicle In South America
E3. Profit Per Vehicle In Europe
E4. Profit Per Vehicle In China
E5. Profit Per Vehicle In IMG
Conclusion And Reference
S1. Summary
S2. References and Credits
S3. Disclosure
Definitions
To help readers understand the content better, the following terms and glossaries have been provided.
Profit Per Vehicle: Profit per vehicle for an automobile company refers to the company’s net profit from selling one vehicle.
It is calculated by subtracting all the direct and indirect costs associated with manufacturing, marketing, and selling the vehicle from its selling price.
This metric is crucial for understanding an automobile company’s profitability and operational efficiency. It helps determine how well the company manages its production costs and pricing strategies to generate profit from each vehicle sold.
Adjusted EBIT: Adjusted EBIT (Earnings Before Interest and Taxes) for an automobile company refers to the company’s earnings from its operations, excluding interest expenses and taxes, and adjusting for one-time items, non-operational income, and expenses.
This measure helps assess the company’s core operational profitability by removing the effects of financing decisions, tax environments, and extraordinary events or expenses unrelated to the daily operations of manufacturing and selling vehicles.
It provides a clearer view of the company’s operational performance and its ability to generate profit from its primary business activities.
According to Ford, pre-tax items iclude pension and OPEB remeasurement gains and losses, significant expenses, and other items that Ford management considers unrelated to ongoing operating activities.
While the adjusted EBIT is a non-GAAP measure, Ford generally provides guidance for this metric because the excluded items are hard to predict.
Ford Blue: Ford Blue is Ford’s legacy business responsible for developing and selling Ford and Lincoln internal combustion engines (“ICE”) and hybrid vehicles.
Besides developing and selling new vehicles, Ford Blue also produces and sells service parts, accessories, and digital services to retail customers. Iconic gas and hybrid vehicles developed under Ford Blue include the F-150, Bronco, and Mustang.
Ford Model e: Ford Model e is responsible for the development and sale of electric vehicles (EV).
Apart from EVs, Ford Model e also designs and creates digital vehicle technologies, including embedded software and all of Ford’s electric architecture.
Ford Model e operates in North America, Europe, and China.
Ford Pro: Ford Pro is responsible for the sale of Ford and Lincoln ICE, hybrid, and electric vehicles, service parts, accessories, and services to commercial, government, and rental customers.
Ford Pro focuses on fleet sales to customers with large orders, such as those from commercial sectors, government, and rental companies.
Ford Pro’s vehicles sold in North America include the Super Duty and the Transit range of vans. In Europe, Ford Pro’s flagship vehicles include the Ranger. Ford Pro operates primarily in North America and Europe.
Ford Next: The Ford Next segment (formerly the Mobility segment) primarily includes expenses and investments for emerging business initiatives aimed at creating value for Ford in vehicle-adjacent market segments.
Operating Profit
Ford’s operating profit
(click image to expand)
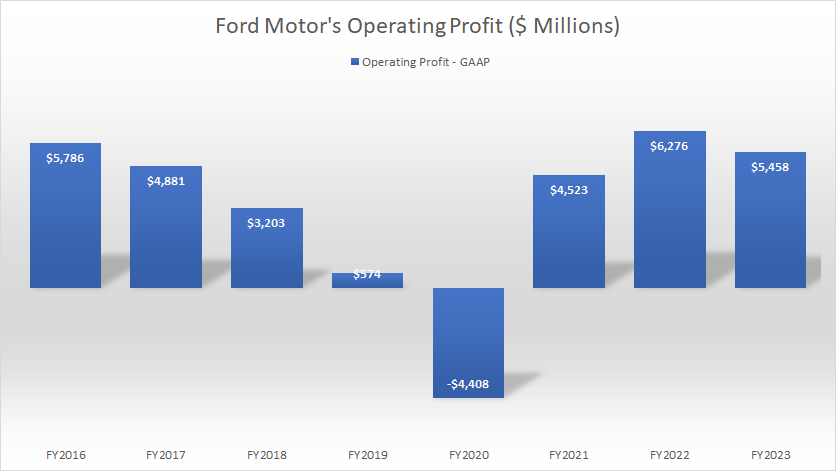
Ford Motor is a profitable company and has only reported an operating loss once over the past eight years, which occurred in 2020. Ford’s operating loss in fiscal 2020 was most likely driven by the COVID-19 disruption starting in the same year.
While Ford suffered a steep operating loss during the onset of the COVID crisis, it has quickly recovered in post-pandemic periods and reported an operating profit of more than $4.5 billion and $6.3 billion in fiscal year 2021 and 2022, respectively.
As of fiscal year 2023, Ford’s operating profit surged to $5.5 billion, one of the best figures ever measured.
In short, Ford Motor is profitable and has produced mostly positive operating profits since 2016.
Adjusted EBIT
Ford’s adjusted EBIT
(click image to expand)
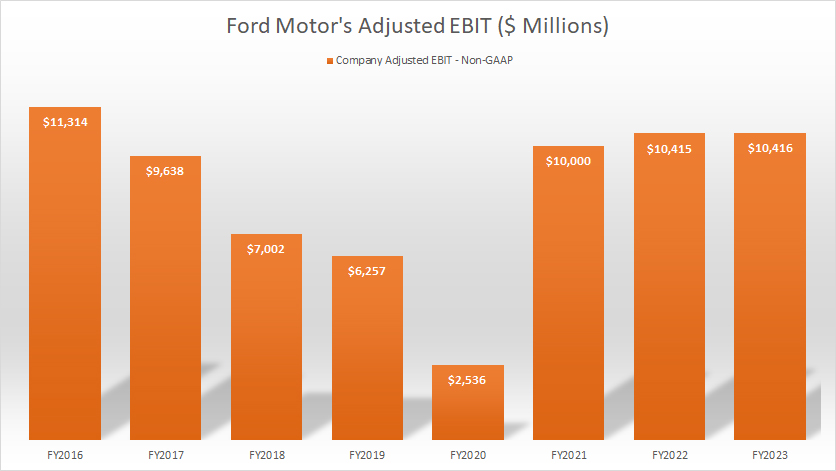
Ford uses its own metrics to measure operating efficiency. One of these metrics is the adjusted EBIT or adjusted earnings before interest and taxes. The definition of Ford’s adjusted EBIT is available here: adjusted EBIT.
As shown in the chart above, Ford has been making more than $10 billion in adjusted profit annually since fiscal year 2021. As of 2023, Ford’s adjusted profit surged to $10.4 billion, a record figure in the last several years.
In short, Ford’s has quickly recovered in post-pandemic periods, with profitabilitty soaring to record figures.
Adjusted Earning Per Share
Ford’s adjusted EPS
(click image to expand)
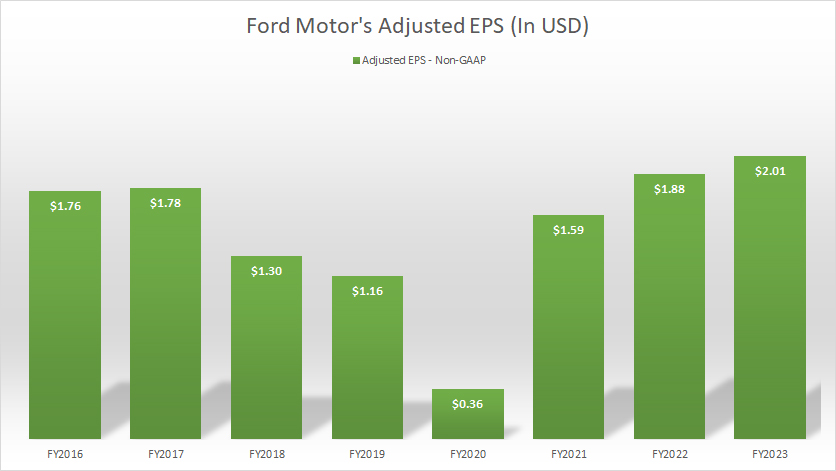
Similar to the adjusted EBIT, Ford’s adjusted EPS is a non-GAAP measure and is adjusted by Ford itself. The adjusted EPS excludes pre-tax special items (described above), tax special items and restructuring impacts in non-controlling interest.
All told, Ford’s adjusted EPS has the same trend as that of the adjusted EBIT. For example, Ford’s adjusted EPS dived during the COVID period but quickly recovered in the post-pandemic age.
As of fiscal 2023, Ford’s adjusted EPS totaled as much as $2.00, a record figure ever reported since fiscal 2016.
In short, Ford achieved record profitability in post-pandemic periods which is during the age of the EV.
Ford Blue, Ford Model e, Ford Pro, Ford Next, And Ford Credit
ford-profit-by-segment
(click image to expand)
The definitions of Ford Blue, Ford Model e, and Ford Pro are available here: Ford Blue, Ford Model e, Ford Pro, and Ford Next.
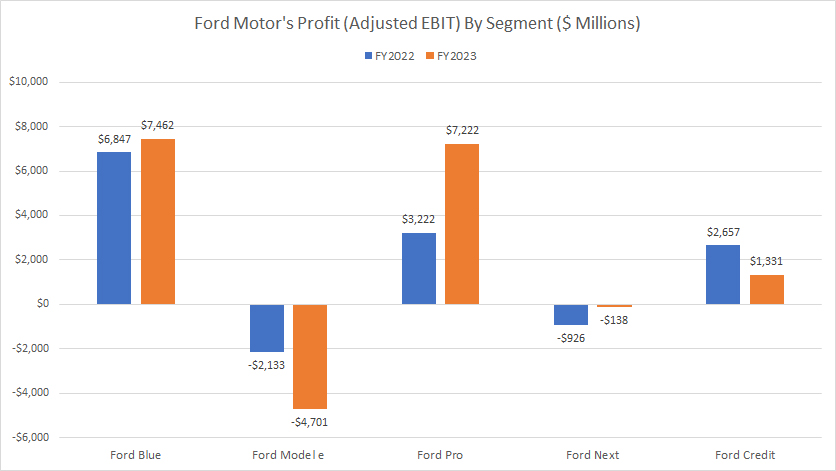
Ford new segments, including Ford Blue, Ford Model e, Ford Pro, and Ford Next have been set up since fiscal year 2023 due to re-organization.
That said, not all of Ford’s segments are profitable. For example, Ford Model e and Ford Next are the two segments which have consistently incurred losses. Ford Model e lossed nearly $5 billion in adjusted EBIT in fiscal year 2023, while Ford Next lossed $138 million in adjusted EBIT in the same year.
On the other hand, Ford Blue made a profit of $7.5 billion in adjusted EBIT in fiscal year 2023, while Ford Pro’s profitability came in at $7.2 billion in the same period.
Ford Credit made $1.3 billion in adjusted EBT in fiscal year 2023.
Automotive, Mobility, And Ford Credit
ford-profit-by-segment
(click image to expand)
This section is a legacy report. Ford is no longer providing the adjusted EBIT for the automotive and mobility segment. Ford’s mobility has been renamed to Ford Next.
Ford’s profitability by segment is evaluated based on the adjusted EBIT by segment. Again, the adjusted EBIT by segment is a non-GAAP measure provided by Ford Motor. The definition of the adjusted EBIT is available here: adjusted EBIT.
That said, Ford’s Automotive and Ford Credit are the only segments that make a profit while the Mobility is unprofitable.
Ford’s Automotive generated a record profit of $9.7 billion in adjusted EBIT in fiscal 2022, the highest among all segments.
Although the profit of Ford Automotive soared to record highs in post-pandemic periods, it dived considerably during the COVID crisis in 2020 and was even lower than that of Ford Credit, indicating the vulnerability of this business segment to a black-swan event like COVID-19.
On the other hand, the profit of Ford Credit looked solid during the pandemic and did not seem to be affected.
Lastly, the Mobility segment hasn’t been a profitable segment.
North America, South America, Europe, China, And IMG
ford-profit-by-region
(click image to expand)
This section is a legacy report. Ford is no longer providing the adjusted EBIT by region.
Ford’s profitability by region is evaluated based on the adjusted EBIT by region. Again, the adjusted EBIT by region is a non-GAAP measure provided by Ford Motor. The definition of the adjusted EBIT is available here: adjusted EBIT.
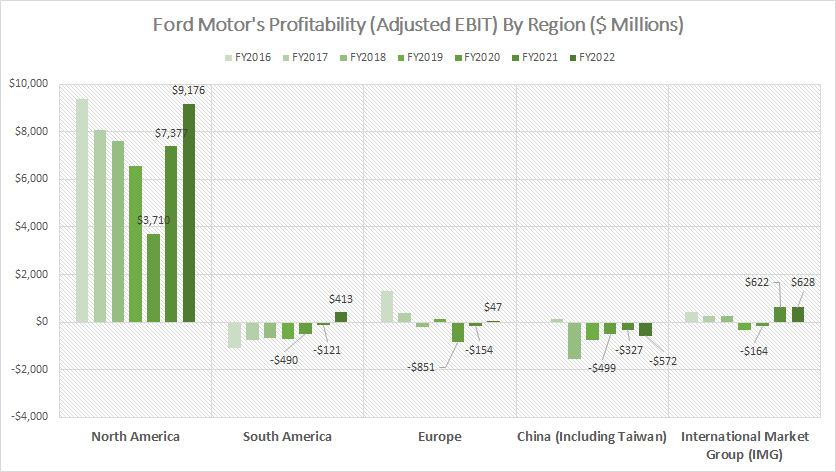
That said, Ford’s Automotive in North America seems like the only region contributing a profit to the company.
In addition, North America accounts for the bulk of the profit generated under the Automotive segment, and the latest result totaled as much as $9.2 billion in adjusted EBIT.
On the other hand, other regions such as South America, Europe, and China have barely made any profit. In particular, Ford China has incurred losses in most fiscal years, and the latest loss totaled more than $500 million in adjusted EBIT.
While North America has contributed profit to Ford, it has weaknesses. As seen in the chart above, Ford Automotive in North America saw its profit dived during the COVID crisis, illustrating that COVID-19 or anything similar in the future can severely reduce the profit of Ford’s automotive business.
Consolidated Profit Per Vehicle
ford-profit-per-car
(click image to expand)
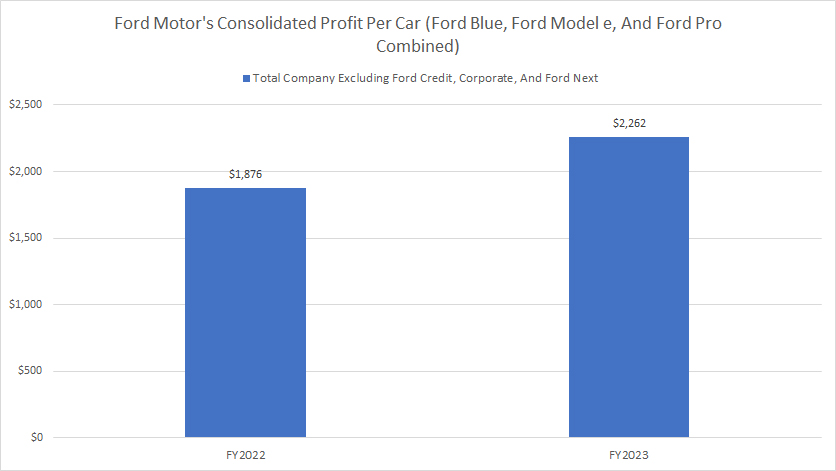
Ford’s consolidated profit per vehicle is evaluated based on the adjusted EBIT that we saw in prior discussions and is calculated as the consolidated adjusted EBIT of Ford Blue, Ford Model e, and Ford Pro, divided by vehicle wholesale.
The definition of the adjusted EBIT is available here: adjusted EBIT. The definitions of Ford Blue, Ford Model e, and Ford Pro are available here: Ford Blue, Ford Model e, and Ford Pro.
Ford’s profit per vehicle, essentially profit before taxes and interest expenses, totaled US$2,262 in fiscal 2023, a significant jump from the US$1,876 measured in 2022.
In short, Ford made an average of around $2,000 in profit per vehicle since 2022.
Profit Per Vehicle In Ford Blue, Ford Model e, And Ford Pro
ford-profit-per-car-by-segment
(click image to expand)
The definitions of Ford Blue, Ford Model e, and Ford Pro are available here: Ford Blue, Ford Model e, and Ford Pro.
Ford new segments, including Ford Blue, Ford Model e, Ford Pro, and Ford Next have been set up since fiscal year 2023 due to re-organization.
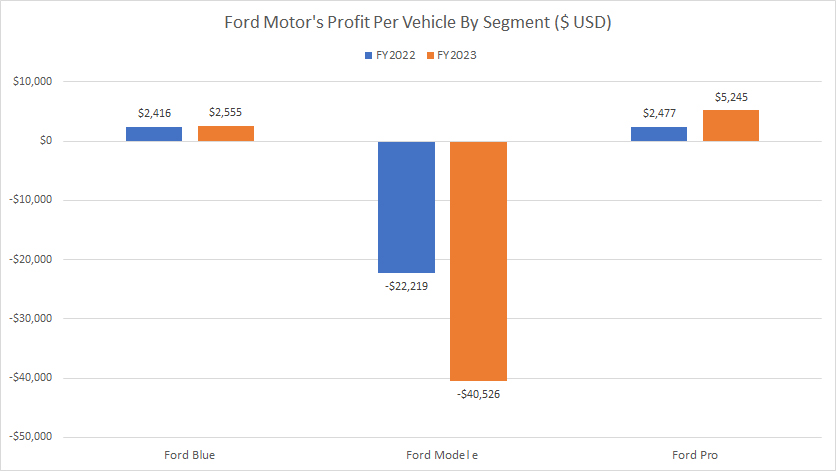
That said, Ford Blue and Ford Pro have appeared to be making a profit per vehicle, while Ford Model e has incurred losses per vehicle since fiscal year 2022.
As of fiscal year 2023, Ford Blue made $2,600 in profit per car, a moderate jump from the $$2,400 in profit per car measured in 2022.
Ford Pro generated twice the profit per car than Ford Blue in fiscal year 2023. As shown in the chart, Ford Pro produced a profit per vehicle of $5,200 in adjusted EBIT in fiscal year 2023, a significant rise over the $2,500 in profit per vehicle measured in 2022.
There is still a lot of work for Ford Model e to do as this segment has been having losses per car since 2022. In 2023, Ford Model e lossed over $40,500 per car, which was significantly worse off than the $22,200 loss reported in 2022.
Profit Per Vehicle In North America
ford-profit-per-car-in-North-America
(click image to expand)
This section is a legacy report. Ford is no longer providing the adjusted EBIT by region.
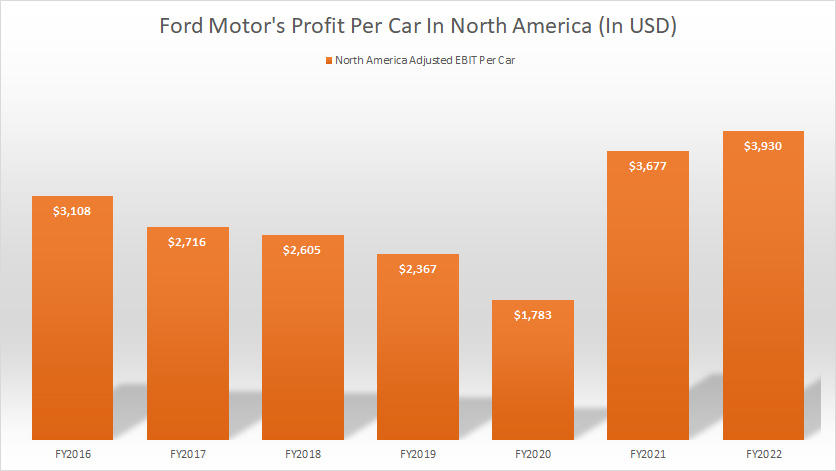
Ford’s profit per vehicle in North America is evaluated based on the adjusted EBIT that we saw in prior discussions and is calculated as the adjusted EBIT in North America divided by vehicle wholesale in North America excluding unconsolidated affiliates if there is any.
That said, Ford earned a profit of roughly $3,930 per vehicle in North America in fiscal 2022, probably the highest figure among all regions in Ford’s market.
Ford’s profit per car in North America has been relatively consistent, with the company making at least $2,000 per vehicle except in fiscal 2020.
A trend worth mentioning is that Ford’s profit per vehicle in North America soared significantly in the post-pandemic age, indicating the brisk business the company has been enjoying in the age of the EV.
Profit Per Vehicle In South America
ford-profit-per-car-in-South-America
(click image to expand)
This section is a legacy report. Ford is no longer providing the adjusted EBIT by region.
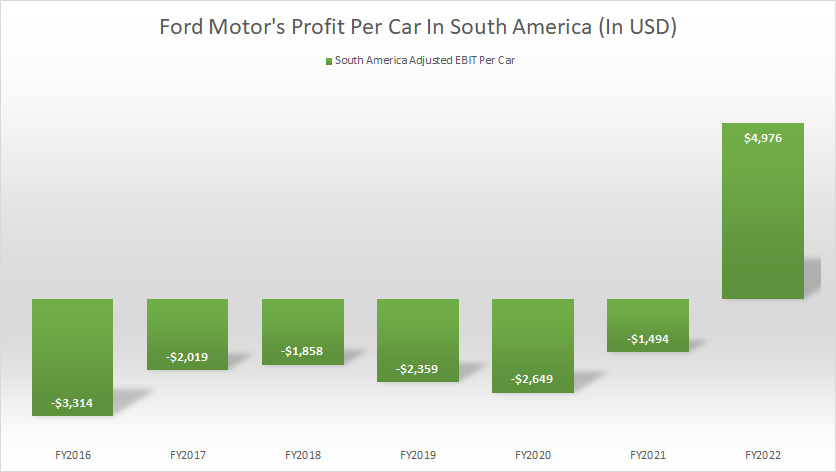
Ford’s profit per vehicle in South America is evaluated based on the adjusted EBIT that we saw in prior discussions and is calculated as the adjusted EBIT in South America divided by vehicle wholesale in South America excluding unconsolidated affiliates if there is any.
In South America, Ford’s profit per vehicle in this region totaled as much as $4,976 in fiscal 2022, which was even higher than that of North America in the same period.
Although Ford earned nearly $5,000 in profit per car in South America as of fiscal 2022, the figures are inconsistent.
Before 2022, Ford’s profit per car in South America was negative, illustrating that the company was losing money for every vehicle it sold.
In short, Ford has only started becoming profitable per car sold in South America in fiscal 2022.
Profit Per Vehicle In Europe
ford-profit-per-car-in-Europe
(click image to expand)
This section is a legacy report. Ford is no longer providing the adjusted EBIT by region.
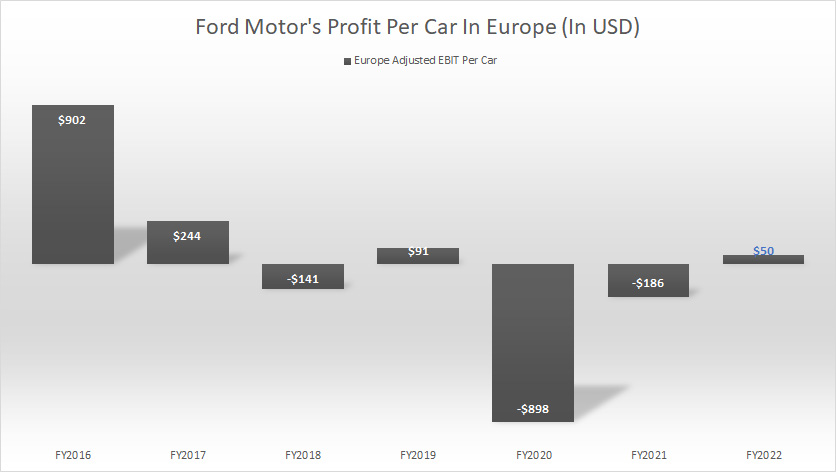
Ford’s profit per vehicle in Europe is evaluated based on the adjusted EBIT that we saw in prior discussions and is calculated as the adjusted EBIT in Europe divided by vehicle wholesale in Europe excluding unconsolidated affiliates if there is any.
Ford barely makes any profit per car in Europe.
As of fiscal 2022, Ford earned only $50 per vehicle in profit before interest and taxes, which was hardly a profit.
Before 2022, Ford barely made any profit per car sold in Europe and was seen as having losses in most fiscal years for every vehicle sold.
Profit Per Vehicle In China
ford-profit-per-car-in-China
(click image to expand)
This section is a legacy report. Ford is no longer providing the adjusted EBIT by region.
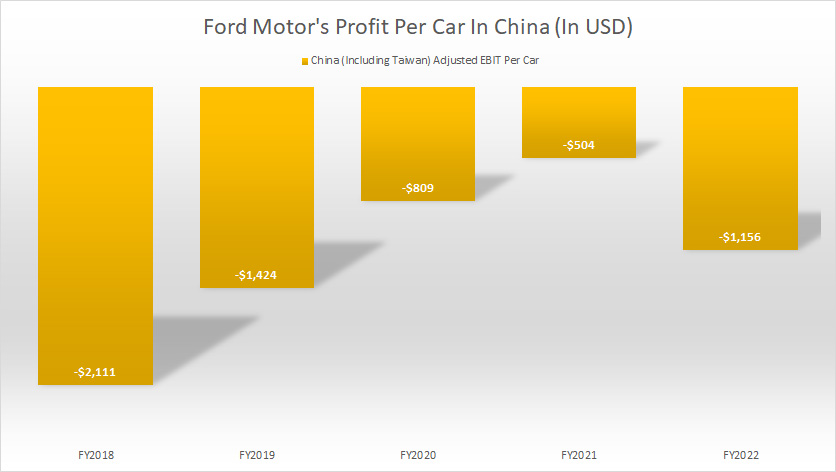
Ford’s profit per vehicle in China is evaluated based on the adjusted EBIT that we saw in prior discussions and is calculated as the adjusted EBIT in China divided by vehicle wholesale in China excluding unconsolidated affiliates if there is any.
Ford China is probably the region with the most significant loss for every vehicle sold.
Between fiscal 2018 and 2022, Ford produced no profit per vehicle in China. Instead, Ford’s loss per vehicle in China dwindled to more than $1,000 in fiscal 2022, the largest ever reported over the past 3 years.
Profit Per Vehicle In IMG
ford-profit-per-car-in-IMG
(click image to expand)
This section is a legacy report. Ford is no longer providing the adjusted EBIT by region.
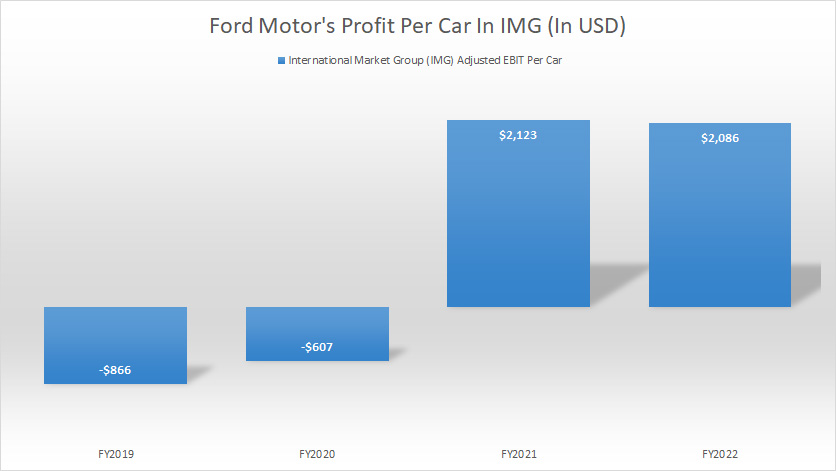
Ford’s profit per vehicle in IMG is evaluated based on the adjusted EBIT that we saw in prior discussions and is calculated as the adjusted EBIT in IMG divided by vehicle wholesale in IMG excluding unconsolidated affiliates if there is any.
IMG refers to regions not separately presented.
That said, Ford made a profit of roughly $2,000 per car under this segment. This figure came in at $2,100 in fiscal 2021 and 2022, respectively, making the IMG one of the most profitable regions in Ford’s market.
Summary
Of all the segments, Ford Blue and Ford Pro produced the most profit per car for the company.
However, Ford Model e has not been a profitable segment, with loss per vehicle soaring to $40,500 in fiscal year 2023.
References and Credits
1. All financial figures presented in this article were obtained and referenced from Ford’s SEC filings, earning releases, quarterly and annual reports, investor presentations, etc., which are available in the following location: Ford Investors Overview.
2. Featured images in this article are used under creative commons license and sourced from the following websites: Robert GLOD and Steve Shotwell.
Disclosure
References and examples such as tables, charts, and diagrams are constantly reviewed to avoid errors, but we cannot warrant the full correctness of all content.
The content in this article is for informational purposes only and is neither a recommendation nor a piece of financial advice to purchase a stock.
If you find the information in this article helpful, please consider sharing it on social media and also provide a link back to this article from any website so that more articles like this one can be created in the future.
Thank you!


