General Motors Canada. Flickr Image.
General Motors (NYSE: GM) is a leading automaker specializing in the design and manufacture of cars, trucks and SUVs.
GM generates well over $100 billion in sales annually.
As early as 1Q 2021, General Motors announced an ambitious plan to accelerate the mass adoption of electric vehicles by introducing the Ultium platform and launching a new portfolio of 30 electric vehicles.
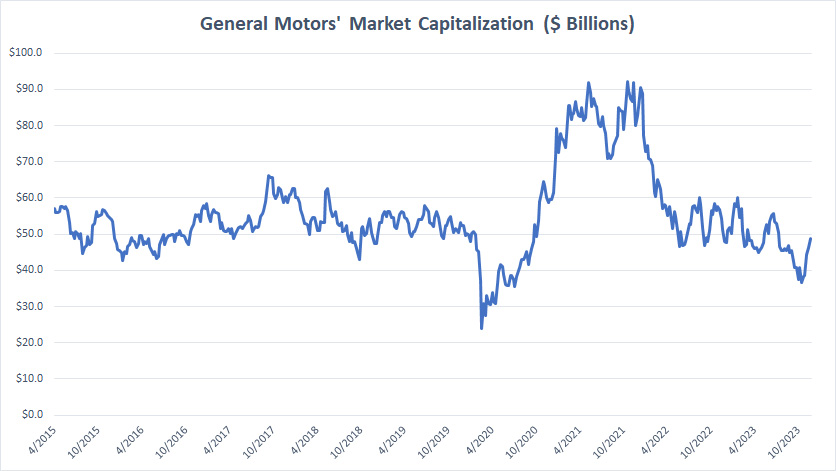
Since then, the company’s stock prices have soared considerably, bringing the company’s market cap to over $90 billion.
GM’s $90 billion market cap was never seen anywhere in the last six years, from 2015 to 2021.
However, GM’s market cap has considerably declined in the post-pandemic era.
As of Dec 2023, GM’s market capitalization was only $50 billion.
Is GM’s market cap worth this much? Let’s take a look.
In this article, we will look at GM’s stock valuation from the perspective of several ratios.
These ratios include market capitalization, price to revenue or sales (price to sales), price to total equity (price to book value), price to earnings, etc.
Apart from these ratios, we also look at valuation based on the discounted cash flow model and compare GM’s valuation with the industry and its peers.
Let’s dive in!
Please use the table of contents to navigate this page.
Table Of Contents
Market Cap
Share Price Vs Fair Value
A1. Share Price Based On Discounted Cash Flow
Historical Valuation
B1. Price To Sales Ratio
B2. Price To Earnings Ratio
B3. Price To Book Ratio
Valuation Vs Peers
C1. PS Ratio Vs Peers (ICE Players)
C2. PS Ratio Vs Peers (EV Players)
C3. PE Ratio Vs Peers (ICE Players)
Valuation Vs Industry
D1. PS Ratio Vs Industry
D2. PE Ratio Vs Industry
Analyst Price Target
E1. Latest Share Price Vs Price Target
Conclusion And Reference
S1. Conclusion
S2. References and Credits
S3. Disclosure
Market Capitalization
GM market capitalization
(click image to expand)
* Market cap data comes from the author’s calculation.
* Market cap is calculated using the weekly and adjusted close price for splits.
Before diving into the valuation, let’s have a quick look at General Motors’ market capitalization which is shown in the chart above for the period from 2015 to 2023.
Historically, GM’s market cap averaged around $50 billion but soared to over $90 billion in 2021 during the EV revolution.
This was the time when GM announced its ambitious US$35 billion electrification plan.
Since the announcement, GM’s market cap exceeded US$90 billion at some time in 2021, boosted by solid earnings and revenue during the post-pandemic periods.
However, GM’s market cap has slowly declined post-2021, especially in 2023, when it reached only US50 billion as of Dec.
Is GM’s EV roadmap in doubt? Are investors concerned about GM’s electrification plan?
Share Price Based On Discounted Cash Flow
General-Motors-share-price-based-on-discounted-cash-flow
(click image to expand)
* Data comes from Simpy Wall St.
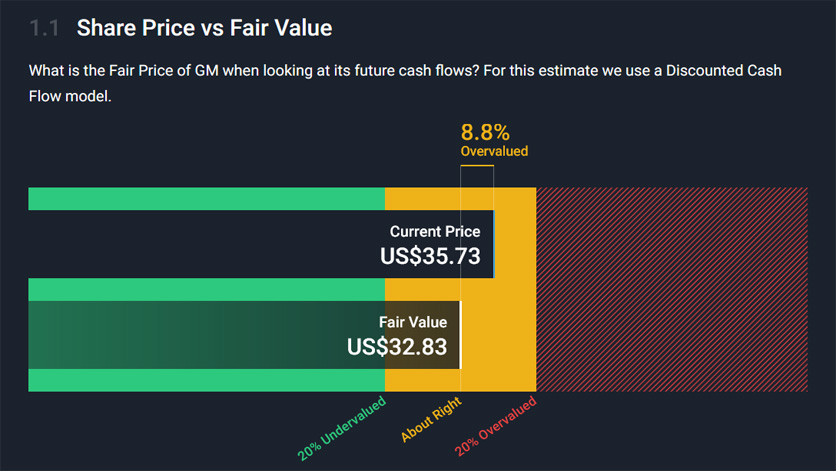
GM’s share price was traded at US$35.7 as of Dec 2023.
GM’s current share price was slightly overvalued at 8.8% compared to the fair value estimated based on discounted cash flow.
While slightly overvalued, GM’s market valuation was not that far off from the valuation given by the discounted cash flow model.
In short, the market has valued General Motors stock roughly the same as its fair value.
Price To Sales Ratio
General-Motors-price-to-sales-ratio
(click image to expand)
* Data comes from Simpy Wall St.
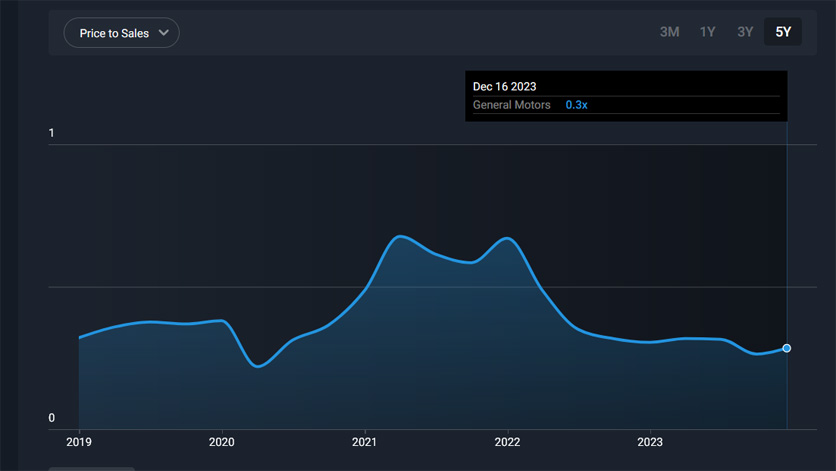
As of Dec 2023, GM’s stock was traded at only 0.3X of its sales, a seemingly low ratio.
Historically, GM’s price-to-sales ratio has never gone over 1.0X.
The highest price-to-sales ratio that investors were willing to pay for GM stock was around 0.7X in 2021, which was when the EV revolution started.
Price To Earnings Ratio
General-Motors-price-to-earnings-ratio
(click image to expand)
* Data comes from Simpy Wall St.
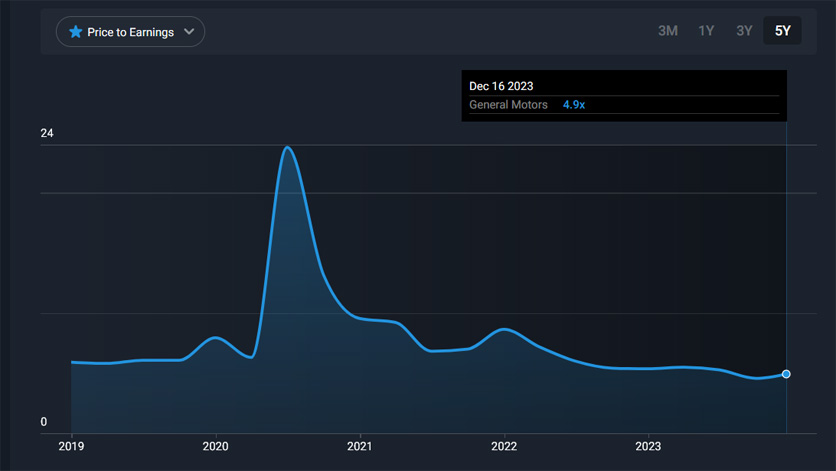
GM’s PE or price-to-earnings ratio was 4.9X as of Dec 2023, roughly in line with its historical average.
The 4.9X PE ratio was seemingly low, implying that investors are unwilling to pay more for GM’s stock.
Price To Book Ratio
General-Motors-price-to-book-ratio
(click image to expand)
* Data comes from Simpy Wall St.
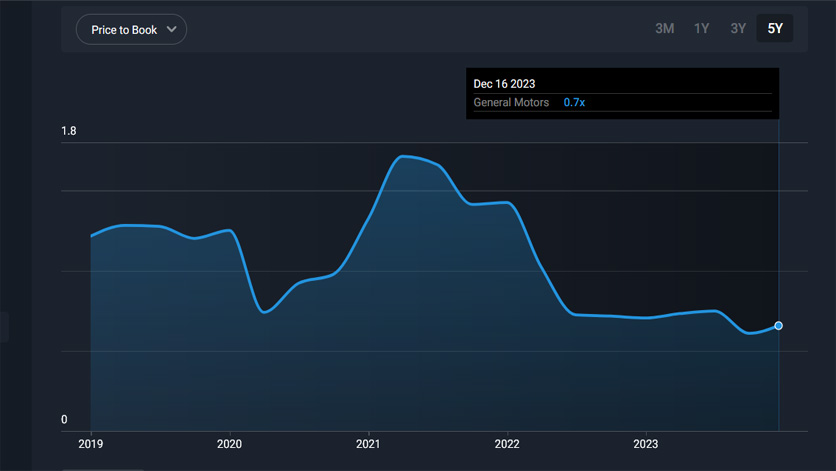
As of Dec 2023, GM’s stock was valued at only 0.7X of its book value, which is also a considerably low ratio.
This figure was the lowest since 2019 and was about 30% below its historical average of around 1.0X.
Again, the low price-to-book ratio indicates that investors are unwilling to pay more for GM’s stock.
PS Ratio Vs Peers (ICE Players)
General-Motors-ps-ratio-vs-peers-ice-players
(click image to expand)
* Data comes from Simpy Wall St.
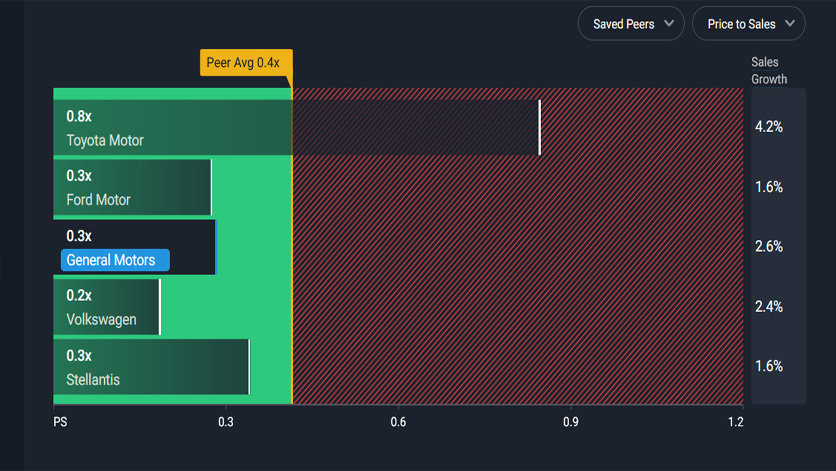
Compared to peers specializing in ICE vehicles, GM’s stock is valued at about the same valuation as its peers, as shown in the snapshot above.
For example, Ford Motor, Volkswagen, and Stellantis were all valued at a price-to-sales ratio of 0.3X, about the same as GM’s.
On the other hand, Toyota Motor’s market valuation with respect to sales of 0.8X was much higher than GM’s figure, most likely helped by the higher estimated forward sales growth of 4.2% compared to the rest, which averaged only about 2%.
PS Ratio Vs Peers (EV Players)
General-Motors-ps-ratio-vs-peers-ev-players
(click image to expand)
* Data comes from Simpy Wall St.
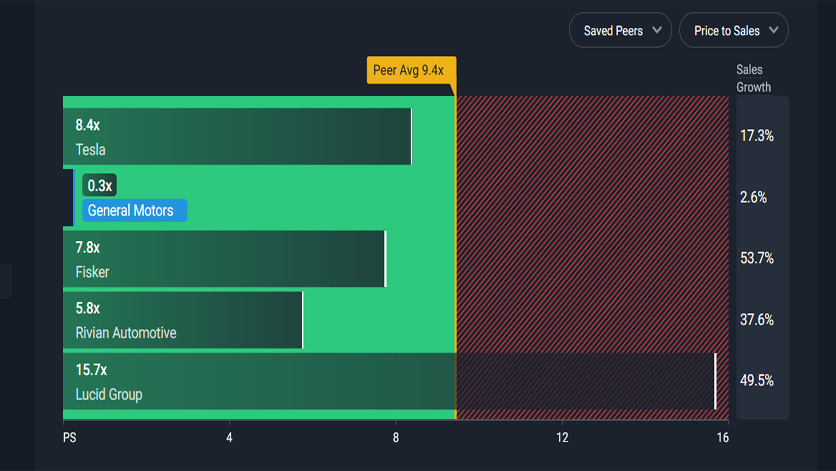
When we compared GM’s price-to-sales valuation with automotive players specializing in electric vehicles, GM’s ratio lagged by a massive margin.
For example, the average price-to-sales ratio for Tesla, Fisker, Rivian Automotive, and Lucid Group was around 9.4X, a far higher figure than GM’s ratio of 0.3X.
In short, investors are willing to pay a premium for EV players but not for ICE players like General Motors, even though the company has already committed to electrification.
PE Ratio Vs Peers (ICE Players)
General-Motors-pe-ratio-vs-peers-ice-players
(click image to expand)
* Data comes from Simpy Wall St.
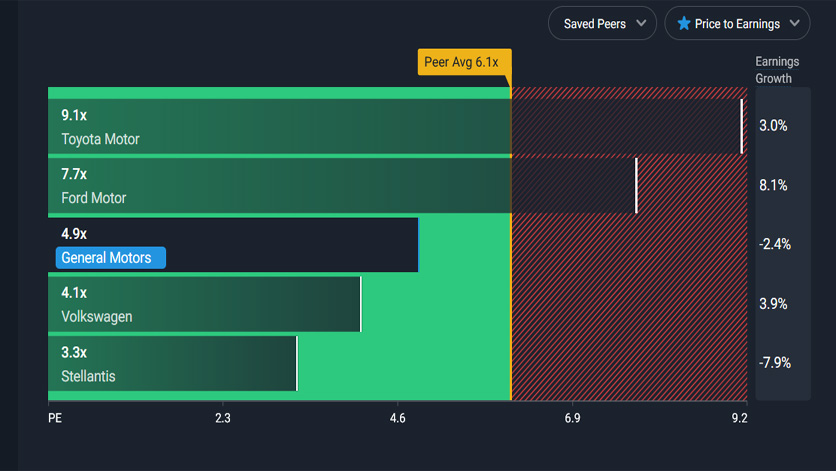
GM’s stock valuation with respect to earnings was in the middle compared to its peers, as shown in the snapshot above.
For example, GM’s PE ratio of 4.9X was slightly higher than Volkswagen and Stellantis but significantly lower than Toyota Motor and Ford Motor.
Among all companies in comparison, Ford Motor’s estimated forward earnings growth was among the highest at 8.1%.
PS Ratio Vs Industry
General-Motors-ps-ratio-vs-industry
(click image to expand)
* Data comes from Simpy Wall St.
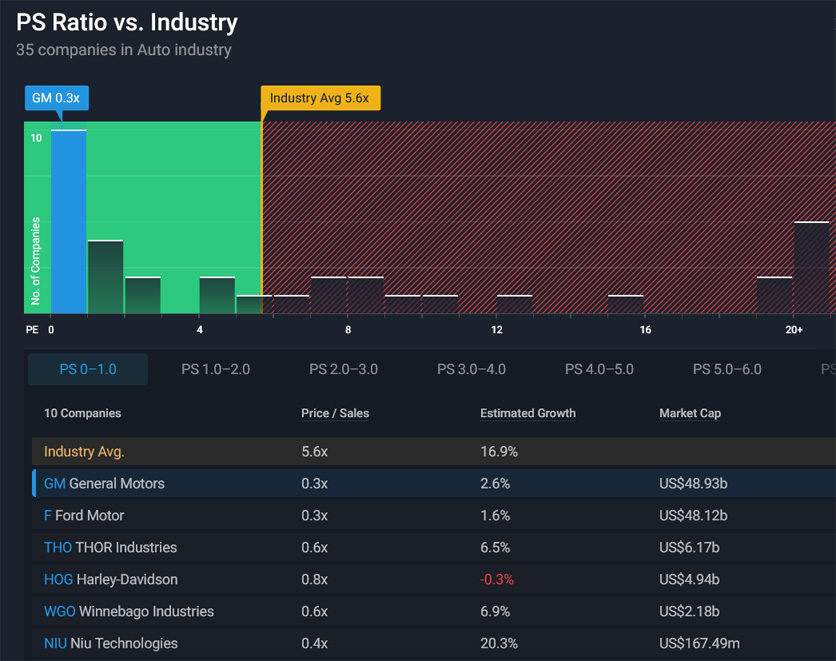
As shown in the snapshot above, GM’s market valuation against the industry ranked at the bottom.
For example, the price-to-sales ratio averaged 5.6X within the automotive industry, while GM’s ratio was 0.3X, a far lower figure than the industry average.
PE Ratio Vs Industry
General-Motors-pe-ratio-vs-industry
(click image to expand)
* Data comes from Simpy Wall St.
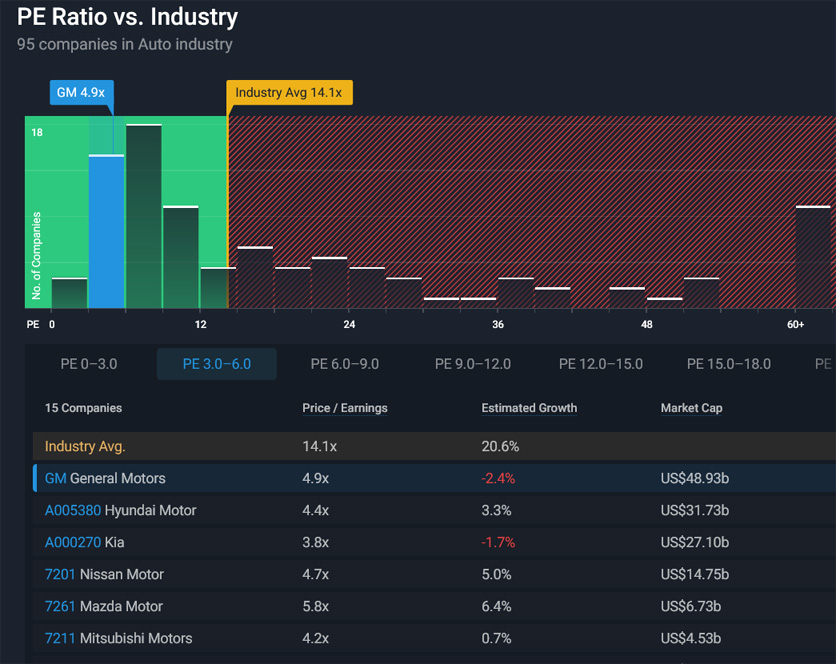
Similarly, GM’s market valuation with respect to earnings was seen to rank at the bottom when compared with the industry.
The PE ratio for the automotive industry averaged around 14.1X, while GM’s figure was only 4.9X, implying a significantly low valuation for the automaker.
Investors’ low valuation of General Motors is likely due to GM’s negative forward earnings growth, while the industry average was 20.6%, as shown in the snapshot above.
Latest Share Price Vs Price Target
General-Motors-share-price-target
(click image to expand)
* Data comes from Simpy Wall St.
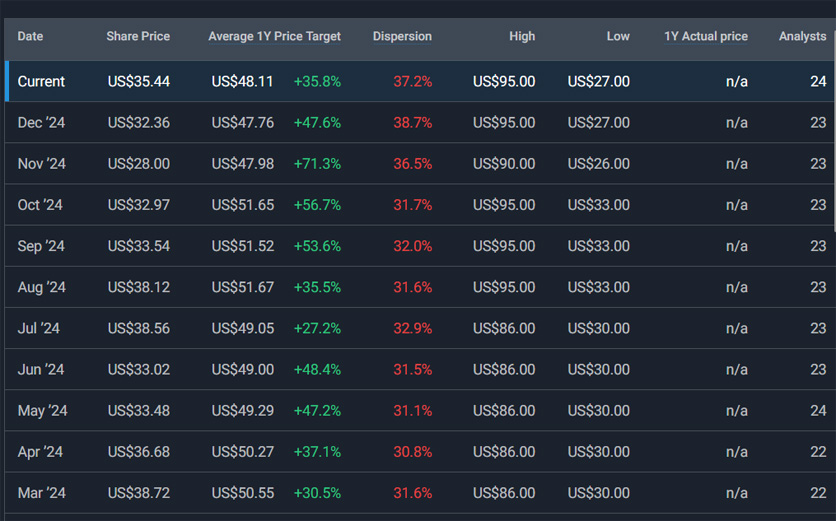
GM’s share price target was around US$48 on average, based on the forecast of 24 analysts.
That means there is a 36% upside to GM’s share price of US$35 as of Dec 2023.
For the past nine months since March 2023, GM’s share price target has remained relatively unchanged, according to 20+ analysts.
Conclusion
General Motors’ share price has been relatively stable in recent months despite the company’s commitment to becoming an all-electric automobile company.
However, investors are unwilling to pay a premium for GM’s stock compared to electric vehicle (EV) players.
Despite this, the company’s long-term strategy and investments in the EV market may benefit its future share price.
References and Credits
1. All financial figures presented in this article were obtained and referenced from Yahoo Finance and Simply Wall St’s premium account, which can be accessed at these links: Yahoo Finance and Simply Wall St – GM Valuation.
3. Featured images were used under Creative Common License and obtained from marc falardeau and Can Pac Swire.
Disclosure
References and examples such as tables, charts, and diagrams are constantly reviewed to avoid errors, but we cannot warrant the total correctness of all content.
The content in this article is for informational purposes only and is neither a recommendation nor a piece of financial advice to purchase a stock.
If you find the information in this article helpful, please consider sharing it on social media and provide a link to this article from any website so that more articles like this can be created.
Thank you!

