Looking at a GM’s building at a traffic light stop. Source: Flickr Image
The survival of General Motors (NYSE: GM) depends on its ability to manage its debt, particularly in covering its interest expenses. In simpler terms, if GM can pay off its interest costs, it can avoid going out of business or bankruptcy.
To analyze GM’s ability to cover interest expenses, we will examine its operating income and adjusted EBIT (adjusted earnings before interest and tax). These metrics will be compared to the incurred interest costs. It’s important to note that operating income and adjusted EBIT refer to profits generated before taxes and interest expenses.
By analyzing GM’s interest expense coverage with respect to the profitability metrics, we can calculate the interest coverage ratio or the time’s interest earned ratio. This will show us how well General Motors manages its incurred interest costs.
Apart from the interest expense coverage ratio, we also explore General Motors’ short-term liabilities. The short-term liabilities refer to GM’s obligations expected to come due within one year or within its normal operating cycle, whichever is longer.
These liabilities are a key component in assessing GM’s financial health and liquidity. Examples of short-term liabilities include accounts payable, short-term loans, income taxes payable, bank overdrafts, accrued expenses, and other debts due within a year.
Monitoring GM’s short-term liabilities is crucial for understanding the company’s immediate financial commitments and its ability to meet those obligations with available assets.
Let’s explore!
Please use the table of contents to navigate this page.
Table Of Contents
Definitions And Overview
O2. How Does General Motors Use Its Debt
Interest Expense
A1. Automotive Interest Expense
Income
B1. Operating Income
B2. Adjusted EBIT (Adjusted Earnings Before Interest And Tax Expenses)
Interest Coverage Ratio
C1. Interest Coverage With Respect to Operating Income
C2. Interest Coverage With Respect to Adjusted EBIT
Short-Term Liabilities
D1. Total Short-Term Liabilities
Assets And Liquidity
E1. Total Current Assets And Available Liquidity
Summary And Reference
S1. Summary
S2. References and Credits
S3. Disclosure
Definitions
To help readers understand the content better, the following terms and glossaries have been provided.
Interest Coverage Ratio: The Interest Coverage Ratio (ICR) is a financial metric that determines how well a company can pay the interest on its outstanding debt. It is calculated by dividing a company’s earnings before interest and taxes (EBIT) by its interest expenses for the same period. The formula looks like this:
Interest Coverage Ratio = Earnings Before Interest and Taxes (EBIT) / Interest Expenses
A higher ratio indicates that the company is more capable of meeting its interest obligations from operating earnings, suggesting better financial health. Conversely, a lower ratio suggests the company may have difficulty covering its interest payments, indicating potential financial strain. This ratio is of particular interest to lenders and investors as it provides insight into the risk associated with lending to or investing in the company.
Adjusted EBIT: General Motors presents the EBIT-adjusted net of non-controlling interests.
This non-GAAP measure is used by GM’s management and can be used by investors to review the company’s consolidated operating results because it excludes automotive interest income, automotive interest expense and income taxes, and certain additional adjustments that are not considered part of its core operations.
Examples of adjustments to EBIT include but are not limited to, impairment charges on long-lived assets and other exit costs resulting from strategic shifts in operations or discrete market and business conditions and certain costs arising from legal matters.
How Does General Motors Use Its Debt
General Motors (GM) uses its debt as part of its capital structure strategy, which is a mix of equity, debt, and internal financing used to fund its operations, investments, and growth. Debt financing gives GM the capital necessary to invest in new technologies, expand operations, and compete in the global automotive market. Here’s a breakdown of how GM utilizes its debt:
1. **Investment in Research and Development (R&D):** The automotive industry is highly competitive and rapidly evolving, especially with the shift towards electric vehicles (EVs), autonomous driving technology, and sustainable practices. GM uses debt financing to invest heavily in R&D to innovate, develop new products, and stay competitive.
Investors interested in GM’s R&D spending may find more information on this page: GM research and development versus Tesla.
2. **Capital Expenditures:** GM allocates a portion of its borrowed funds for capital expenditures to modernize manufacturing facilities, increase production capacity, and improve efficiency. This includes investments in new plants, equipment, and technology upgrades, which are crucial for maintaining and enhancing its production capabilities.
3. **Acquisitions and Strategic Partnerships:** GM occasionally uses debt to finance acquisitions and form strategic partnerships that align with its strategic objectives. This can include acquiring startups in the EV space, investing in battery technology firms, or forming alliances with other automotive companies to share technology and development costs.
4. **Refinancing Existing Debt:** GM may also use new debt issuances to refinance existing debt. This can be done to take advantage of lower interest rates, extend maturity dates, or improve terms and conditions, thereby reducing the cost of capital and improving its financial flexibility.
5. **Working Capital and Operational Needs:** Debt is also used to fund day-to-day operations and manage working capital requirements. This ensures that GM has the liquidity to meet its short-term obligations, such as paying suppliers and employees and covering other operating expenses.
Investors interested in GM’s working capital and operational needs may find more information on this page: GM liquidity ratio.
6. **Weathering Economic Downturns:** In times of economic downturns or industry-specific challenges, GM might leverage debt to navigate through periods of reduced cash flow or sales. This provides a financial cushion to sustain operations without significantly scaling back on essential investments or operations.
It’s important to note that while debt is a useful tool for financing growth and operations, excessive reliance on debt increases financial risk, especially if the company’s earnings are not sufficient to cover interest payments and principal repayments. Therefore, GM and other companies carefully manage their debt levels and interest coverage ratios to maintain financial health and stability.
Automotive Interest Expense
General Motors’ interest expenses
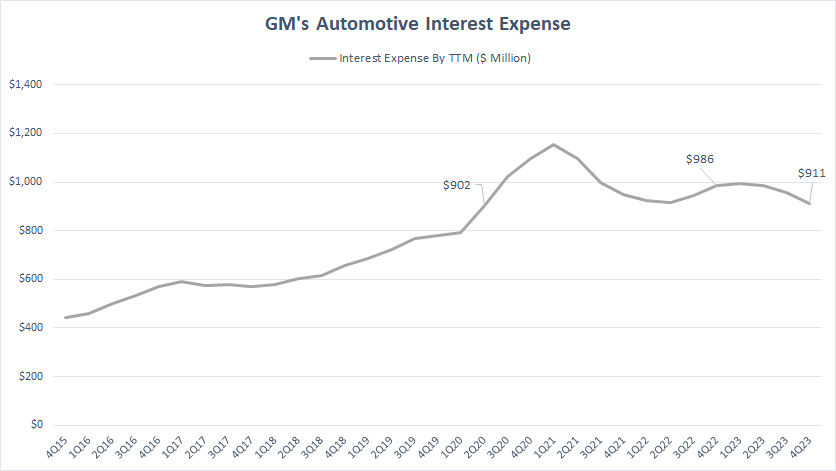
Before we dive into the ratios, let’s take a quick look at General Motors (GM) incurred interest expenses from fiscal 2015 to fiscal 2023. As shown in the chart above, please note that GM’s incurred interest expense came entirely from its automotive segment.
These interest costs are a direct result of the automotive debt that GM holds on its balance sheets. As per this article on GM debt, GM carried around $16 billion in automotive debt as of the end of fiscal 2023. Additionally, GM’s automotive debt has been steadily increasing over the years, reaching record highs in fiscal 2023.
As a result, GM’s automotive interest expense has also been increasing, surpassing the $1 billion mark for the first time in fiscal 2020 on a TTM basis. As of fiscal 4Q 2023, GM’s automotive interest expense reached $911 million.
Since 2015, GM’s automotive interest expense has more than doubled, from around $400 million to nearly $1 billion as of fiscal 2023. This increase in GM’s automotive interest expense is a direct result of the company’s rising debt levels over the years.
In summary, GM pays nearly $1 billion in interest expense annually. This amount will continue growing as long as the company accumulates more automotive debt.
Operating Income
gm-operating-income
(click image to expand)
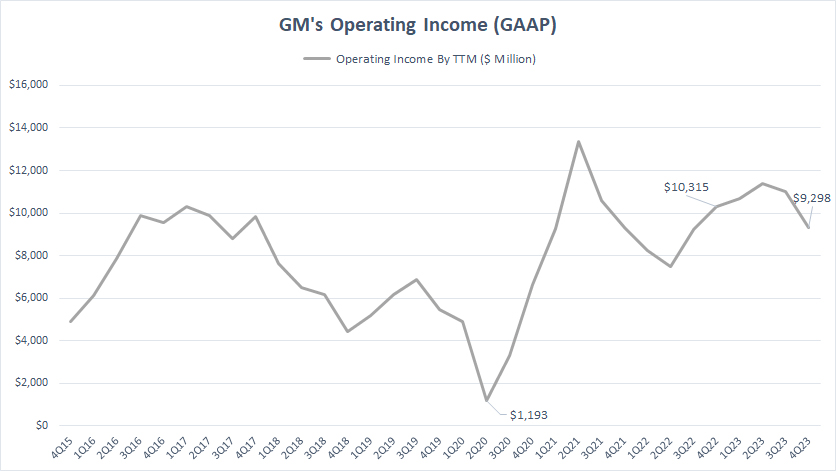
After examining the expenses, we delved into General Motors’ income to determine how well the company manages its interest expenses. Specifically, we focused on GM’s operating income.
The chart illustrates that General Motors generated significant operating income, exceeding $10 billion during the post-COVID period. The lowest point for GM’s operating income was $1.2 billion, which occurred at the onset of the COVID-19 pandemic in 2020.
Throughout most periods, GM’s operating income has been more than sufficient to cover the interest expense, which we discussed earlier, amounts to only about $1 billion. Even in the worst-case scenario, GM’s operating income still adequately covers the corresponding interest expense.
As a result, it appears that GM generates enough operating income to cover its interest expenses. The possibility of GM continuing to thrive in the future seems high, as the company’s business prospects have greatly improved in the post-COVID period.
Adjusted EBIT (Adjusted Earnings Before Interest And Tax Expenses)
gm-adjusted-ebit
(click image to expand)
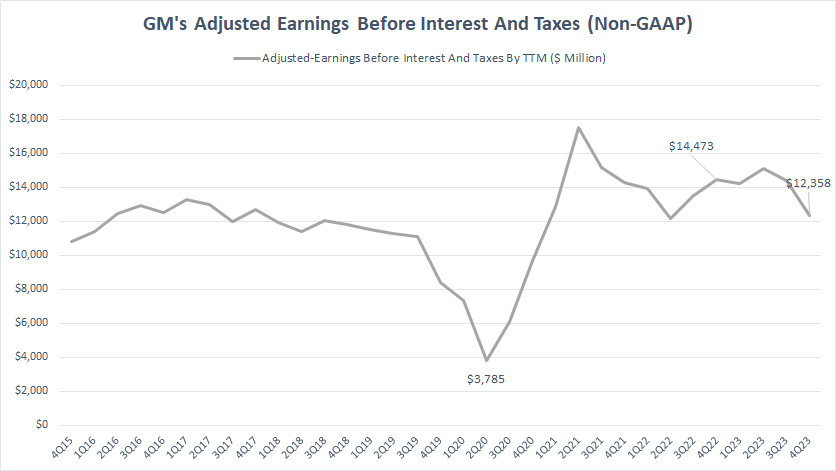
The adjusted EBIT is similar to the operating income, which we saw in an earlier discussion, except that it is a non-GAAP measure which excludes certain non-recurring and irregular expenses and incomes. The definition of GM’s adjusted EBIT is available here: adjusted EBIT.
GM has consistently generated a substantial amount of adjusted EBIT, exceeding $12 billion throughout most of the post-COVID periods. GM’s lowest adjusted EBIT generated was $3.8 billion, which happened in 2020 at the onset of the COVID-19 pandemic.
Therefore, GM generates enough adjusted EBIT during most periods, which is sufficient to cover the corresponding interest expenses, even in the worst case scenario.
The good news is that GM’s business prospects have greatly improved in post-pandemic periods. The likelihood of General Motors going bankrupt does not seem to arise.
Interest Coverage With Respect To Operating Income
General Motors’ interest coverage ratio with respect to operating income
The definition of GM’s interest coverage ratio is available here: interest coverage ratio.
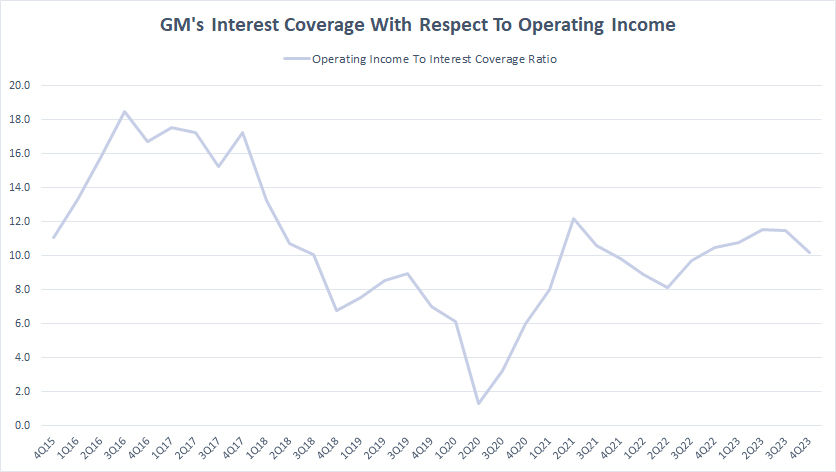
Looking at the chart above, we can see that GM’s interest coverage ratio with respect to operating income has been decreasing since fiscal 2015. In fiscal 2Q 2020, the ratio hit a low of 1.3X, the lowest since fiscal 2015.
Despite the decline in GM’s interest coverage ratio during the COVID period, the ratio remained above 1.0X, indicating that the company’s operating income had sufficiently covered its interest expenses. After fiscal 2020, GM’s interest coverage ratio has improved significantly.
By fiscal 4Q 2023, GM’s interest coverage ratio exceeded 10.0X, a level last seen in fiscal 2018. This rise in the interest coverage ratio suggests that GM’s ability to service its debt has improved in the post-pandemic world.
However, it should be noted that GM’s interest coverage ratio is still considerably lower than its historical high of 16X reported in fiscal 2016 and 2017. Therefore, the company is not entirely out of the woods yet, and the ratio may decrease again if business conditions worsen.
As of the writing of this article, GM’s interest coverage ratio was solid, indicating that its operating income was more than sufficient to cover its interest expenses.
Interest Coverage With Respect to Adjusted EBIT
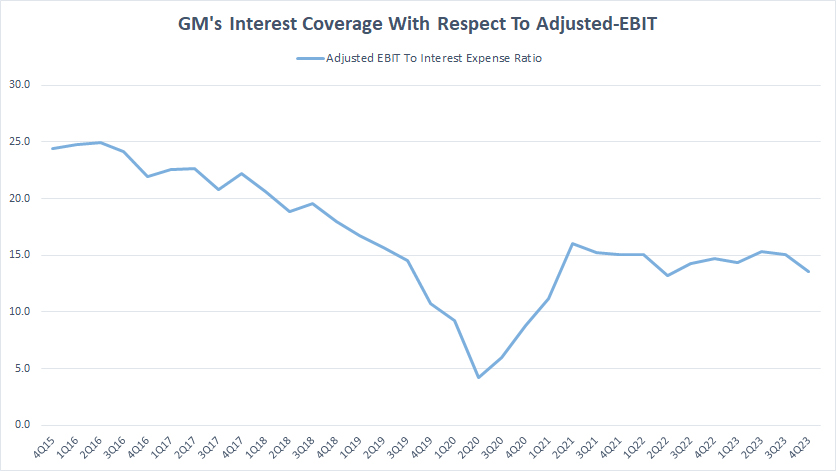
General Motors’ interest coverage ratio with respect to adjusted EBIT
The adjusted EBIT is similar to the operating income but has been adjusted to exclude certain items considered not part of the company’s core operations. Therefore, the adjusted EBIT specifically measures General Motors’ core performance without being distorted by non-core items and is a good metric to measure GM’s debt coverage. The definitions of GM’s adjusted EBIT and interest coverage ratio are available here: adjusted EBIT and interest coverage ratio.
Looking at the chart, GM’s interest coverage ratio in relation to adjusted EBIT shows a similar trend to operating income. The ratio has been declining since fiscal 2016 and reached its lowest point of 4.2X in fiscal 2Q 2020, which was when the COVID-19 pandemic started.
Despite this low ratio, GM’s adjusted EBIT remained significantly above its incurred interest costs. This means that GM could still cover its interest costs with a ratio of more than 4X.
However, GM’s interest coverage ratio subsequently rebounded, reaching as high as 15X in fiscal 2023. At this ratio, GM’s adjusted EBIT was more than enough to cover the incurred interest costs.
This significant rise in the interest coverage ratio since fiscal 2021 demonstrates GM’s improving core performance, and the company should have no trouble servicing its debt.
Total Short-Term Liabilities
General Motors short-term liabilities are obtained from the 2023 annual report dated 31 Dec 2023.
| Current Liabilities | Amount In Million USD |
|---|---|
| Accounts payable | $28,114 |
| Short-term debt and current portion of long-term debt | |
| Automotive | $428 |
| GM Financial | $38,540 |
| Accrued liabilities | $27,364 |
| Total Current Liabilities | $94,445 |
General Motors’ total liabilities due within one year from Dec 31 2023, totaled $94.4 billion, according to the 2023 annual report.
These short-term liabilities include accounts payable, short-term debt and current portion of long-term debt, and accrued liabilities.
Does General Motors have the available cash or any other assets to meet these obligations that will be due within a year from the date of its annual report?
Let’s find out.
Total Current Assets And Available Liquidity
GM’s assets and liquidity data are obtained from the 2023 annual report dated 31 Dec 2023.
| Assets And Liquidity | USD In Billions | |
|---|---|---|
| Committed Capacity | Available Capacity | |
| Consolidated | ||
| Cash & Cash Equivalents | – | $18.9 |
| Marketable Securities | – | $7.6 |
| Accounts Receivable | – | $12.4 |
| GM Financial receivables, | – | $39.1 |
| Total Consolidated | – | $78.0 |
| Automotive | ||
| Credit Facilities | $16.4 | $15.7 |
| Operating Cash Flow | – | $16.5 (Estimated) |
| Total Automotive | – | $32.2 |
| GM Financial | ||
| Total Borrowing Capacity | $24.6 | $24.6 |
| Operating Cash Flow | – | $6.5 (Estimated) |
| Total GM Financial | – | $31.1 |
| Total Liquidity | ||
| Total | – | $141.3 |
| Total Excluding Operating Cash Flow | – | $118.3 |
General Motors has an estimated total immediate assets and liquidity of $141 billion, which includes operating cash flow. If we exclude operating cash flow, the estimated total immediate assets and liquidity is $118 billion.
These figures appear sufficient to cover the total current liabilities of $94 billion, which are expected to be due within a year.
Hence, it seems that GM has enough assets and liquidity to meet its obligations, and the possibility of the company going out of business or bankrupt in 2024 does not arise.
Conclusion
To sum up, General Motors (GM) has seen a rise in its automotive interest expenses, which reached almost $1 billion on a trailing twelve-month (TTM) basis as of fiscal year 4Q 2023. However, despite the increasing interest expenses, GM’s interest coverage ratios in relation to operating income and adjusted EBIT have also increased significantly. This shows that the company’s core operations have improved and can cover the incurred interest costs.
As of fiscal 4Q 2023, both ratios have increased to 10.0X and 15.0X, respectively, which indicates sufficient income coverage of the corresponding interest expenses. Besides having adequate income for interest expenses, GM has enough assets to cover the upcoming short-term liabilities. In this case, GM’s total liquidity of $118 billion, excluding operating cash flow, is much higher than the total short-term obligations.
In conclusion, it is highly unlikely that GM will go out of business, as its financial health as of fiscal Q4 2023 was on solid ground based on the expanding interest coverage ratio and the much larger asset base for the total short-term liabilities.
References and Credits
1. All financial figures presented in this article were obtained and referenced from GM’s annual and quarterly reports, SEC filings, investors presentations, press releases, earnings reports, etc., which are available in GM Investor Relations.
2. Featured images in this article are used under Creative Commons License and sourced from the following websites: raymondclarkeimages and Craig Morey.
Disclosure
References and examples such as tables, charts, and diagrams are constantly reviewed to avoid errors, but we cannot warrant the total correctness of all content.
The content in this article is for informational purposes only and is neither a recommendation nor a piece of financial advice to purchase a stock.
If you find the information in this article helpful, please consider sharing it on social media and provide a link to it from any website to create more articles like this.
Thank you!

