MEA. Pixabay image.
Stellantis is a global automotive group formed in January 2021 after the merger of two major car manufacturers, PSA Group and Fiat Chrysler Automobiles (FCA). With a presence in over 130 countries, Stellantis is one of the largest automotive companies in the world.
In the Middle East and Africa, Stellantis has a strong presence with a wide range of popular brands, including Peugeot, Citroën, DS Automobiles, Fiat, Alfa Romeo, Chrysler, Jeep, and RAM. The company’s regional operations are managed by Stellantis Middle East and Africa (MEA), headquartered in Dubai, United Arab Emirates.
This article covers Stellantis’ vehicle sales and market share in the Middle East & Africa, as well as its competitive position in this region versus its competitors.
For other key statistics of Stellantis, you may find more resources on these pages:
Revenue
- Stellantis wholesale, revenue breakdown, and profit margin,
- Stellantis revenue segments and profit margin by division
Sales & Market Share
Other Statistics
Let’s get started!
Please use the table of contents to navigate this page.
Table Of Contents
Definitions And Overview
O2. Stellantis business strategy in the Middle East & Africa
O3. How does Stellantis distribute its vehicles in the Middle East & Africa
O4. How does Stellantis provide financing to customers in the Middle East & Africa
Consolidated Sales
A1. Total Vehicle Sales in the Middle East & Africa
Sales By Country
B1. Vehicle Sales in Turkey, Algeria, Morocco, Gulf, Israel, Egypt, etc.
B2. Vehicle Sales in Turkey, Algeria, Morocco, Gulf, Israel, Egypt, etc., in Percentage
B3. Growth Rates of Vehicle Sales in Turkey, Algeria, Morocco, Gulf, Israel, Egypt, etc.
Consolidated Market Share
C1. Total Market Share in the Middle East & Africa
Market Share By Country
D1. Market Share in Turkey, Algeria, Morocco, Gulf, Israel, Egypt, etc.
Market Share Vs Competitors
E1. Market Share in the Middle East & Africa vs Competitors
Conclusion And Reference
S1. Insight
S2. References and Credits
S3. Disclosure
Definitions
To help readers understand the content better, the following terms and glossaries have been provided.
Gulf: The Gulf includes Bahrain, Kuwait, Oman, Qatar, Saudi Arabia, UAE, and Yemen.
Overseas France: Overseas France includes French Guiana, Mayotte, Reunion, Martinique and Guadeloupe.
Israel Zone: Israel Zone includes Israel and Palestine.
Other: Other excludes Iran, Sudan and Syria.
New Vehicle Sales: Stellentis defines its new vehicle sales as the sales of vehicles primarily by dealers and distributors or, directly by the company in some cases, to retail customers and fleet customers.
Sales include mass-market and luxury vehicles manufactured at Stellantis’ plants and vehicles manufactured by joint ventures and third-party contract manufacturers and distributed under its brands. Sales figures exclude sales of vehicles that it contracts to manufacture for other OEMs.
While vehicle sales are illustrative of Stellantis’s competitive position and the demand for its vehicles, sales are not directly correlated to net revenues, cost of revenues, or other measures of financial performance in any given period.
For a discussion of Stellantis’ vehicle shipments that directly correlate to its Net revenues, Cost Of revenues, and other financial measures, you may visit this article: Stellantis Vehicle Wholesale.
Stellantis business strategy in the Middle East & Africa
One of the key aspects of Stellantis’ strategy is establishing a strong manufacturing base in the Middle East & Africa. The company plans to leverage the manufacturing capabilities of its existing facilities in Morocco, Egypt, and South Africa to produce vehicles that cater to the needs of local consumers. The company also plans to explore opportunities to establish new regional manufacturing facilities.
Regarding product offerings, Stellantis plans to introduce new models to the market tailored to the needs of the Middle East and Africa. The company has identified SUVs and pick-up trucks as two segments with significant growth potential in the region and plans to introduce new models in these categories.
Stellantis also plans to invest in technology and innovation to improve the overall customer experience. The company will develop new technologies that enhance vehicle safety, connectivity, and sustainability.
Overall, Stellantis’ strategy for the Middle East and Africa is focused on expanding its regional presence by investing in local manufacturing, increasing its product offerings, and leveraging technology and innovation to improve the customer experience.
How does Stellantis distribute its vehicles in the Middle East & Africa
Stellantis distributes its vehicles in the Middle East and Africa region through various channels.
In Turkey, a national sales company distributes Peugeot, Citroën, DS, and Opel brands. In contrast, Fiat, Alfa Romeo, and Jeep brands are distributed through a joint venture with Koc Automotive Group.
In Morocco, a national sales company manages the distribution of Fiat, Alfa Romeo, and Jeep, while local importers handle Peugeot, Citroën, DS, and Opel brands.
In South Africa, Stellantis operates through a national sales company that distributes all its brands.
Stellantis has agreements with local general distributors for all other regional markets, with its regional offices in Cairo and Dubai coordinating operations in Egypt and the Middle East.
How does Stellantis provide financing to customers in the Middle East & Africa
Stellantis provides financing to its customers in the Middle East and Africa through various channels.
In Turkey, for example, the activities related to the FCA (Fiat Chrysler Automobiles) brands are carried out through a Tofas subsidiary, which mainly offers financial services to retail customers.
On the other hand, the activities related to the PSA (Peugeot S.A.) brands are carried out by a subsidiary of BPF, which markets a range of retail financing and insurance products in cooperation with TEB Finansman AS, a subsidiary of BNPP PF, and Garanti Bank, a subsidiary of BBVA.
In other markets, Stellantis operates vendor programs with bank partners to provide dealer and retail customer financing access.
For instance, in South Africa, the Stellantis brand sales are supported by Wesbank, covering both wholesale and retail financing under the FCA Finance South Africa brand.
In Morocco, FCA Bank provides financing for the dealer financing activity limited to the FCA brands, while private label agreements with Wafasalaf support sales to retail customers.
Vehicle Sales in the Middle East & Africa
Stellantis-vehicle-sales-in-the-Middle-East-and-Africa
(click image to expand)
A definition of Stellantis’ vehicle sales is available here: vehicle sales.
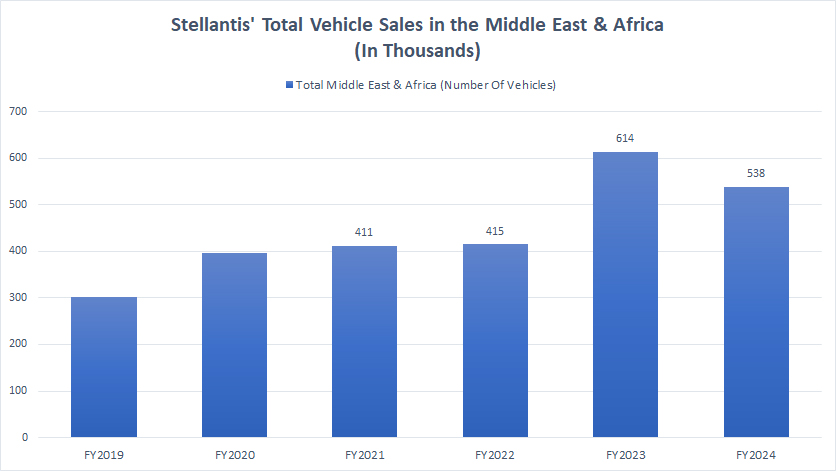
In fiscal year 2023, Stellantis surpassed the 500,000 vehicle sales mark for the first time in the Middle East & Africa, and this strong growth momentum extended into fiscal year 2024.
The following table shows a detailed sales breakdown:
Vehicle Sales in FY2024:
| Country | Vehicle Sales (in thousand units) |
|---|---|
| Total Middle East & Africa | 538 |
3-Year Sales Trend from FY2021 to FY2024:
| Country | Vehicle Sales (in thousand units) | % Changes |
|---|---|---|
| Total Middle East & Africa | 411 to 538 | +30.9% |
5-Year Sales Trend from FY2019 to FY2024:
| Country | Vehicle Sales (in thousand units) | % Changes |
|---|---|---|
| Total Middle East & Africa | 302 to 538 | +78.1% |
Vehicle Sales in Turkey, Algeria, Morocco, Gulf, Israel, Egypt, etc.
Stellantis-vehicle-sales-in-the-Middle-East-and-Africa-by-country
(click image to expand)
The definitions of Stellantis’ vehicle sales are available here: vehicle sales.
Stellantis’s regions are defined here: Gulf, Overseas France, Israel Zone, and Other.
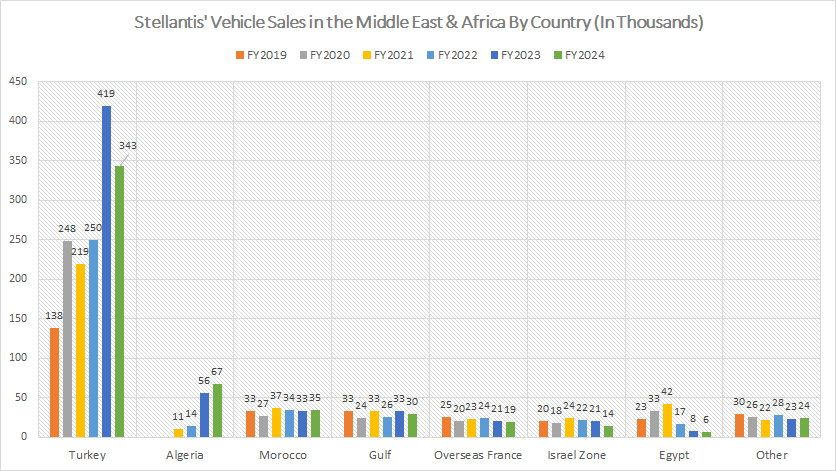
Stellantis’ biggest market in the Middle East & Africa is Turkey, with vehicle sales exceeding 400,000 units in fiscal year 2023. Egypt used to be one of Stellantis’ biggest markets. However, sales in this country have steadily plummeted over the years.
Overall, Stellantis’ vehicle sales in most countries in the Middle East & Africa have remained relatively solid, highlighting Stellantis’ competitive position in this region.
The following table shows a detailed sales breakdown:
Vehicle Sales in FY2024:
| Country | Vehicle Sales (in thousand units) |
|---|---|
| Turkey | 343 |
| Algeria | 67 |
| Morocco | 35 |
| Gulf | 30 |
| Overseas France | 19 |
| Israel Zone | 14 |
| Egypt | 6 |
| Other | 24 |
3-Year Sales Trend from FY2021 to FY2024:
| Country | Vehicle Sales (in thousand units) | % Changes |
|---|---|---|
| Turkey | 219 to 343 | +56.6% |
| Algeria | 11 to 67 | +509.1% |
| Morocco | 37 to 35 | -5.4% |
| Gulf | 33 to 30 | -9.1% |
| Overseas France | 23 to 19 | -17.4% |
| Israel Zone | 24 to 14 | -41.7% |
| Egypt | 42 to 6 | -85.7% |
| Other | 22 to 24 | +9.1% |
5-Year Sales Trend from FY2019 to FY2024:
| Country | Vehicle Sales (in thousand units) | % Changes |
|---|---|---|
| Turkey | 138 to 343 | +148.6% |
| Algeria | – | – |
| Morocco | 33 to 35 | +6.1% |
| Gulf | 33 to 30 | -9.1% |
| Overseas France | 25 to 19 | -24.0% |
| Israel Zone | 20 to 14 | -30.0% |
| Egypt | 23 to 6 | -73.9% |
| Other | 30 to 24 | -20.0% |
Vehicle Sales in Turkey, Algeria, Morocco, Gulf, Israel, Egypt, etc., in Percentage
Stellantis-vehicle-sales-in-the-Middle-East-and-Africa-by-country-in-percentage
(click image to expand)
Stellantis’s regions are defined here: Gulf, Overseas France, Israel Zone, and Other.
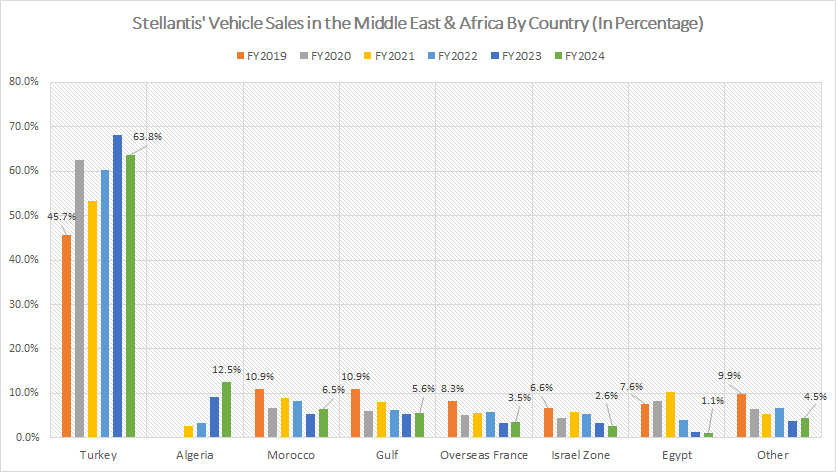
Turkey remains the dominant contributor to Stellantis’ retail vehicle sales in the Middle East & Africa region, consistently making up the majority of total volume. Meanwhile, each of the other countries in the region accounts for less than 10% of Stellantis’ vehicle sales.
The following table shows a detailed result:
Vehicle Sales in FY2024:
| Country | Percentage (%) |
|---|---|
| Turkey | 63.8% |
| Algeria | 12.5% |
| Morocco | 6.5% |
| Gulf | 5.6% |
| Overseas France | 3.5% |
| Israel Zone | 2.6% |
| Egypt | 1.1% |
| Other | 4.5% |
3-Year Sales Trend from FY2021 to FY2024:
| Country | Percentage (%) | % Point Changes |
|---|---|---|
| Turkey | 53.3% to 63.8% | +10.5% |
| Algeria | 2.7% to 12.5% | +9.8% |
| Morocco | 9.0% to 6.5% | -2.5% |
| Gulf | 8.0% to 5.6% | -2.5% |
| Overseas France | 5.6% to 3.5% | -2.1% |
| Israel Zone | 5.8% to 2.6% | -3.2% |
| Egypt | 10.2% to 1.1% | -9.1% |
| Other | 5.4% to 4.5% | -0.9% |
5-Year Sales Trend from FY2019 to FY2024:
| Country | Percentage (%) | % Point Changes |
|---|---|---|
| Turkey | 45.7% to 63.8% | +18.1% |
| Algeria | – | – |
| Morocco | 10.9% to 6.5% | -4.4% |
| Gulf | 10.9% to 5.6% | -5.4% |
| Overseas France | 8.3% to 3.5% | -4.7% |
| Israel Zone | 6.6% to 2.6% | -4.0% |
| Egypt | 7.6% to 1.1% | -6.5% |
| Other | 9.9% to 4.5% | -5.5% |
Growth Rates of Vehicle Sales in Turkey, Algeria, Morocco, Gulf, Israel, Egypt, etc.
Stellantis-growth-rates-of-vehicle-sales-in-the-Middle-East-and-Africa-by-country
(click image to expand)
Stellantis’s regions are defined here: Gulf, Overseas France, Israel Zone, and Other.
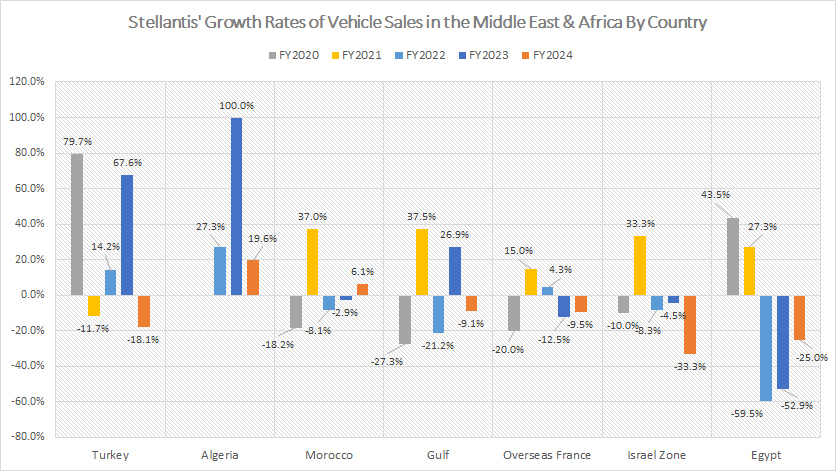
Stellantis experienced a considerable decline in vehicle sales growth across the Middle East & Africa (MEA) region in fiscal year 2024. Only a few countries in the region managed to achieve sales growth during this period.
The following table shows a detailed breakdown:
Vehicle Sales Growth in FY2024:
| Country | Sales Growth (%) |
|---|---|
| Turkey | -18.1% |
| Algeria | +19.6% |
| Morocco | +6.1% |
| Gulf | -9.1% |
| Overseas France | -9.5% |
| Israel Zone | -33.3% |
| Egypt | -25.0% |
| Other | +4.3% |
| Total Region | -12.4% |
3-Year Average Sales Growth from FY2022 to FY2024:
| Country | Sales Growth (%) |
|---|---|
| Turkey | +21.2% |
| Algeria | +49.0% |
| Morocco | -1.7% |
| Gulf | -1.1% |
| Overseas France | -5.9% |
| Israel Zone | -15.4% |
| Egypt | -45.8% |
| Other | +4.6% |
| Total Region | +12.2% |
5-Year Average Sales Growth from FY2020 to FY2024:
| Country | Sales Growth (%) |
|---|---|
| Turkey | +26.3% |
| Algeria | – |
| Morocco | +2.8% |
| Gulf | +1.4% |
| Overseas France | -4.5% |
| Israel Zone | -4.6% |
| Egypt | -13.3% |
| Other | -3.0% |
| Total Region | +14.3% |
Total Market Share in the Middle East & Africa
Stellantis-market-share-in-the-Middle-East-and-Africa
(click image to expand)
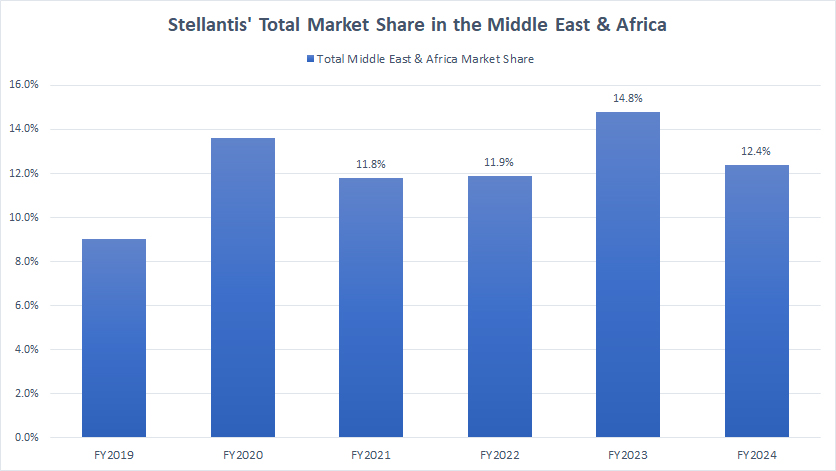
Stellantis has managed to maintain its market share in the Middle East & Africa region in most periods.
The following table shows a detailed breakdown:
Market Share in FY2024:
| Country | Market Share (%) |
|---|---|
| Total Middle East & Africa | 12.4% |
3-Year Market Share Trend from FY2021 to FY2024:
| Country | Market Share (%) | % Point Changes |
|---|---|---|
| Total Middle East & Africa | 11.8% to 12.4% | +0.6% |
5-Year Market Share Trend from FY2019 to FY2024:
| Country | Market Share (%) | % Point Changes |
|---|---|---|
| Total Middle East & Africa | 9.0% to 12.4% | +3.4% |
Market Share in Turkey, Morocco, Gulf, Israel, Egypt, etc.
Stellantis-market-share-in-the-Middle-East-and-Africa-by-country
(click image to expand)
The definitions of Gulf, Overseas France, Israel Zone, and Other are available here: Gulf, Overseas France, Israel Zone, and Other.
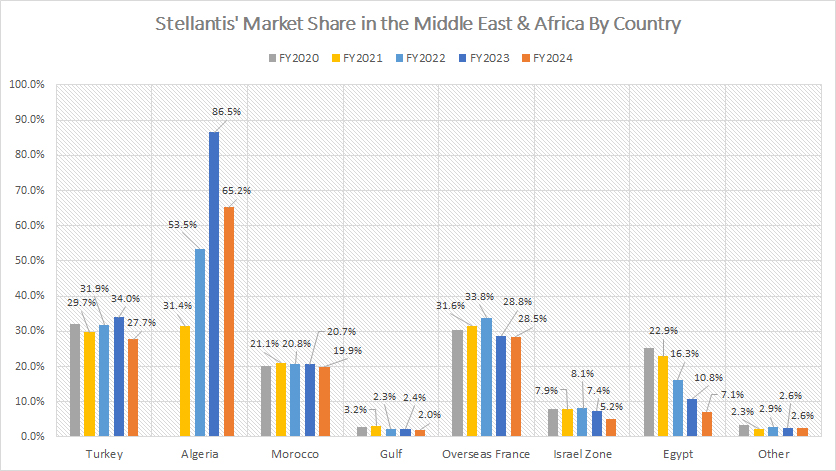
Stellantis’ market share has remained relatively stable across most countries in the Middle East & Africa (MEA) region, with the exception of Egypt, where the automaker has experienced a significant decline
The following table shows more details:
Market Share in FY2024:
| Country | Market Share (%) |
|---|---|
| Turkey | 27.7% |
| Algeria | 65.2% |
| Morocco | 19.9% |
| Gulf | 2.0% |
| Overseas France | 28.5% |
| Israel Zone | 5.2% |
| Egypt | 7.1% |
| Other | 2.6% |
3-Year Market Share Trend from FY2021 to FY2024:
| Country | Market Share (%) | % Point Changes |
|---|---|---|
| Turkey | 29.7% to 27.7% | -2.0% |
| Algeria | 31.4% to 65.2% | +33.8% |
| Morocco | 21.1% to 19.9% | -1.2% |
| Gulf | 3.2% to 2.0% | -1.2% |
| Overseas France | 31.6% to 28.5% | -3.1% |
| Israel Zone | 7.9% to 5.2% | -2.7% |
| Egypt | 22.9% to 7.1% | -15.8% |
| Other | 2.3% to 2.6% | +0.3% |
5-Year Market Share Trend from FY2019 to FY2024:
| Country | Market Share (%) | % Point Changes |
|---|---|---|
| Turkey | 28.8% to 27.7% | -1.1% |
| Algeria | – | – |
| Morocco | 20.1% to 19.9% | -0.2% |
| Gulf | 3.1% to 2.0% | -1.1% |
| Overseas France | 30.9% to 28.5% | -2.4% |
| Israel Zone | 7.8% to 5.2% | -2.6% |
| Egypt | 14.3% to 7.1% | -7.2% |
| Other | – | – |
Market Share in the Middle East & Africa vs Competitors
Stellantis-market-share-in-the-Middle-East-and-Africa-vs-competitors
(click image to expand)
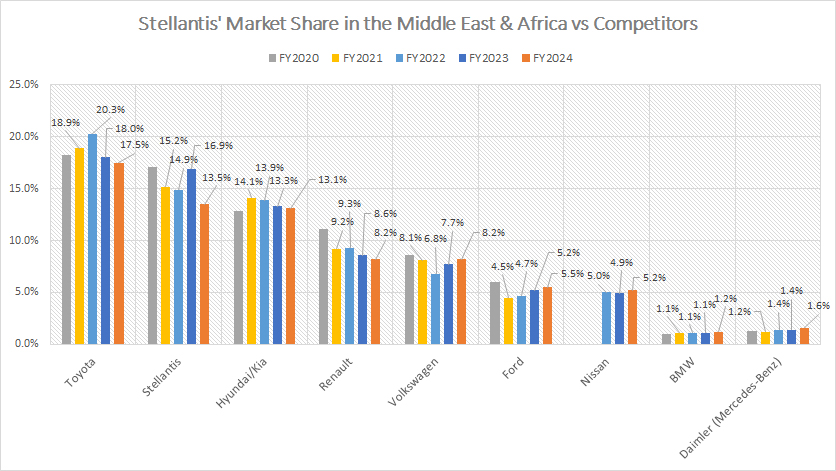
Following its 2021 merger, Stellantis emerged as the second-largest automobile company in the Middle East & Africa, ranking just behind Toyota.
A notable trend in the region has been the steady rise in market share for Toyota and Hyundai/Kia since 2020, while most European automakers have experienced a decline.
The following table shows more details:
Market Share in FY2024:
| Automaker | Market Share (%) |
|---|---|
| Toyota | 17.5% |
| Stellantis | 13.5% |
| Hyundai/Kia | 13.1% |
| Renault | 8.2% |
| Volkswagen | 8.2% |
| Ford | 5.5% |
| Nissan | 5.2% |
| BMW | 1.2% |
| Daimler (Mercedes-Benz) | 1.6% |
| Other | 26.0% |
3-Year Market Share Trend from FY2021 to FY2024:
| Automaker | Market Share (%) | % Point Changes |
|---|---|---|
| Toyota | 18.9% to 17.5% | -1.4% |
| Stellantis | 15.2% to 13.5% | -1.7% |
| Hyundai/Kia | 14.1% to 13.1% | -1.0% |
| Renault | 9.2% to 8.2% | -1.0% |
| Volkswagen | 8.1% to 8.2% | +0.1% |
| Ford | 4.5% to 5.5% | +1.0% |
| Nissan | – | – |
| BMW | 1.1% to 1.2% | +0.1 |
| Daimler (Mercedes-Benz) | 1.2% to 1.6% | +0.4% |
| Other | 27.6% to 26.0% | -1.6% |
5-Year Market Share Trend from FY2019 to FY2024:
| Automaker | Market Share (%) | % Point Changes |
|---|---|---|
| Toyota | 20.3% to 17.5% | -2.8% |
| Stellantis | – | – |
| Hyundai/Kia | – | – |
| Renault | 10.6% to 8.2% | -2.4% |
| Volkswagen | 8.2% to 8.2% | +0.0% |
| Ford | – | – |
| Nissan | – | – |
| BMW | 1.1% to 1.2% | +0.1 |
| Daimler (Mercedes-Benz) | 1.0% to 1.6% | +0.6% |
| Other | 26.4% to 26.0% | -0.4% |
Insight
Despite achieving record vehicle sales in fiscal year 2023 and maintaining its status as the second-largest automaker in the region after Toyota, Stellantis faced significant challenges in fiscal year 2024, with its sales growth deteriorating.
While Turkey remains its dominant market, contributing the majority of its regional sales, Algeria has emerged as a key driver of growth, whereas Egypt has seen a sharp decline in sales and market share.
From a competitive standpoint, Stellantis has held its market share across most MEA countries, though the company faces mounting pressure from rising competitors such as Toyota and Hyundai/Kia.
References and Credits
1. All financial figures presented were obtained and referenced from Stellantis’ quarterly and annual reports published on the company’s investor relations page: Stellantis Investor Relation.
2. Pixabay images.
Disclosure
We may use artificial intelligence (AI) tools to assist us in writing some of the text in this article. However, the data is directly obtained from original sources and meticulously cross-checked by our editors multiple times to ensure its accuracy and reliability.
If you find the information in this article helpful, please consider sharing it on social media. Additionally, providing a link back to this article from any website can help us create more content like this in the future.
Thank you for your support and engagement! Your involvement helps us continue to provide high-quality, reliable content.

