Blockchain. Pixabay Image
In this article, you will find various statistics related to the debt of Coinbase Global (NASDAQ: COIN).
Specifically, we will cover Coinbase’s total debt, net debt, debt leverage, etc.
In addition, we also look at the company’s debt due, liquidity, and credit rating.
Let’s move on!
Please use the table of contents to navigate this article.
Table Of Contents
Definitions And Overview
Debt
A1. Total Debt
A2. Total Debt With Leases Included
Cash
B1. Available Cash
Net Debt
C1. Total Debt Less Available Cash
Leverage
Debt Vs Revenue
E1. Total Debt Vs Revenue
E2. Debt Margin
Capital Structure
Debt Schedules, Liquidity And Credit Rating
G1. Debt And Other Payments Due
G2. Sources Of Liquidity
G3. Credit Rating
Summary And Reference
S1. Conclusion
S2. References and Credits
S3. Disclosure
Definitions
To help readers understand the content better, the following terms and glossaries have been provided.
USD Coins: USDC, which stands for USD Coin, is a type of cryptocurrency known as a stablecoin. The value of USDC is pegged to the US dollar, meaning one USDC is generally equivalent to one US dollar.
This peg is maintained through the use of reserves, where for every USDC issued, there is an equivalent amount of US dollars or equivalent assets held in reserve. This approach aims to combine the benefits of digital currency, such as speed and security of transactions, with the stable value of the US dollar, making USDC useful for digital payments and financial services and as a stable digital store of value.
USDC is built on several blockchain platforms, including Ethereum, making it widely accessible and interoperable with various cryptocurrency services and decentralized applications.
Debt Margin: The debt margin for a corporation in relation to its revenue is a financial metric used to assess the proportion of a company’s revenue consumed by its debt obligations.
It essentially provides insight into how much of the company’s earnings are available to cover its debts, thereby indicating the company’s financial health and ability to sustain and manage its debt load.
A lower debt margin suggests that a significant portion of the company’s revenue is dedicated to debt repayment, which could signal financial strain.
Conversely, a higher debt margin indicates that a smaller percentage of revenue is needed for debt obligations, suggesting better financial stability and flexibility.
This metric can be crucial for investors and creditors in evaluating a corporation’s risk level and financial management efficiency.
Capital Structure: The capital structure of a corporation refers to how a firm finances its overall operations and growth through different sources of funds. Essentially, it’s a mix of various types of debt and equity that a company uses to finance its activities. The two main components are:
1. **Debt**: This includes bonds, loans, and other forms of borrowing. Debt is often attractive for companies because the interest payments are tax-deductible. However, too much debt increases financial risk due to the obligation to make regular interest payments and repay the principal amount at maturity.
2. **Equity**: Equity financing involves selling company shares to investors. The main advantage of equity is that, unlike debt, it does not have to be repaid. However, issuing more equity can dilute the ownership percentage of existing shareholders and involve sharing more of the company’s profits.
The optimal capital structure strikes a balance between risk and return, thereby maximizing the company’s stock price and minimizing its cost of capital. Factors influencing a corporation’s capital structure include market conditions, the company’s operational and financial risks, its business strategy, and management’s preferences.
Total Debt
Coinbase-total-debt
(click image to expand)
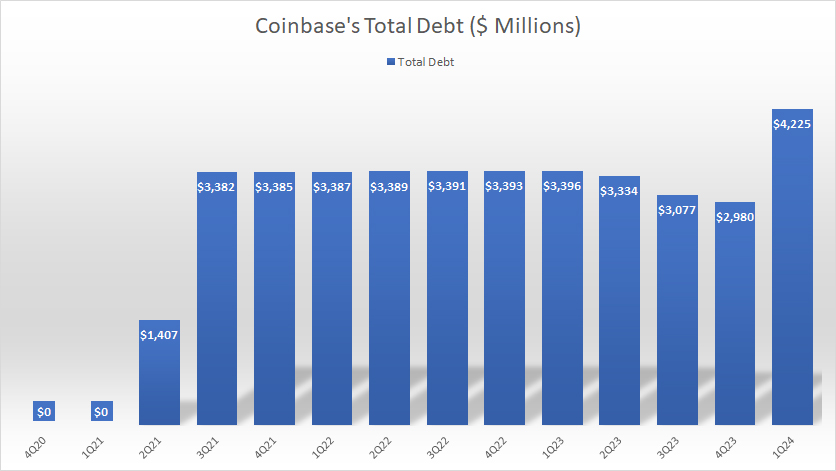
As of fiscal 1Q 2024, Coinbase’s total debt reached US$4.23 billion, up nearly $1 billion or 24% over the same quarter a year ago, according to the company’s 1Q24 10Q report.
Coinbase’s total debt of US$4.23B reported in the latest quarter comprised entirely of long-term debt. Of the total amount, around US$1.3B is due on June 1, 2026, with the remaining amount to be paid in 2028, 2030, and 2031, according to the company’s 1Q24 10Q report.
Investors are worried that Coinbase will not be able to make the payment when the debt comes due in 2026.
Therefore, does Coinbase have a debt problem?
Let’s find out.
Total Debt With Leases Included
Coinbase-total-debt-inclusive-of-leases
(click image to expand)
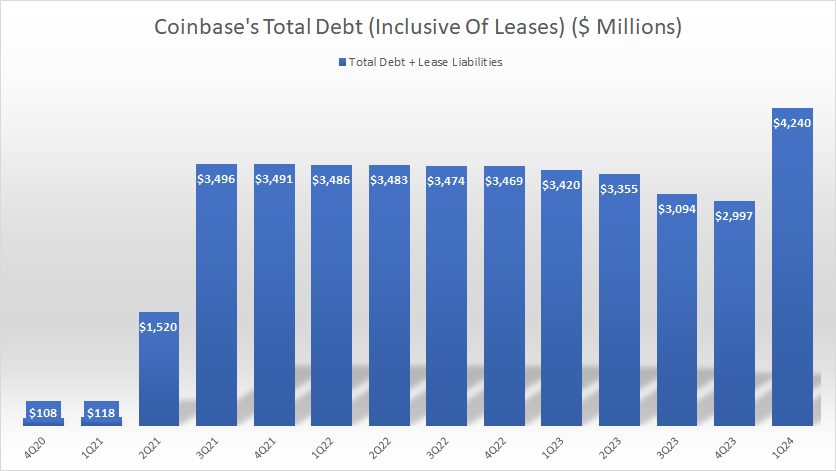
With leases included, Coinbase’s total debt has only increased marginally, to US$4.24 billion, as shown in the chart above.
Therefore, Coinbase has relatively small lease liabilities.
Again, is Coinbase’s US$4.24 billion debt a cause for concern? Can the company make the payments when they come due?
Available Cash
Coinbase-available-cash
(click image to expand)
As of 1Q 2024, Coinbase held US$7.6 billion in cash, up significantly from the quarter a year ago.
Of this amount, US$6.7 billion was cash and cash equivalents; the rest was restricted cash and USD Coins (USDC). An explanation of Coinbase’s USD Coins is available here: USD Coins.
Investors interested in the statistics of Coinbase’s cash flow and cash on hand may visit this page: Coinbase Cash On Hand And Free Cash Flow.
Total Debt Less Available Cash
Coinbase-net-debt
(click image to expand)
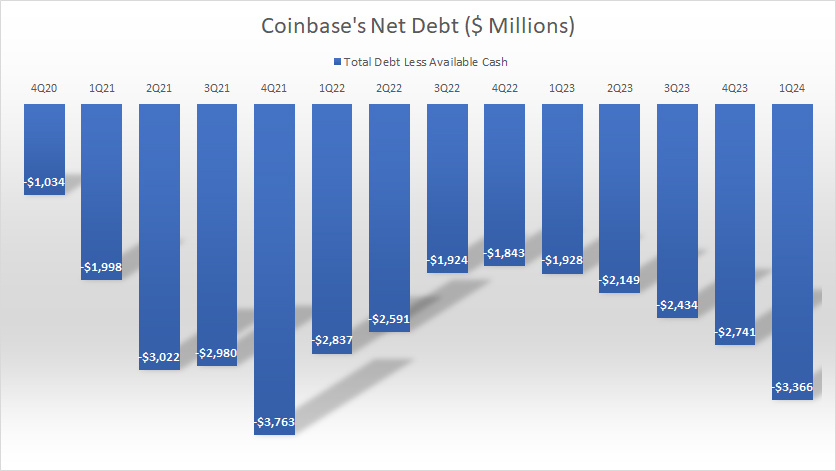
After taking into account the available cash, Coinbase’s net debt amounted to -US$3.4 billion as of 1Q 2024, suggesting that the company held more cash than debt.
In addition, Coinbase has had more available cash than total debt, resulting in a consistently negative net debt, as shown in the chart above.
Therefore, Coinbase could settle its entire debt with its available cash.
In short, the debt of US$4.24 billion held by Coinbase is unlikely to pose a significant risk to the company’s financial health.
Debt To Equity Ratio
Coinbase-debt-to-equity-ratio
(click image to expand)
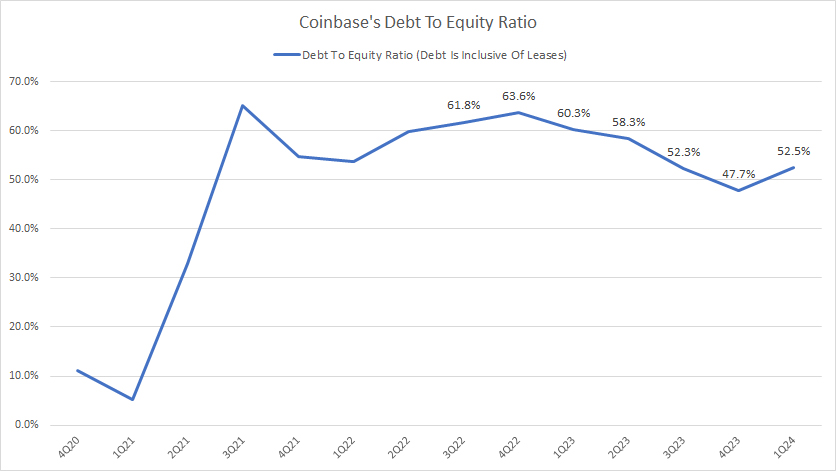
Coinbase’s total debt represents only 52.5% of its equity in fiscal 1Q 2024, down significantly over the quarter a year ago. Therefore, Coinbase had a debt-to-equity ratio of 0.52X, implying a much bigger equity than its total debt.
Although Coinbase’s total debt, with leases included, surged considerably in 1Q 2024 to a record figure of $4.24 billion, its leverage did not rise by a single bit, indicating a comparable rise in its equity along with the debt.
Total Debt Vs Revenue
Coinbase-debt-vs-revenue
(click image to expand)
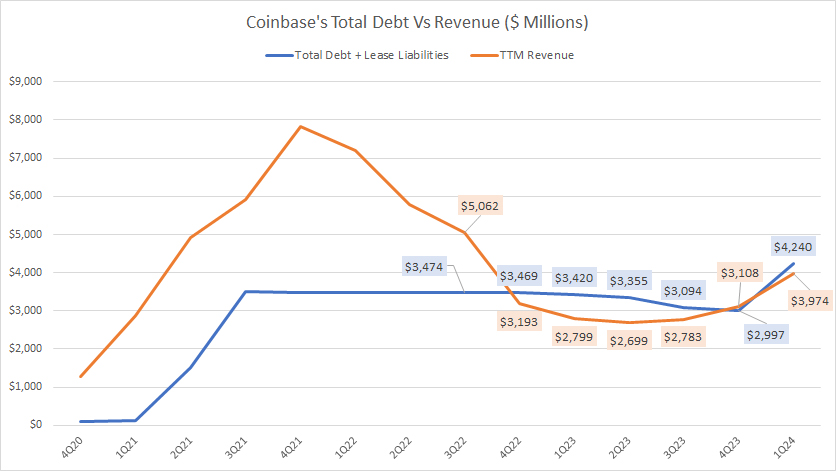
Coinbase used to have much higher revenue but sales have considerably declined in the post-pandemic era, as shown in the chart above.
Since the pandemic, Coinbase’s revenue has decreased to a level lower than its total debt, creating a challenging financial situation for the company.
This decrease in revenue can be attributed to the pandemic’s impact on the global economy and the fluctuations in the cryptocurrency market.
Coinbase’s declining revenue is concerning as it may negatively impact the company’s financial health, resulting in difficulty paying off its debts.
The good news is that Coinbase’s revenue has considerably risen recently, surging to nearly $4 billion as of 1Q 2024, along with the rise of its debt.
Coinbase’s soaring revenue has countered the fear of declining sales and a surding debt, which in most cases, are bad for the financial health of any company.
Debt Margin
Coinbase-debt-to-revenue-ratio
(click image to expand)
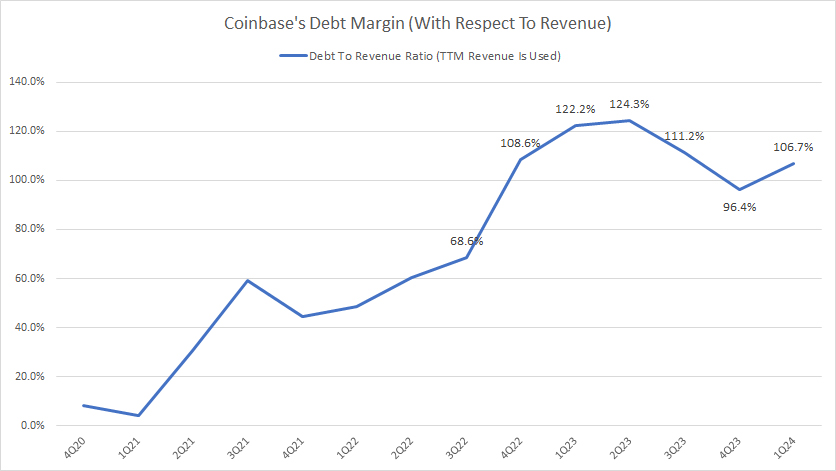
The definition of Coinbase’s debt margin is available here: debt margin. The chart above shows that Coinbase’s rising debt margin is unfavorable for the company.
A debt margin exceeding 100% indicates a much higher debt figure than revenue.
The good news is that Coinbase’s debt margin has come down considerably in recent periods despite having a rising debt figure.
Coinbase’s decreasing debt margin indicates the much faster growth of its revenue than its debt, which is usually a good sign of a healthy business prospect.
Capital Structure
Coinbase-debt-to-asset-ratio
(click image to expand)
The definition of Coinbase’s capital structure is available here: capital structure. Coinbase’s total debt made up about 31.8% of its total assets as of 1Q 2024, with the rest being equity and other liabilities.
Compared to the ratio a year ago, the latest result was slightly lower, indicating a decreasing debt level with respect to total assets.
Coinbase’s debt ratio of 32% implies that only around one-third of the company’s assets are financed by debt, while the rest is financed by equity and other liabilities.
Debt And Other Payments Due
Coinbase’s debt and other payments due data are obtained from the 1Q 2024 quarterly report dated 31 March 2024.
| Debt And Other Payments | Amounts Due (US$ Millions) | |
|---|---|---|
| Next 12 Months | Total | |
| Operating Leases | $11.2 | $15.2 |
| Non-Cancelable Purchase Obligations | $245.0 | $479.2 |
| 2026 Convertible Notes | ||
| Interest | $6.4 | $15.9 |
| Principal | $- | $1,273.0 |
| 2028 Senior Notes | ||
| Interest | $33.8 | $168.8 |
| Principal | $- | $1,000.0 |
| 2030 Senior Notes | ||
| Interest | $- | $- |
| Principal | $- | $1,265.0 |
| 2031 Senior Notes | ||
| Interest | $26.7 | $213.9 |
| Principal | $- | $737.5 |
| Other | $10.6 | $10.6 |
| Total | $333.7 | $5,179.1 |
The table above shows Coinbase’s debt and other payments due within the next 12 months as of March 31, 2024.
Apart from the debt, Coinbase has other payments that come due, such as leases and committed purchase obligations.
On a consolidated basis, Coinbase’s total payments due in the next 12 months amounted to US$333.7 million as of 1Q 2024, as shown in the table above.
For the total amount, Coinbase owed as much as US$5.2 billion as of 1Q 2024.
Nevertheless, can Coinbase afford the payments due in the next 12 months?
We will find out in the next discussion.
Sources Of Liquidity
Coinbase’s liquidity data are obtained from the 3Q 2023 quarterly report dated 30 Sept 2023.
| Sources Of Liquidity | US$ Millions | |
|---|---|---|
| Committed Capacity | Available Capacity | |
| Company Cash | ||
| Cash & Cash Equivalents | – | $6,711.4 |
| Restricted Cash | – | $33.5 |
| USD Coins (USDC) | – | $860.7 |
| Credit Facilites | ||
| Credit Available | – | – |
| Cash Flow | ||
| Consolidated Operating Cash Flow | – | $1,125.3 (estimated) |
| Total Liquidity | ||
| Total | – | $8,730.9 |
Coinbase’s sources of liquidity include cash, restricted cash, USDC, and cash provided by operating activities. USDC definition is available here: Coinbase USDC.
On a consolidated basis, Coinbase’s total liquidity totaled US$8.7 billion as of 1Q 2024 after accounting for net cash from operations.
With this level of liquidity, Coinbase seems to easily cover the payment due in the next 12 months, which totaled slightly over US$333 million, as shown in the previous section.
Even without the operating cash flow, Coinbase has enough liquidity to cover the upcoming payments due.
Moreover, Coinbase’s total liquidity can even cover the entire amount owed, which totaled slightly over US$5.2 billion as of 1Q 2024.
In short, Coinbase has sufficient liquidity to meet all payment obligations due in the next 12 months and beyond.
Credit Rating
Coinbase’s credit rating as of 31 March 2024.
| Ratings For Coinbase Global, Inc. | ||||
|---|---|---|---|---|
| Rating Agencies | Types Of Debt | Outlook | ||
| Issuer Default/Corporate | Long-Term Senior Unsecured | |||
| Moody’s | B2 | B1 | N.A. | |
| Standard & Poor’s | BB- | BB- | N.A. | |
In January 2023, S&P Global Ratings announced a downgrade of Coinbase’s issuer credit rating and senior unsecured debt from BB to BB-, and Moody’s Investors Service (“Moody’s”) announced a downgrade of Coinbase’s Corporate Family Rating (“CFR”) to B2 from Ba3 and downgraded the guaranteed senior unsecured notes to B1 from Ba2.
In short, Coinbase obtained a non-investment grade for its corporate and long-term debt as of 1Q 2024.
Moody’s credit rating definitions can be found here – Moody’s.
Standard & Poor’s credit rating definitions can be found here – Hargreaves Lansdown.
Summary
Despite a decline in revenue due to the COVID-19 pandemic and fluctuations in the cryptocurrency market, Coinbase has maintained a stable total debt level, with the amount increasing to $4.24 billion as of 1Q 2024.
In addition, Coinbase has had more available cash than total debt, resulting in a consistently negative net debt.
Coinbase’s debt-leverage ratio was minor at just 0.52X. The company has also maintained a debt-to-equity ratio of less than 1.0X, indicating a cautious approach to borrowing.
Although Coinbase obtained a non-investment grade for its corporate and long-term debt as of 1Q 2024, it is unlikely to pose a significant risk to its financial health.
Apart from that, Coinbase’s revenue has significantly risen in recent periods, indicating the company’s improving business prospect, driven by the rise in crypto prices.
In addition, Coinbase’s total liquidity is sufficient to cover all payments due, which include interest payments, debt due, leases, and pur chase obligations, in the next 12 months.
In short, Coinbase appears to have no liquidity issues, and is in good financial standing.
References and Credits
1. All financial figures presented in this article were obtained and referenced from Coinbase Global, Inc.’s annual and quarterly filings, earnings reports, news releases, shareholder presentations, etc., which are available in Coinbase Investor Relations.
2. Pixabay images.
Disclosure
References and examples such as tables, charts, and diagrams are constantly reviewed to avoid errors, but we cannot warrant the total correctness of all content.
The content in this article is for informational purposes only and is neither a recommendation nor a piece of financial advice to purchase a stock.
If you find the information in this article helpful, please consider sharing it on social media and providing a link to it from any website so that more articles like this can be created.
Thank you!

