Digital web. Pixabay Image.
This article delves into the cash position and cash flow statistics of Coinbase Global, Inc. – one of the world’s most well-known and widely used cryptocurrency exchanges.
In a separate article, Coinbase Revenue And Profit, we learned that Coinbase was once a highly profitable firm with operating income exceeding US$3 billion in fiscal year 2021.
However, its profitability plummeted in 2022 due to increasing operating costs, resulting in a significant loss for the company.
The bad news is that the massive operating loss continues into the end of fiscal 2023 and possibly 2024.
Is the company’s cash flow having the same fate as its profitability?
Let’s take a look.
Please use the table of contents to navigate this page.
Table Of Contents
Definitions And Overview
- Customer Custodial Funds
- Operating Cash Flow
- Free Cash Flow
- Net Cash From Financing Activities
- Cash Flow Margin
- UCD Coins (USDC)
O2. Why Does Coinbase Keep So Much Cash?
Consolidated Results
A1. Cash & Cash Equivalents
A2. Total Cash On Hand
A3. Customer Custodial Funds
Ratio
B1. Cash On Hand To Current Assets Ratio
Cash Flow
C1. Net Cash From Operations
C2. Free Cash Flow
Cash Flow Margins
D1. Operating Cash Flow Margin
D2. Free Cash Flow Margin
Cash Flow From Financing Activities
E1. Net Cash Adjusted For Debt Borrowing And Repayment
Conclusion And Reference
S1. Conclusion
S2. References and Credits
S3. Disclosure
Definitions
To help readers understand the content better, the following terms and glossaries have been provided.
Customer Custodial Funds: Coinbase’s customer custodial funds refer to the fiat currencies and cryptocurrencies that Coinbase holds on behalf of its customers.
These funds are kept separate from Coinbase’s own operational funds to ensure that customer assets are protected and can be returned to customers even if Coinbase were to face financial difficulties.
The custodial nature of these funds means that Coinbase acts as a custodian, holding the funds securely and executing transactions as directed by the customer, without taking ownership of the assets themselves.
This arrangement is crucial for maintaining trust and security in the platform’s operations, ensuring that users’ assets are safeguarded against unauthorized access or misuse.
Operating Cash Flow: Operating cash flow (OCF) measures the cash generated by a company’s regular business activities. This metric indicates if a company can generate enough positive cash flow to sustain and expand its operations or if it needs external financing for capital expansion. In other words, OCF helps to assess a company’s ability to fund its current and future growth without relying on external sources.
Free Cash Flow: Free cash flow (FCF) refers to a company’s cash generated after accounting for the cash outflows supporting its operations and maintaining its capital assets. Simply put, it is the cash remaining after a company’s payment of operating expenses (OpEx) and capital expenditures (CapEx).
Net Cash From Financing Activities: Net cash from financing activities refers to the total cash inflows and outflows associated with the financing activities of a company over a specific period.
This includes proceeds from issuing debt or equity, payments made to retire debt, dividends paid to shareholders, and repurchases of company shares. Essentially, it reflects the changes in capital and borrowings of an organization and is a crucial component of a company’s cash flow statement, helping stakeholders understand how the company raises capital and repays its investors.
Cash Flow Margin: The cash flow margin is a financial ratio that calculates the cash generated as a percentage of total sales revenue over a specific period. This metric is a reliable indicator of a company’s cash flow efficiency.
USD Coin or USDC: A stablecoin issued by Circle that is backed by dollar-denominated assets held by the issuer in segregated accounts with U.S. regulated financial institutions. Coinbase and Circle co-founded the Centre Consortium, which supports and administers the governance of USDC.
Why Does Coinbase Keep So Much Cash?
Coinbase, like many companies within the rapidly evolving and volatile cryptocurrency market, opts to keep a significant portion of its reserves in cash for several reasons:
1. **Liquidity**: Cash ensures that Coinbase can easily meet its short-term operational costs and obligations without needing to sell volatile assets, which may not always be favourable. This liquidity is crucial for day-to-day operations, including payroll, rent, and other overheads.
2. **Volatility Protection**: The cryptocurrency market is highly volatile. By holding a substantial amount of cash, Coinbase can shield itself from adverse impacts due to sudden drops in the value of cryptocurrencies. This conservative approach helps stabilize their operations despite market fluctuations.
3. ** Regulatory Compliance and Risk Management **: The regulatory environments around cryptocurrencies are still evolving. Holding cash allows Coinbase to navigate these uncertain waters more safely, ensuring they have the funds to comply with potential regulatory requirements or cover unforeseen legal costs without liquidating assets at a loss.
4. **Investment and Acquisition Opportunities**: Having cash on hand gives Coinbase the flexibility to quickly seize investment opportunities or acquire other companies without selling assets, which might not be timely or could result in losses.
For your information, Coinbase’s crypto asset investment was worth over US$2 billion as of 1Q 2024, according to this article: Coinbase crypto asset investment and holdings.
5. **Customer Trust and Stability**: Demonstrating that they have significant cash reserves can build and maintain trust with users and investors, showing that Coinbase has the stability and resources to support its operations and customer assets even in adverse market conditions.
6. **Interest Income**: In a rising interest rate environment, holding cash or cash equivalents can be a source of income through interest, which can be a low-risk way to generate additional revenue.
It’s a strategic choice that balances risk management with operational flexibility, aiming to ensure long-term stability and growth in the unpredictable landscape of cryptocurrency trading and services.
Cash & Cash Equivalents
Coinbase-cash-and-cash-equivalents
(click image to expand)
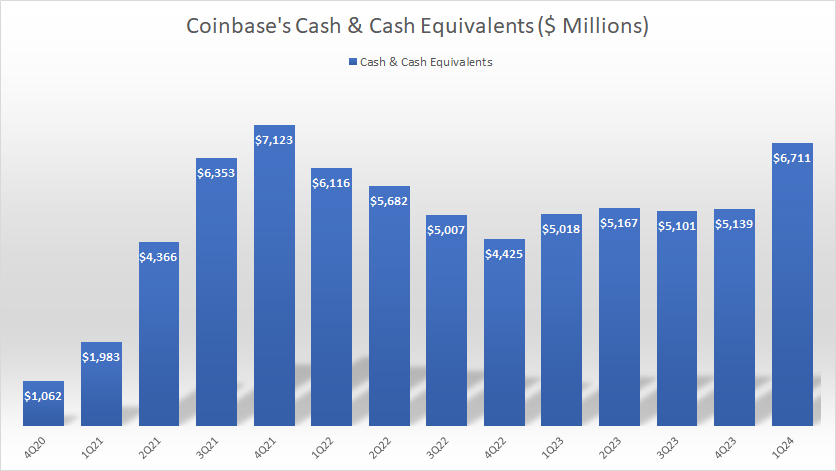
As of 1Q 2024, Coinbase had $6.7 billion in cash and cash equivalents, a much higher figure than the $5 billion reported a year ago.
On average, Coinbase’s cash and cash equivalents have measured $5.4 billion each quarter since 1Q 2023.
The significant rise in Coinbase’s cash and cash equivalents in fiscal 1Q 2024 was primarily due to a debt proceed which the company received in 1Q 2024, as illustrated here: Coinbase’s debt borrowing and repayment.
Total Cash On Hand
Coinbase-total-cash
(click image to expand)
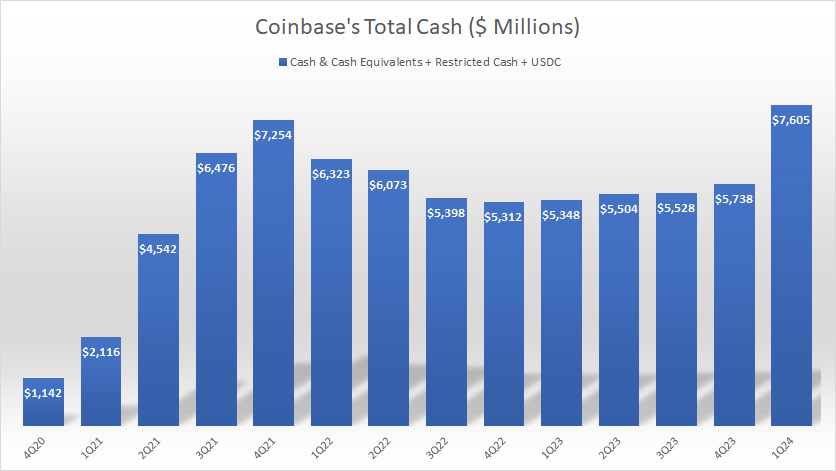
Besides carrying cash and cash equivalents, Coinbase also carries restricted cash and USD Coins (USDC). The definition of Coinbase’s USD Coins is available here: USD Coins.
According to Coinbase, USDC is a stablecoin that can be redeemed one USDC for one U.S. dollar on demand.
While not accounted for as cash or cash equivalents, Coinbase treats its USDC holdings as a liquidity resource.
That said, Coinbase’s total cash on hand reached a record figure of US$7.6 billion as of 1Q 2024 after considering the restricted cash and USDC.
On average, Coinbase’s total cash on hand has measured $5.9 billion each quarter since 1Q 2023.
Customer Custodial Funds
Coinbase-customer-custodial-funds
(click image to expand)
The definition of Coinbase’s customer custodial funds is available here: customer custodial funds.
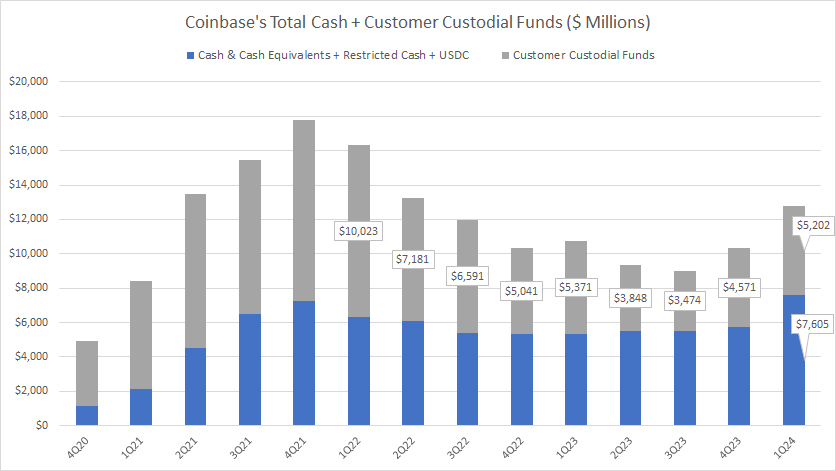
Apart from its own cash and cash equivalents, Coinbase also holds a considerable amount of customer cash, which we refer to it as customer custodial funds. As the definition goes, this particular cash does not belong to the company.
As of 1Q 2024, Coinbase held $5.2 billion in customer custodial funds, rouhgly the same as the level from a year ago, according to the 1Q24 10-Q report.
Compared to the record low of $3.5 billion recorded in 3Q 2023, Coinbase’s latest amount of customer custodial funds was significantly up.
When we combined the customer custodial funds with the cash and cash equivalents, restricted cash, and USDC, Coinbase’s total cash on hand reached a massive amount of $12.8 billion as of 1Q 2024.
Cash On Hand To Current Assets Ratio
Coinbase-total-cash-to-current-assets-ratio
(click image to expand)
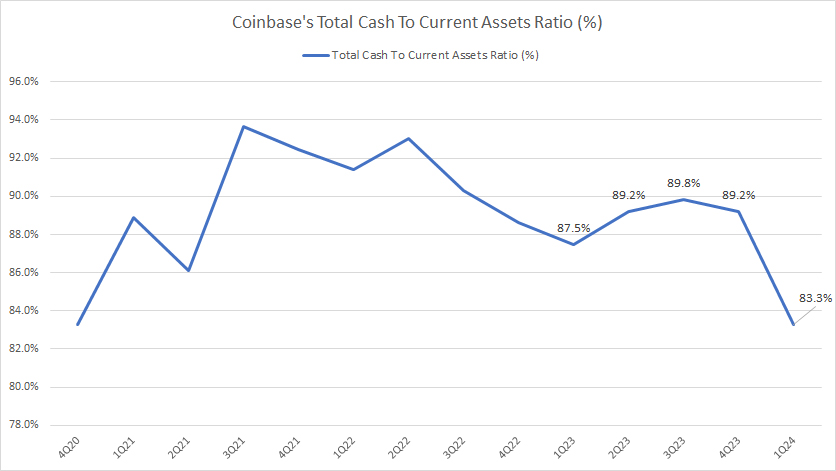
The majority of Coinbase’s current assets consist primarily of cash, representing 83% of the total current assets in fiscal Q1 2024.
This ratio has remained relatively the same in all periods shown, indicating the large amount of cash the company has carried in most periods.
Net Cash From Operations
Coinbase-net-cash-from-operations
(click image to expand)
The definition of Coinbase’s net cash from operations is available here: net cash from operations.
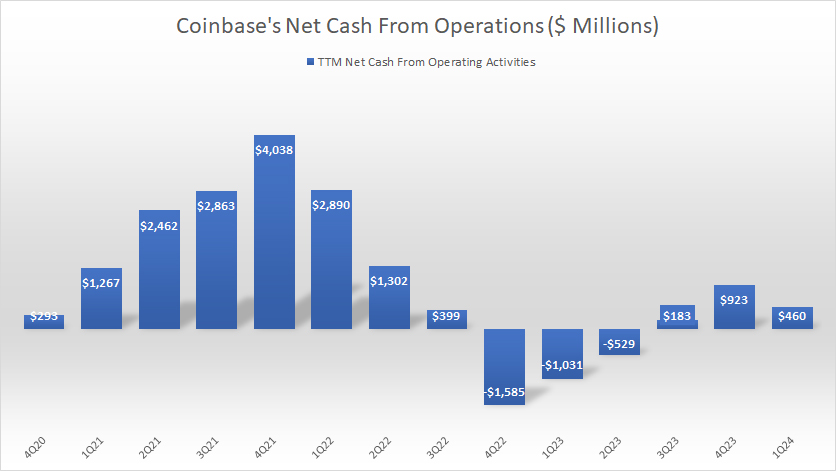
Coinbase’s net cash from operations has slowly recovered in recent periods after going through several quarters of negative cash flow. It reached $460 million as of 1Q 2024 on a TTM basis. Coinbase has consecutively generated positive operating cash flow since Q3 2023.
Although net cash from operating activities has recovered, it is far below the previous highs, indicating that there might be room for improvement.
Free Cash Flow
Coinbase-free-cash-flow
(click image to expand)
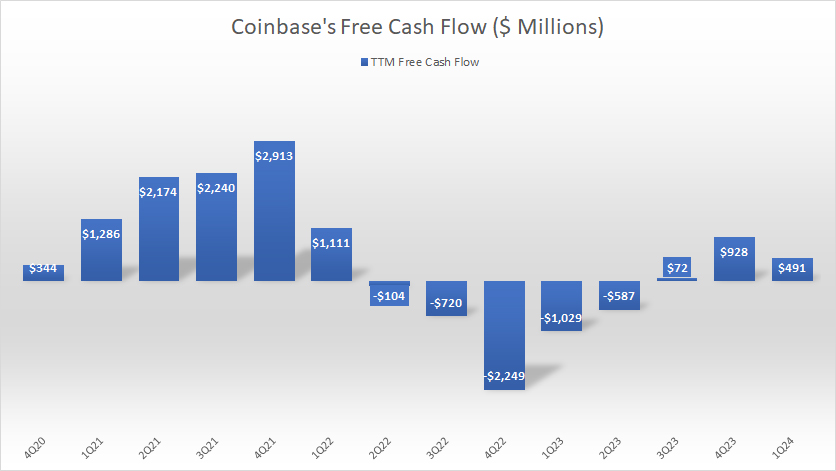
The definition of Coinbase’s free cash flow is available here: free cash flow. Coinbase’s free cash flow is cash left from operating activities after accounting for the entire net cash from investing activities.
That said, Coinbase’s free cash flow has been slowly recovering in recent periods, reaching nearly $500 million as of 1Q 2024 on a TTM basis.
However, it is still far from the record figures recorded during the COVID periods, which suggests that there may still be plenty of room for growth.
Operating Cash Flow Margin
Coinbase-operating-cash-flow-margin
(click image to expand)
The definition of Coinbase’s cash flow margin is available here: cash flow margin.
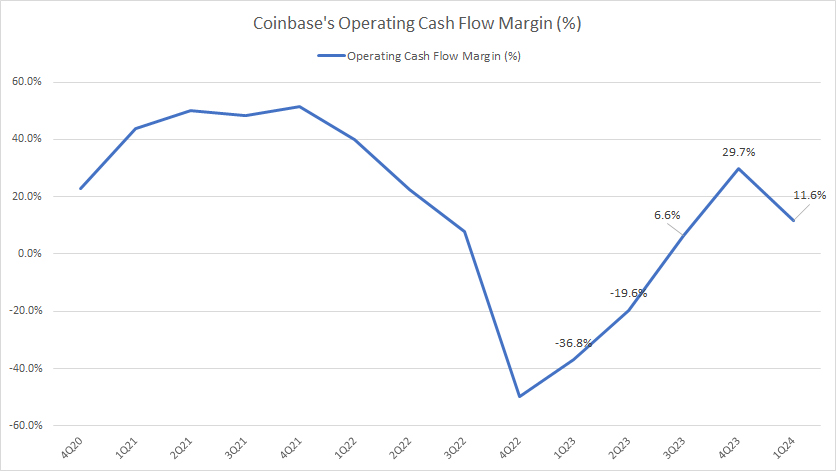
Coinbase’s operating cash flow margin has surged considerably in recent years, reaching 11.6% as of 1Q 2024, up significantly from the ratio recorded a year ago.
The significant recovery in Coinbase’s operating cash flow margin illustrates the company’s improving efficiency in converting operating cash flow from revenue.
Free Cash Flow Margin
Coinbase-free-cash-flow-margin
(click image to expand)
The definition of Coinbase’s cash flow margin is available here: cash flow margin.
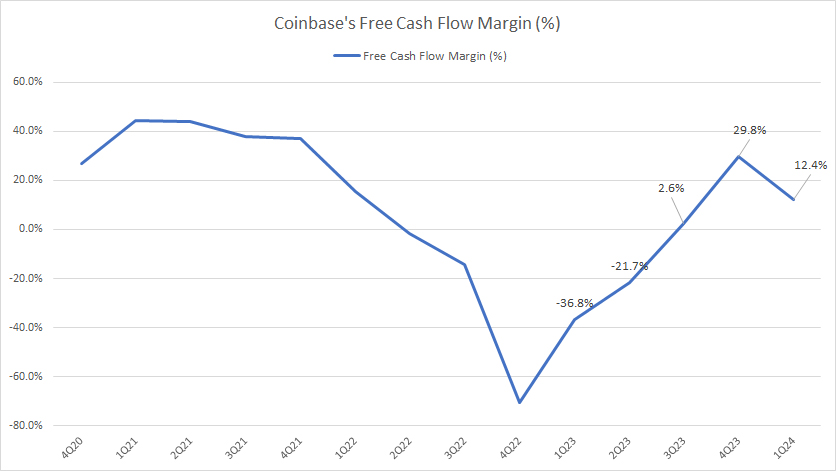
Similarly, Coinbase’s free cash flow margin also has significantly recovered since 2023, topping a record figure of 12.4% as of 1Q 2024, up considerably over the same quarter a year ago.
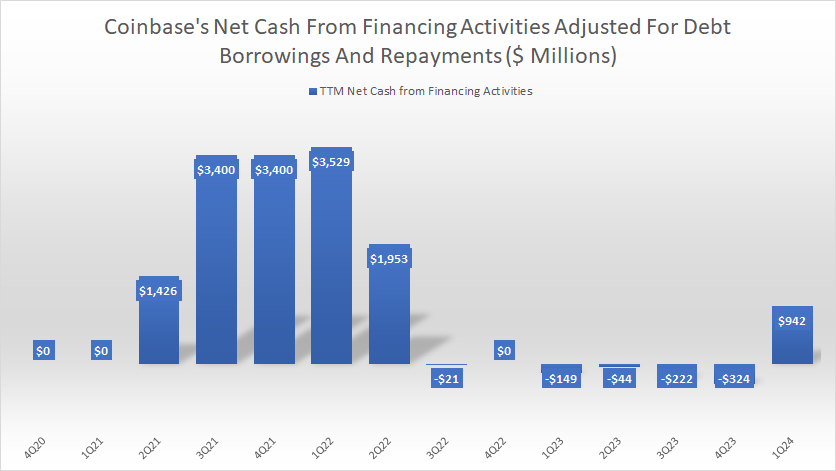
Net Cash Adjusted For Debt Borrowing And Repayment
Coinbase-net-cash-adjusted-for-debt-borrowing-and-repayment
(click image to expand)
Positive figures indicate cash inflow from debt borrowings, while negative figures indicate cash outflow for debt repayments.
Coinbase was seen taking on debt in most periods in the earlier years. However, since 2023, Coinbase has been repaying debt in most periods, as reflected in all the negative figures.
As of 1Q 2024, Coinbase took on debt again, with the proceed reaching $942 million on a TTM basis. This debt proceed has contributed significantly to the rise in Coinbase’s cash and cash equivalent which we saw earlier in this section: Coinbase cash & cash equivalents.
Coinbase’s debt borrowings in 1Q 2024 also can be seen in this article: Coinbase debt.
Summary
Coinbase held a significant cash balance as of 1Q 2024, with the total cash on hand figure reaching US$7.6 billion.
Apart from its own cash, Coinbase also held customer cash, referring to as customer custodial funds. This particular cash exceeded $5 billion as of 1Q 2024.
Together with the customer custodial cash, Coinbase’s total cash measured over $12.8 billion as of 1Q 2024.
Moverover, Coinbase has recovered considerably in terms of operating and free cash flow generation in recent periods.
In addition, Coinbase took on debt borrowing as of 1Q 2024. The debt proceed contributed significantly to the rise in Coinbase’s cash and cash equivalents in the same period.
References and Credits
1. All financial figures presented in this article were obtained and referenced from Coinbase Global, Inc.’s annual and quarterly filings, earnings reports, news releases, shareholder presentations, etc., which are available in Coinbase Investor Relations.
2. Pixabay images.
Disclosure
References and examples such as tables, charts, and diagrams are constantly reviewed to avoid errors, but we cannot warrant the total correctness of all content.
The content in this article is for informational purposes only and is neither a recommendation nor a piece of financial advice to purchase a stock.
If you find the information in this article helpful, please consider sharing it on social media and provide a link to this article from any website so that more articles like this can be created.
Thank you!

